B
Bull
Bull · 25%GOOGL
$268.91
Scenario price
$288.150
+3.198 (+1.11%)At close
Alphabet Inc. is a holding company. The Company's segments include Google Services, Google Cloud, and Other Bets. The Google Services segment includes products and services such as ads, Android, Chrome, devices, Google Maps, Google Play, Search, and YouTube. The Google Cloud segment includes infrastructure and platform services, collaboration tools, and other services for enterprise customers. Its Other Bets segment is engaged in the sale of healthcare-related services and Internet services. Its Google Cloud provides enterprise-ready cloud services, including Google Cloud Platform and Google Workspace. Google Cloud Platform provides access to solutions such as artificial intelligence (AI) offerings, including its AI infrastructure, Vertex AI platform, and Gemini for Google Cloud; cybersecurity, and data and analytics. Google Workspace includes cloud-based communication and collaboration tools for enterprises, such as Calendar, Gmail, Docs, Drive, and Meet.
Currently, Alphabet Inc (GOOGL) is not a strong buy due to its recent earnings miss and declining search revenue growth. The stock is priced at $284.99, with a forward P/E ratio of 19.05, indicating potential overvaluation compared to its earnings outlook. Additionally, the RSI is at 31.48, suggesting it is oversold, but this could lead to further declines if market sentiment does not improve. The main risk is the recent EPS miss of 2.12 against an estimate of 2.94, which has raised concerns about future revenue growth.
Wells Fargo
$365
2026-11-02
Wells Fargo
2026-11-02
Price Target
$365
Wells Fargo
$371
2026-10-30
Wells Fargo
2026-10-30
Price Target
$371
Citi
$375
2026-10-30
Citi
2026-10-30
Price Target
$375
Truist
$410
2026-10-29
Truist
2026-10-29
Price Target
$410
DA Davidson
$300
2026-10-29
DA Davidson
2026-10-29
Price Target
$300
Scenario prices are the last monthly forecast band of the current year. Probabilities are fixed model weights (25 / 50 / 25), not guarantees.
Google's Soaring Capital Expenditures Raise Concerns
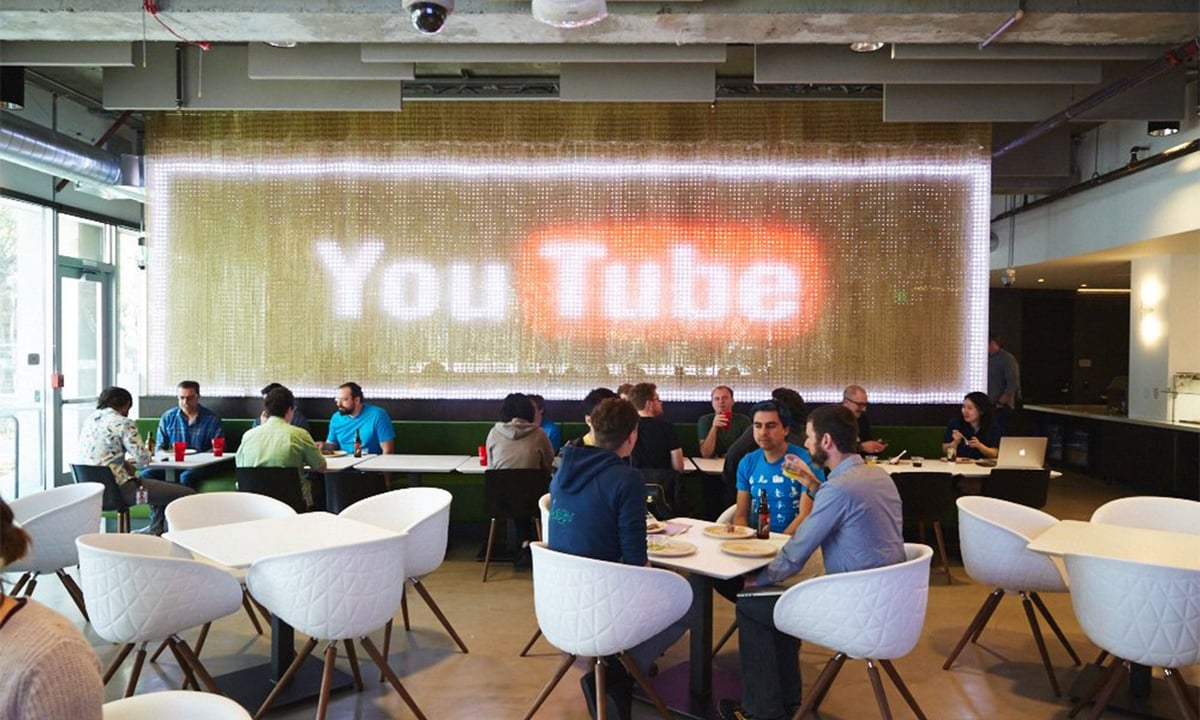
Analysis of Five Tech Companies Facing Slowing Ad Revenue Growth

Nasdaq Volatility and AI Investment Outlook
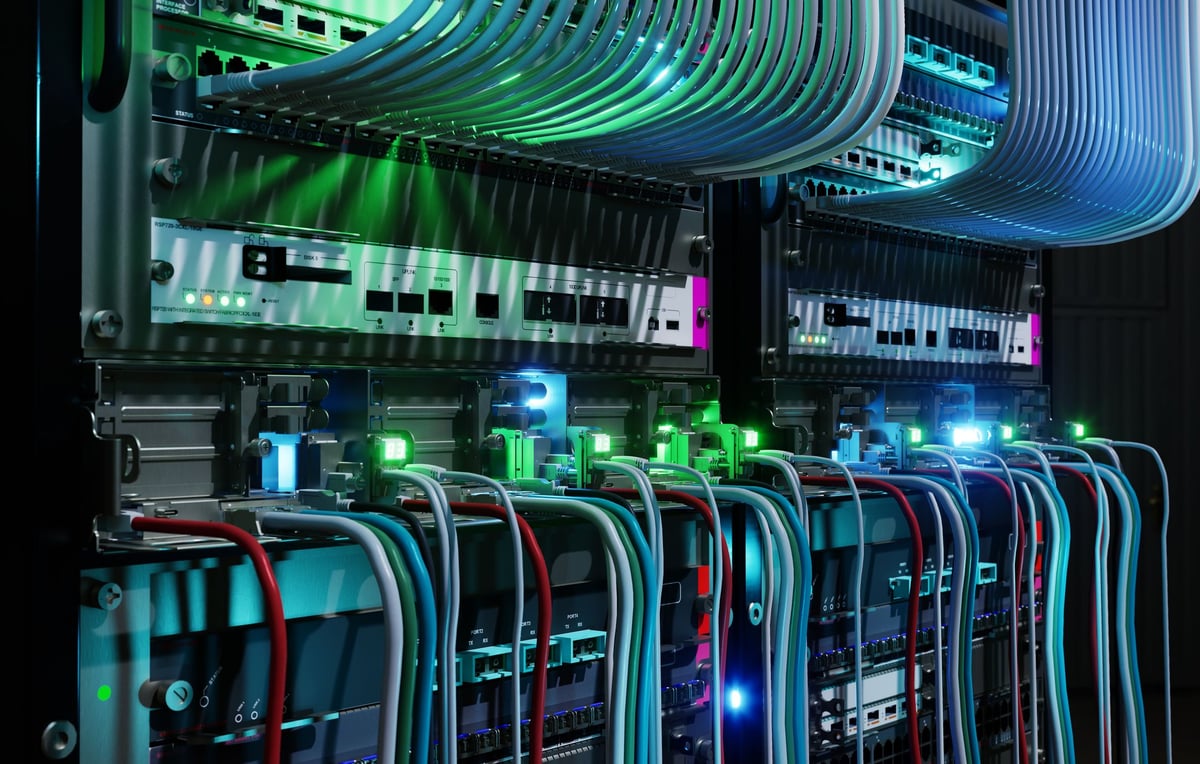
Anthropic IPO Reveals Massive Infrastructure Investments

Alphabet's Long-Term Potential in AI Investment
Alphabet Inc. is a holding company. The Company's segments include Google Services, Google Cloud, and Other Bets. The Google Services segment includes products and services such as ads, Android, Chrome, devices, Google Maps, Google Play, Search, and YouTube. The Google Cloud segment includes infrastructure and platform services, collaboration tools, and other services for enterprise customers. Its Other Bets segment is engaged in the sale of healthcare-related services and Internet services. Its Google Cloud provides enterprise-ready cloud services, including Google Cloud Platform and Google Workspace. Google Cloud Platform provides access to solutions such as artificial intelligence (AI) offerings, including its AI infrastructure, Vertex AI platform, and Gemini for Google Cloud; cybersecurity, and data and analytics. Google Workspace includes cloud-based communication and collaboration tools for enterprises, such as Calendar, Gmail, Docs, Drive, and Meet. It operates in the Technology sector (SERVICES-COMPUTER PROGRAMMING, DATA PROCESSING, ET industry).
Currently, Alphabet Inc (GOOGL) is not a strong buy due to its recent earnings miss and declining search revenue growth. The stock is priced at $284.99, with a forward P/E ratio of 19.05, indicating potential overvaluation compared to its earnings outlook. Additionally, the RSI is at 31.48, suggesting it is oversold, but this could lead to further declines if market sentiment does not improve. The main risk is the recent EPS miss of 2.12 against an estimate of 2.94, which has raised concerns about future revenue growth.
43 analysts cover GOOGL: 38 rate it Buy, 5 Hold and 0 Sell. The average price target is 374.25.

$GOOGL downside momentum is fading, a high-probability long signal has appeared, adding to the long position. #USOctoberCPIAboutToBeReleased #TraderAnalysis
Show more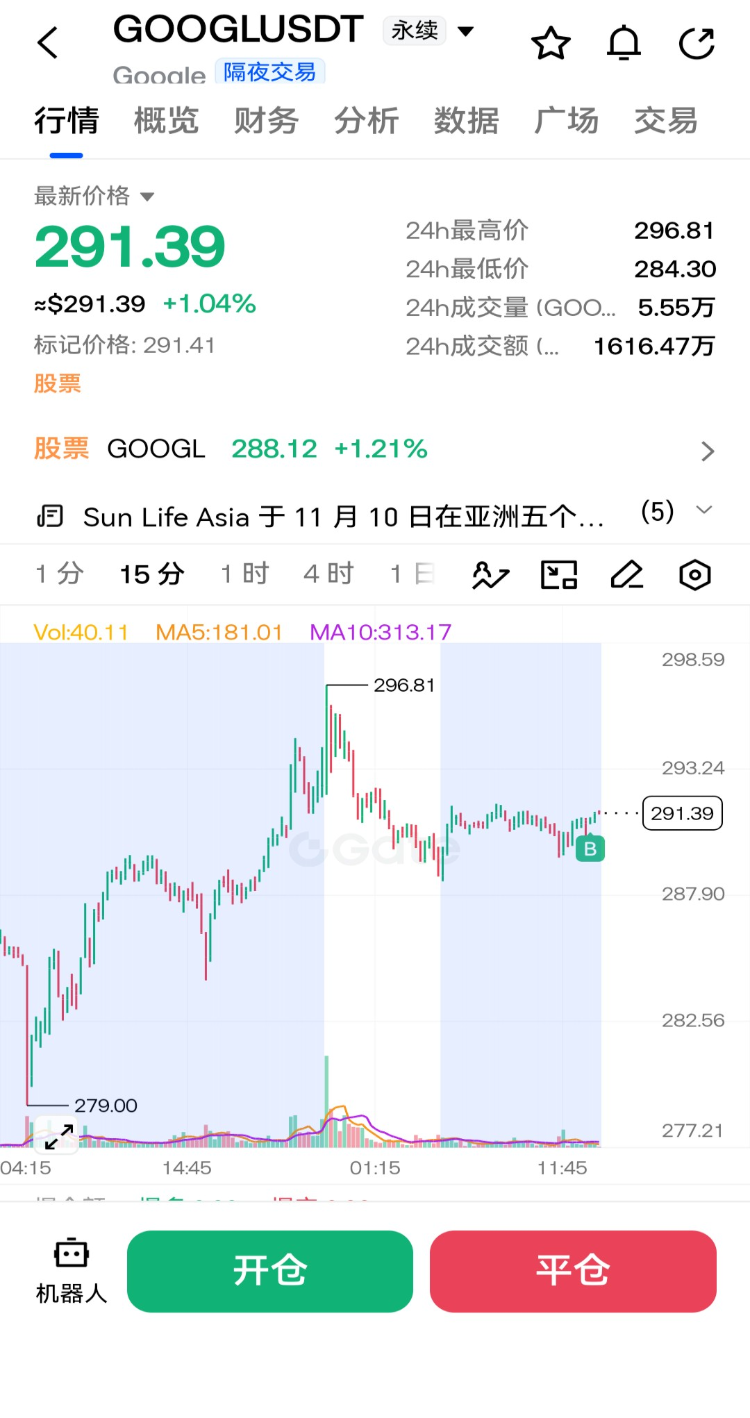


Funding rates have been positive for three days straight, which means longs in perpetual futures are paying interest to shorts. I know this picture well — when I was selling options for premium last year, I loved this kind of structure. Back then, selling options meant earning time value and volatility premium; the more crowded the market and the more bullish the sentiment, the thicker the premium. Now, with funding rates consistently positive, it's essentially the same type of signal: long positioning on the futures side is too crowded, and the cost of holding is rising. Under the typical perpetual futures mechanism, funding settles every 8 hours. Even at just 0.01%–0.03% per day, over three days that's a real holding cost — the higher the leverage, the more painful it gets. Futures longs are trapped deep, with margin and liquidation lines sitting there, getting more passive the further it drops. Spot is easier by comparison — no liquidation line, so you can average down in batches and wait it out. At this level on the S&P 500, I'm watching my DCA rhythm, not guessing the bottom. Every time the index drops a notch, I add a notch; the deeper it falls, the heavier I add. No predictions, just accumulation. For example, split the position into several tranches — add one unit for every 3%–5% pullback in the index, increase the per-tranche amount once the drawdown exceeds 10%, and restore the base DCA once it returns to the normal range. The benefit isn't buying at the absolute low, but replacing "figuring out where the bottom is" with "accumulating more units in cheap territory." The 2022 rate-hike valuation squeeze is a good example: the S&P 500 fell about 19% for the year, the Nasdaq about 33%. People who kept guessing the bottom wore themselves out, while those accumulating by tranches were able to bring their cost basis down. NVDA down 30%, GOOGL down just over 30%, MCD also down 30% — leaders getting cut together signals a systemic valuation squeeze, not a collapse of individual company stories. Especially with a defensive consumer leader like MCD also down 30%, it shows the problem isn't any single company's earnings but discount rates, risk appetite, and liquidity contracting together. A similar picture appeared in 2022: NVDA drew down over 50% at one point, GOOGL around 40%. When leaders sell off in sync, the more news there is and the noisier it gets, the easier it is to obscure what really matters — the valuation anchor is moving, not every headline. DCA, plainly put, is admitting you can't call the short term but betting on the long-term direction. Not flinching when it drops is worth more than anything. So what about you — waiting for a signal, or just buying according to plan?
Show more


This page is for research only and is not investment advice. Models can be wrong. Past performance does not guarantee future results.