

AI CapEx ROI After the October Wobble: How Investors Should Read Hyperscaler Earnings
After Meta's FCF scare and Alphabet's cash burn: investor guide to evaluating AI CapEx versus free cash flow across MSFT, GOOGL, AMZN, and META stocks.

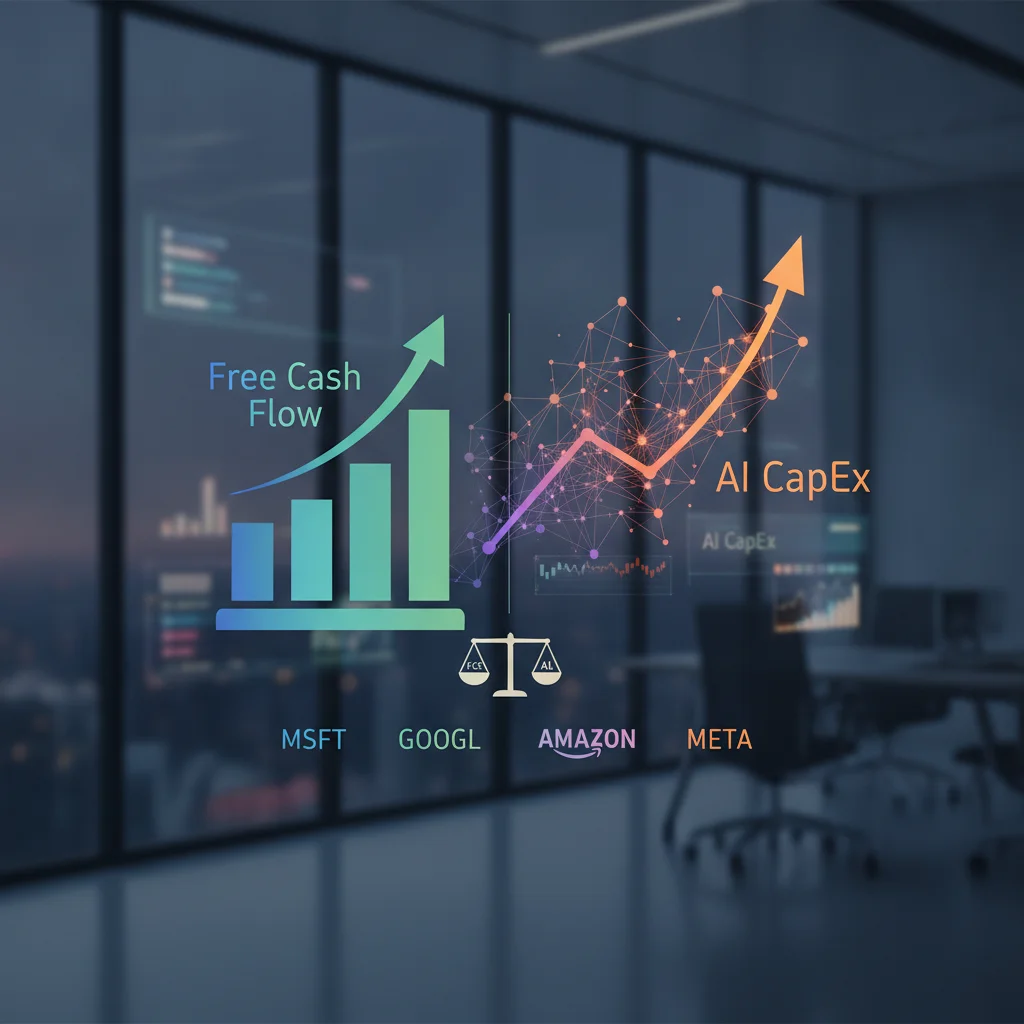
Key Takeaway
The AI trade did not break in late October 2026 because cloud demand disappeared. It wobbled because investors stopped treating capital expenditure as an automatic proxy for future earnings power and started asking a harder question: what is the cash return on each incremental dollar of AI infrastructure? Meta's October 21 report—solid advertising, roughly $2.12 billion of negative free cash flow, and a narrowed 2026 CapEx band of $135–$145 billion—reset the emotional baseline. Alphabet's October 28 print then deepened the debate, with Google Cloud more than doubling while free cash flow plunged to about negative $9.07 billion and shares sank roughly 10%.
Microsoft's same-night contrast mattered just as much. Azure grew about 48%, revenue reached $92.3 billion, and free cash flow stayed positive at roughly $18.6 billion even after CapEx including finance leases of $45.2 billion. The market rewarded that cash-conversion story with a jump in extended trading. Amazon, reporting into the same week with a roughly $220 billion 2026 cash CapEx plan, became the third test of whether hyperscaler AI spend can stay self-funding. Around all of this, the Federal Reserve held the funds rate at 3.75%–4.00% in a 10–2 vote—removing one binary headline without automatically re-rating multi-year AI payback stories.
This magazine guide is an investor framework for AI CapEx ROI, not a sell-side dump of every line item. It shows how to read CapEx definitions, free-cash-flow bridges, cloud monetization evidence, and financing signals across Microsoft, Alphabet, Amazon, Meta, and the semiconductor complex that supplies them. Process beats prophecy: write the ROI questions before the print, answer them in complete sentences after it, and keep size rules explicit. Workflow tools such as Alphio Conversational Trading can turn that checklist into live watchlists instead of impulsive clicks.
Why CapEx stopped being celebrated automatically
Meta forced the cash question into the open
Meta's third-quarter revenue of about $64.6 billion, up 26% year over year, would have been an ordinary "beat and raise" night in a different cycle. Instead, CapEx including principal payments on finance leases hit roughly $34.9 billion against operating cash flow near $32.8 billion, producing negative free cash flow of about $2.12 billion—Meta's first cash burn in more than a decade as a public company. Management narrowed full-year 2026 CapEx to $135–$145 billion from a prior $130–$145 billion range and approved a new nonvoting Class C share class intended, in part, to preserve financing flexibility for growth. Shares fell nearly 7% in regular trading even after an initial after-hours bounce. Credit markets noticed too: the message was that AI ambition without visible cash conversion can reprice both equity and spreads.
The semiconductor complex absorbed the spillover. When hyperscalers reprice CapEx optics, GPU, foundry, and equipment names often move before the next cloud print fully digests. That is why NVIDIA and the broader AI-supply theme belong on the same ROI worksheet as Meta or Microsoft—not as a separate narrative that ignores who actually pays the CapEx bill.
Alphabet showed growth and cash burn can coexist
Alphabet's October 28 results made the ROI tension concrete. Revenue of about $127.6 billion grew roughly 25% but missed consensus near $128.2 billion; adjusted earnings of about $2.67 per share also missed. Google Cloud revenue more than doubled to roughly $30.7 billion, a demand signal that would have dominated headlines in 2024. Free cash flow, however, landed near negative $9.07 billion—far weaker than the roughly negative $2.7 billion many analysts expected—after CapEx of about $51.4 billion in the quarter. Management held the full-year 2026 CapEx range of $195–$205 billion and said CapEx would rise significantly in 2027, with commentary pointing to annual spend that can top $200 billion before exceeding $300 billion. Long-term debt jumped to about $125.1 billion from roughly $21.6 billion a year earlier. Search advertising, still the cash engine, grew about 12% to roughly $63.4 billion and missed Street targets. Cloud can win share while the corporate cash ledger loses the evening.
Microsoft proved positive FCF is still possible at scale
Microsoft's fiscal first-quarter 2027 report offered the bull case for disciplined AI CapEx ROI. Revenue of $92.3 billion rose 19%, adjusted EPS of about $4.89 beat roughly $4.73 consensus, and Azure—disclosed at about $33.2 billion—grew roughly 48%. CapEx including finance leases was $45.2 billion, below some Street CapEx estimates near $50.7 billion, partly because third-party capacity deliveries slipped. Cash paid for property and equipment was about $39.4 billion; operating cash flow was about $58 billion, up 29%; free cash flow was about $18.6 billion, down 27% year over year but still firmly positive. Management guided fiscal second-quarter CapEx above $50 billion, pointed to roughly $170 billion of calendar spend after capacity delays, guided Azure growth of about 49%–50% constant currency, and said the company expects to remain free-cash-flow positive through fiscal 2027 while accessing external funding when attractive. Shares rose in extended trading. The lesson is not that CapEx is "good" or "bad." It is that markets now grade the cash bridge as heavily as the growth rate.
The AI CapEx ROI scorecard investors should keep
Separate four ledgers before you debate the multiple
A useful ROI worksheet has four columns that investors often conflate. The first is demand evidence: cloud growth, backlog or remaining performance obligations, capacity constraints, and product adoption such as Gemini's reported consumer scale or Azure's disclosed dollar base. The second is CapEx intensity: quarterly CapEx, the company's own full-year guide, the mix of short-lived chips versus long-lived buildings, and whether stated CapEx includes finance leases. The third is cash conversion: operating cash flow, free cash flow, buyback or dividend capacity, and whether debt or new share classes are entering the funding mix. The fourth is monetization proof: cloud gross or operating margins, advertising efficiency, AI product attach, and any explicit comment that each CapEx dollar is supporting more revenue over time—language Microsoft's CFO emphasized on the October call.
Write those four ledgers for each ticker before you argue fair value. A stock can look cheap on next-twelve-months earnings and still be expensive on cash-on-cash AI returns if CapEx keeps outrunning operating cash generation. Conversely, a rich multiple can be defensible when backlog conversion, constrained capacity, and positive free cash flow show that CapEx is inventory of future recognized revenue rather than a permanent cash sink.
Compare CapEx definitions or you invent false precision
Microsoft often discusses CapEx including finance leases and separately reports cash additions to property and equipment. Alphabet's filed CapEx is typically purchases of property and equipment. Amazon discusses cash CapEx net of certain proceeds and incentives and has pointed to about $220 billion for 2026, up from roughly $200 billion with higher memory costs cited as a driver. Meta includes principal payments on finance leases in its CapEx outlook. Adding Microsoft near $170–$175 billion on its measure, Alphabet at $195–$205 billion, Amazon near $220 billion, and Meta at $135–$145 billion produces a rough $720–$745 billion order of magnitude for these four alone—often rounded toward an "$800 billion AI bill" in market commentary when definitions and timing blur. Investors who mix lease-inclusive and cash-only totals invent precision. Keep a definition note next to every CapEx citation on your sheet.
How to evaluate Microsoft's CapEx ROI in practice
Growth quality versus cash quality
For Microsoft, the ROI question is whether Azure's acceleration and commercial backlog conversion outpace the rise in short-lived compute spend. Azure at roughly 48% growth, with a guide near 49%–50% for the next quarter, and management's comment that demand still exceeds supply, supports the thesis that CapEx is bottleneck relief rather than speculative build. Roughly three-quarters of CapEx tied to short-lived assets such as CPUs and GPUs, including higher memory and storage costs, shortens the theoretical payback clock relative to a pure real-estate heavy build—but it also means depreciation and refresh cycles arrive faster. Positive free cash flow near $18.6 billion after a large CapEx quarter is the near-term proof point; a slide into sustained FCF compression without Azure acceleration would falsify the bull ROI case even if headline EPS still beats.
What would improve or break the thesis
Improvement looks like CapEx held near guide, Azure at or above the company's constant-currency outlook, stable or only modestly pressured cloud gross margins, and continued shareholder returns without emergency financing optics. Breakdown looks like another CapEx step-up paired with Azure deceleration, widening gaps between cash CapEx and operating cash flow, or funding language that sounds more urgent than "when attractive." Microsoft's willingness to tap debt markets as a complement—not a substitute—for operating cash is a watchpoint, not automatically a red flag, given the firm's credit profile. Treat financing optionality as a second-order signal; treat the FCF bridge as first-order.
How to evaluate Alphabet's CapEx ROI after the cash-burn print
Cloud acceleration is necessary but no longer sufficient
Alphabet's Cloud print near $30.7 billion, more than doubling year over year, is extraordinary demand evidence. The ROI problem is that Search and YouTube advertising still fund a large share of the AI ambition, and Search revenue growth near 12% missed expectations even as management cited strong query growth aided by AI. Negative free cash flow near $9.1 billion, a held $195–$205 billion 2026 CapEx range, and a signaled significant 2027 increase force investors to ask when Cloud profitability and corporate cash generation catch CapEx—not whether Cloud can grow. Operating income also missed some Street frameworks, and equity-securities marks that helped prior quarters swung to a sizable loss, reminding readers that GAAP EPS can be a noisy base for AI ROI debates.
Debt, buybacks, and the 2027 CapEx cliff
Long-term debt rising to roughly $125 billion from about $22 billion a year earlier is a structural change in Alphabet's funding story. Pausing or shrinking buybacks while CapEx climbs is another. Neither proves the AI buildout is a mistake; both prove the cash ledger has entered a new regime. For ROI scoring, track three bridges on every Alphabet print: Cloud revenue and Cloud margin, advertising growth versus CapEx growth, and free cash flow versus the stated CapEx band. A scenario where Cloud keeps taking share while ads re-accelerate and FCF moves back toward breakeven would rehabilitate the multiple. A scenario where 2027 CapEx above $300 billion arrives without clearer cash-return milestones would keep the stock trading as a cash-conversion story even if Cloud remains impressive in isolation.
If you actively manage exposure into these prints, pre-commit rules in Alphio Conversational Trading—trim if CapEx is held high and FCF stays deeply negative; add only if Cloud margin and ads both stabilize—beat improvising after the first after-hours percent move.

Open Alphio Conversational Trading
How to score Amazon and Meta on the same ROI grid
Amazon: AWS speed against a $220 billion cash CapEx plan
Amazon's July commentary pointed to about $220 billion of 2026 cash CapEx, with management still arguing that even at that level capacity would not fully meet demand. AWS in the June quarter generated roughly $42.2 billion of revenue, up about 37% year over year—its fastest growth in many quarters—with operating income near $16.6 billion. Trailing free cash flow on cash-CapEx framing used by market trackers was still an outflow near $7.6 billion at midyear. Heading into the October 29 report, the ROI questions are whether AWS growth remains capacity-constrained (supportive for pricing power and future revenue recognition), whether retail and advertising ballast softens CapEx optics, and whether any CapEx guide change arrives with a clearer path back to sustained positive free cash flow. Capacity sold out for this year and next can be bullish for AWS unit economics and still bearish for near-term corporate cash conversion—the same two-ledger tension Alphabet and Meta already displayed.
Meta: advertising cash engine versus AI infrastructure bill
Meta's ROI case rests on whether Family-of-Apps advertising—impressions up about 10% and average price per ad up about 14% in the third quarter—can fund CapEx in the mid-$100 billions while Reality Labs losses stay contained in the guided $18–$19 billion range for 2026. Negative quarterly free cash flow after a revenue beat showed that ad strength alone does not settle the debate. The Class C structure adds a financing and governance overlay: flexibility for capital raising and compensation can support long-duration investment, but markets will watch whether that flexibility becomes a serial dilution narrative. For Meta, score advertising durability, CapEx trajectory versus operating cash flow, Reality Labs loss path, and any use of the new share class for balance-sheet funding as four separate ROI inputs.
Rates, semiconductors, and the discount rate on AI payback
A Fed hold is context, not absolution
The October 27–28 FOMC decision held the federal funds target at 3.75%–4.00% in a 10–2 vote, with two members preferring a 25-basis-point increase. That pause reduced near-term binary policy risk for equity markets and briefly supported AI and semiconductor names in the session around the announcement. It did not change the multi-year cash mathematics of hundreds of billions of dollars of annual CapEx. Higher-for-longer policy still matters through the equity discount rate applied to cash flows that arrive after years of heavy infrastructure spend. If markets continue to price a meaningful chance of further tightening later in the year, long-duration AI stories need either faster monetization evidence or more patient holders. "Fed pause" and "AI CapEx peak" are not synonyms.
NVDA and the supply chain as a derived ROI check
NVIDIA and peers are not hyperscalers, but they are a derived check on CapEx ROI. Hyperscaler commentary that demand exceeds supply, that short-lived GPU and CPU spend is rising as a share of CapEx, and that memory costs are lifting cash CapEx all feed semiconductor revenue visibility. The falsifier is hyperscaler CapEx guides that roll over while cloud growth decelerates—an outcome that would hit supply-chain multiples before many investors finish debating Microsoft's next Azure tenth of a point. Keep a second watchlist for semiconductors and infrastructure ETFs so you do not confuse vendor demand with corporate free-cash-flow quality at the buyer.
For investors who automate any part of post-earnings reactions, hard budget caps on Alphio Autonomous Trading and recurring review jobs on Alphio Scheduled Task keep the ROI scorecard from becoming a one-night impulse.
Open Alphio Autonomous Trading
A practical CapEx-versus-FCF reading order
Before the release
List the company's CapEx definition, last CapEx guide, last free-cash-flow print, cloud growth and margin, and any backlog or RPO figure. For Microsoft, put Azure growth versus company guide and the FCF bridge at the top. For Alphabet, put Cloud growth, Cloud profitability, Search growth, and FCF versus the $195–$205 billion band at the top. For Amazon, put AWS growth, AWS operating income, retail ballast, and the $220 billion CapEx plan at the top. For Meta, put ad impressions and price, CapEx versus operating cash flow, and Reality Labs losses at the top. Then write bull, base, and bear ROI sentences in advance so the after-hours tape cannot invent your thesis for you.
After the release, before you resize
Read CapEx and free cash flow before you celebrate or mourn headline EPS. Check whether non-operating items—legal charges at Meta, equity-security marks at Alphabet, investment accounting at Microsoft—distorted the earnings base. Only then listen to the call for capacity constraints, 2027 CapEx language, margin bridges, and financing tone. Resize only against your pre-written scenarios. If you mirror liquid strategies around mega-cap catalysts, evaluate leads first on Alphio Copy Trade and bind any follow-through to explicit allocation and stop rules rather than social momentum.

Conclusion
Evaluating AI CapEx ROI after the late-October 2026 wobble means treating free cash flow as the judge and cloud growth as necessary—but not sufficient—evidence. Meta's negative FCF and Class C financing flexibility, Alphabet's Cloud surge paired with roughly $9.1 billion of cash burn and a 2027 CapEx cliff, Microsoft's still-positive FCF beside Azure at roughly 48%, and Amazon's $220 billion CapEx plan are four versions of the same exam. The Fed's hold at 3.75%–4.00% changes the rates backdrop; it does not grade the cash bridge for you.
Stay definition-disciplined, scenario your CapEx-versus-FCF outcomes before the print, and keep semiconductor exposure as a derived check rather than a substitute for hyperscaler cash analysis. When you are ready to operationalize that framework, draft explicit rules in Alphio Conversational Trading, schedule recurring post-earnings reviews with Alphio Scheduled Task, bind automated reactions to hard limits on Alphio Autonomous Trading, and evaluate any discretionary mirroring on Alphio Copy Trade before size goes live.

FAQs
What is AI CapEx ROI and why did it matter in late October 2026?
AI CapEx ROI is the investor question of whether hyperscaler capital spending on AI infrastructure is translating into durable cash returns, not just cloud growth headlines. After Meta posted about $2.12 billion of negative free cash flow and Alphabet later printed roughly $9.07 billion of negative FCF despite strong Cloud growth, markets began grading cash conversion as heavily as revenue acceleration.
How did Microsoft, Alphabet, and Meta differ on free cash flow?
Microsoft remained free-cash-flow positive at about $18.6 billion in fiscal Q1 2027 even after $45.2 billion of CapEx including finance leases. Meta reported roughly $2.12 billion of negative FCF in Q3 2026, and Alphabet reported about $9.07 billion of negative FCF the same week Microsoft reported. The contrast helps explain why Microsoft shares rose in extended trading while Alphabet sank roughly 10%.
What CapEx guides are investors watching for 2026?
On company-stated measures, Microsoft has pointed to roughly $170–$175 billion of calendar CapEx depending on capacity timing and lease definitions; Alphabet held a $195–$205 billion 2026 range while signaling a significant 2027 increase; Amazon has discussed about $220 billion of 2026 cash CapEx; and Meta narrowed 2026 CapEx to $135–$145 billion. Always compare definitions before summing industry totals.
Did the Federal Reserve’s October 2026 decision change the AI CapEx debate?
The FOMC held the federal funds target at 3.75%–4.00% in a 10–2 vote, reducing near-term policy headline risk. That pause is rates context for discounting long-duration AI cash flows; it does not automatically validate or invalidate multi-hundred-billion-dollar CapEx programs if free cash flow remains weak.
How can Alphio help investors apply an AI CapEx ROI checklist?
Alphio Conversational Trading, Scheduled Task, Autonomous Trading, and Copy Trade features can help turn pre-commit CapEx-versus-FCF rules, recurring post-earnings reviews, hard budget caps, and lead evaluation into an explicit workflow so reactions stay sized and process-driven.
Related articles
- Stock Market Surges After 2026 Midterms: What the Democratic Sweep Means for Your PortfolioThe stock market rallied after Democrats won the 2026 midterms. Discover what the election means for investors, tech stocks, and the S&P 500 outlook.
- Stock Market Surges After 2026 Midterms: What the Democratic Sweep Means for Your PortfolioThe stock market rallied after Democrats won the 2026 midterms. Discover what the election means for investors, tech stocks, and the S&P 500 outlook.
- Oil Prices Surge Above $105 Amid US-Iran Conflict: Energy Investment Opportunities in November 2026Oil prices climb past $105 as US strikes Iran's Qeshm Island. Discover energy investment opportunities, top oil stocks, and market outlook for November 2026.
- Netflix Q3 2026 Deep Dive: Beat the Quarter, Lose the Narrative — Ads Cut to ~$2.7BNarrative sell-side deep dive into Netflix Q3 2026: EPS beat, ad guide cut to ~$2.7B, margin path, India engagement, buybacks, Needham downgrade, and falsifiable 2027 watchpoints.
- AI Tech Stocks Selloff October 2026: Inside the $2 Trillion Market RoutThe AI tech selloff wiped out $2 trillion in October 2026. Discover what's driving the crash, which stocks are most affected, and how investors should respond.
- AI Spending Fears Rattle Wall Street: Inside the Tech Selloff of October 2026Wall Street is shaken as AI spending concerns trigger a massive tech selloff. Learn how Meta, Nvidia, and Microsoft capex is reshaping markets and what investors should watch.