

Netflix Q3 2026 Deep Dive: Beat the Quarter, Lose the Narrative — Ads Cut to ~$2.7B
Narrative sell-side deep dive into Netflix Q3 2026: EPS beat, ad guide cut to ~$2.7B, margin path, India engagement, buybacks, Needham downgrade, and falsifiable 2027 watchpoints.

Netflix Q3 2026 Deep Dive: Beat the Quarter, Lose the Narrative — Ads Cut to ~$2.7B, Stock Slides Into a Multi-Year Low
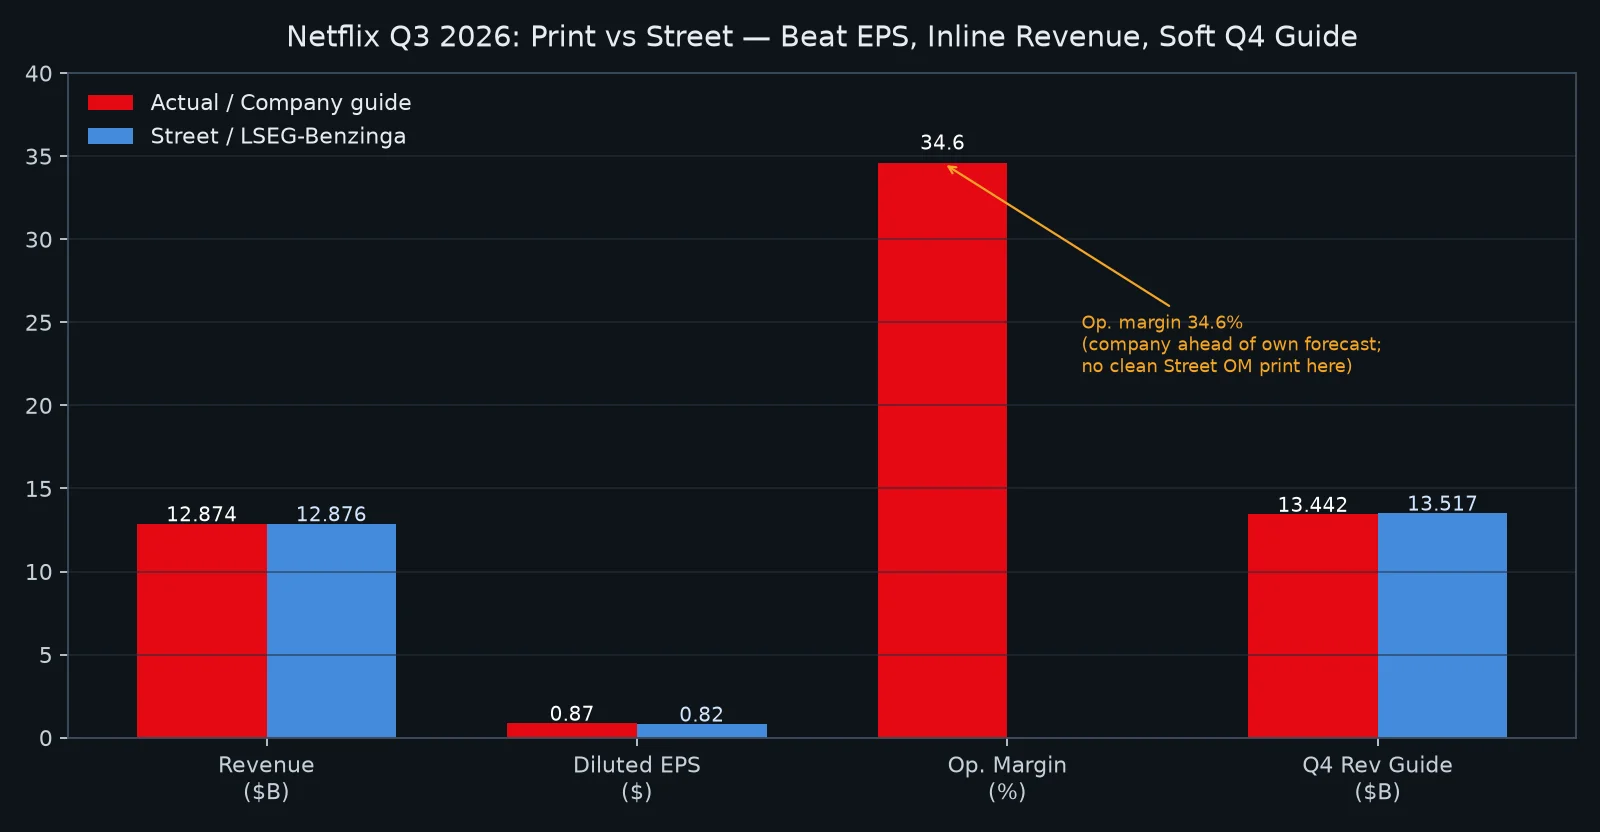
Netflix handed Wall Street a print that looked clean on paper — diluted EPS $0.87 vs roughly $0.82 expected, revenue $12.874B essentially inline with its own forecast and with Street numbers near $12.87B, operating margin a company-best-in-years 34.6% — and then watched the stock get sold anyway. Regular-session shares closed October 20 around $68.66 (−1.7%); after-hours they punched down toward $64.62 (about −6% from the close). The next full session, October 21, finished at $65.04, down 5.3%, on volume roughly 2.7× the three-month average. The tape’s message was blunt: the quarter was not the problem. The story around the next chapters was.
This is the same emotional pattern Meta just lived through a day later — “numbers clear the bar, valuation clears its throat” — but Netflix’s fear is different. Meta’s scare was CapEx infinity. Netflix’s scare is quieter and, in some ways, harder: growth slope, engagement quantity, and whether the ads second engine can carry the multiple investors already prepaid.
1. What the market is actually afraid of
Strip away the headline beat and three anxieties show up in almost every note and every after-hours chat:
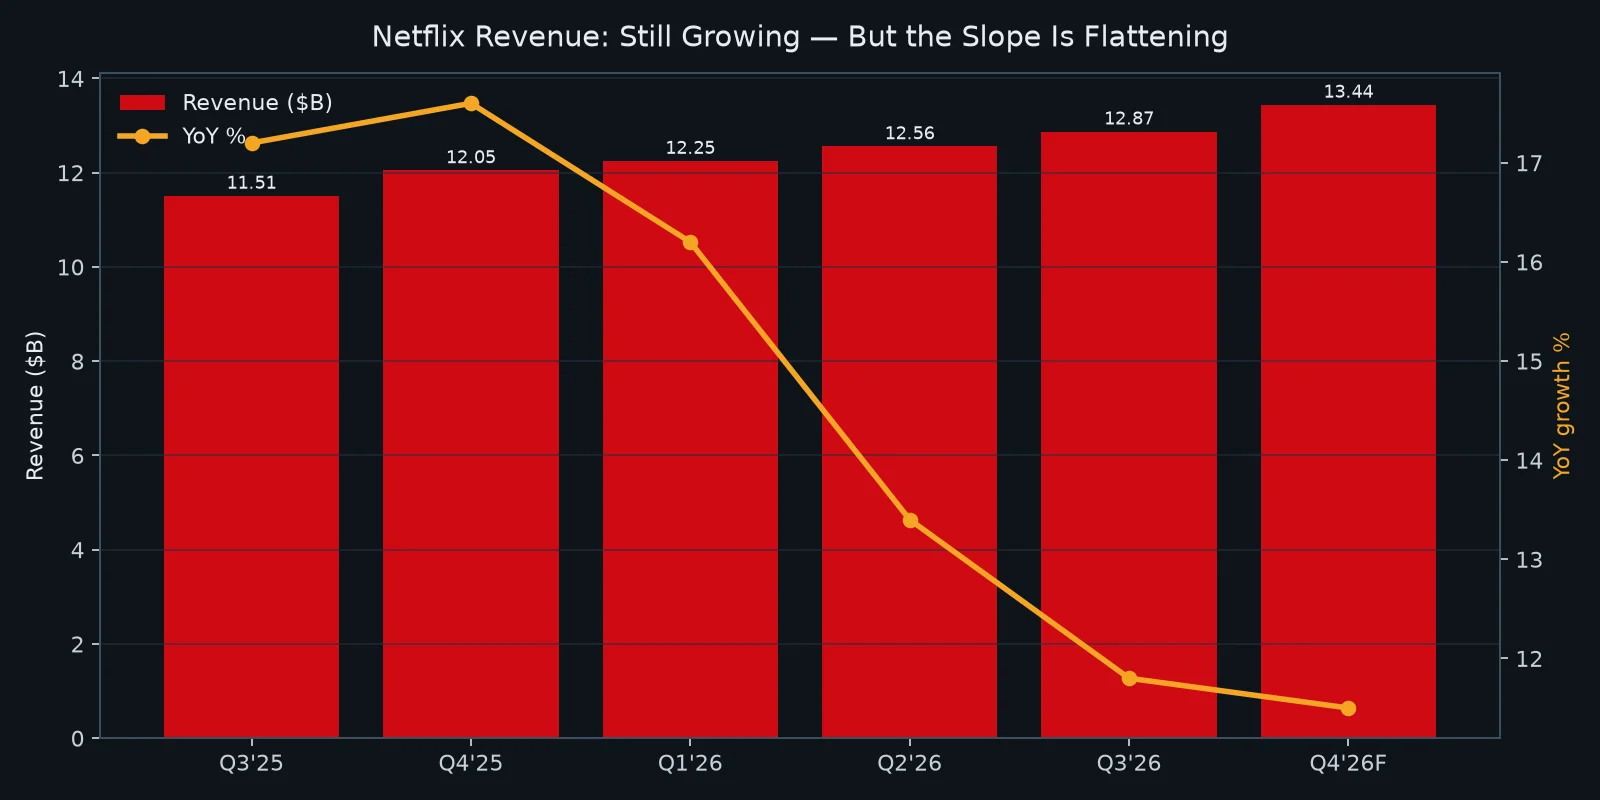
- The growth rate is decelerating in public. Reported revenue growth stepped from 17.2% in Q3’25 → 17.6% → 16.2% → 13.4% → 11.8% in Q3’26, with Q4 guided at 11.5%. That is still double-digit — and still rare at Netflix’s scale — but it is no longer the “compelling growth stock” slope that once justified a scarcity premium.
- Advertising, the narrative accelerant, just missed its own target. Full-year 2026 ad revenue is now expected at about $2.7B, versus approximately $3B previously. Ads are still growing more than 80% this year on management’s framing — but management had trained the Street to watch ads as the upside lever, then slipped the lever.
- Engagement quantity is the open wound. The shareholder letter itself says: “We know there’s some investor concern about our view hours growth.” Motley Fool’s post-print note put a sharper number in the air — view hours said to have grown only about 2% in the first half of 2026 — and Needham’s Laura Martin went further, downgrading Buy → Hold and arguing the content problem “seems clear,” with a multi-year fix.
The bull case still exists. It just has to fight through those three sentences every quarter.
2. The print: hard numbers, soft traps
Primary source for what follows is Netflix’s October 20, 2026 shareholder letter (Exhibit 99.1) and the Form 10-Q for the quarter ended September 30, 2026 — not secondary summaries.
| Metric | Q3’26 | Q3’25 | YoY / read-through |
|---|---|---|---|
| Revenue | $12.874B | $11.510B | +12% (+11% F/X-neutral) — inline with company forecast |
| Operating income | $4.459B | $3.248B | +37% |
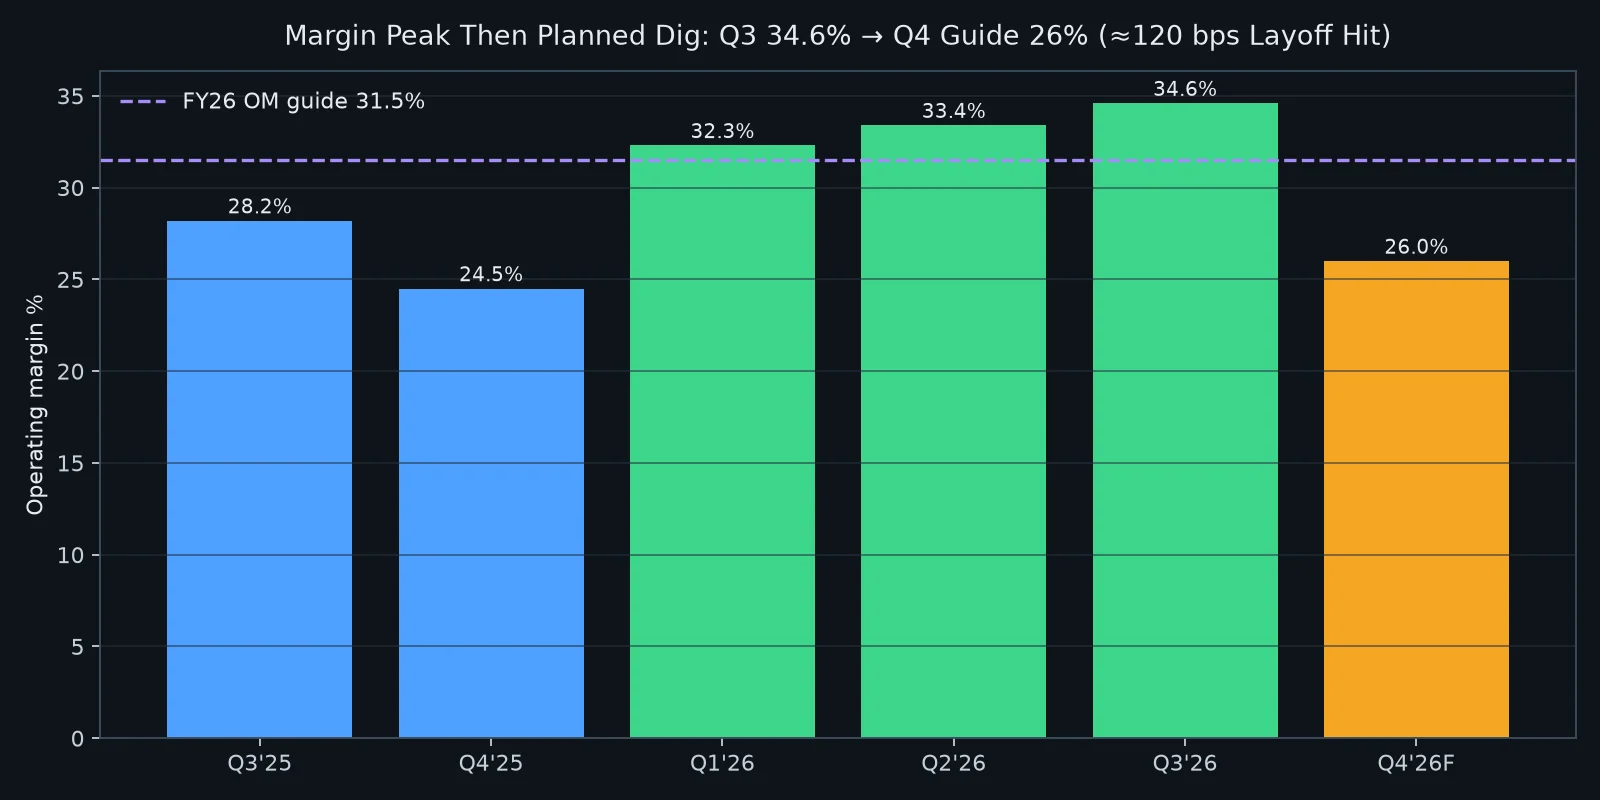
| Operating margin | 34.6% | 28.2% | +640 bps; ahead of company forecast (expense timing) |
| Net income | $3.664B | $2.547B | +44% |
| Diluted EPS | $0.87 | $0.59 | +49%; Street ~$0.82 (CNBC/LSEG) |
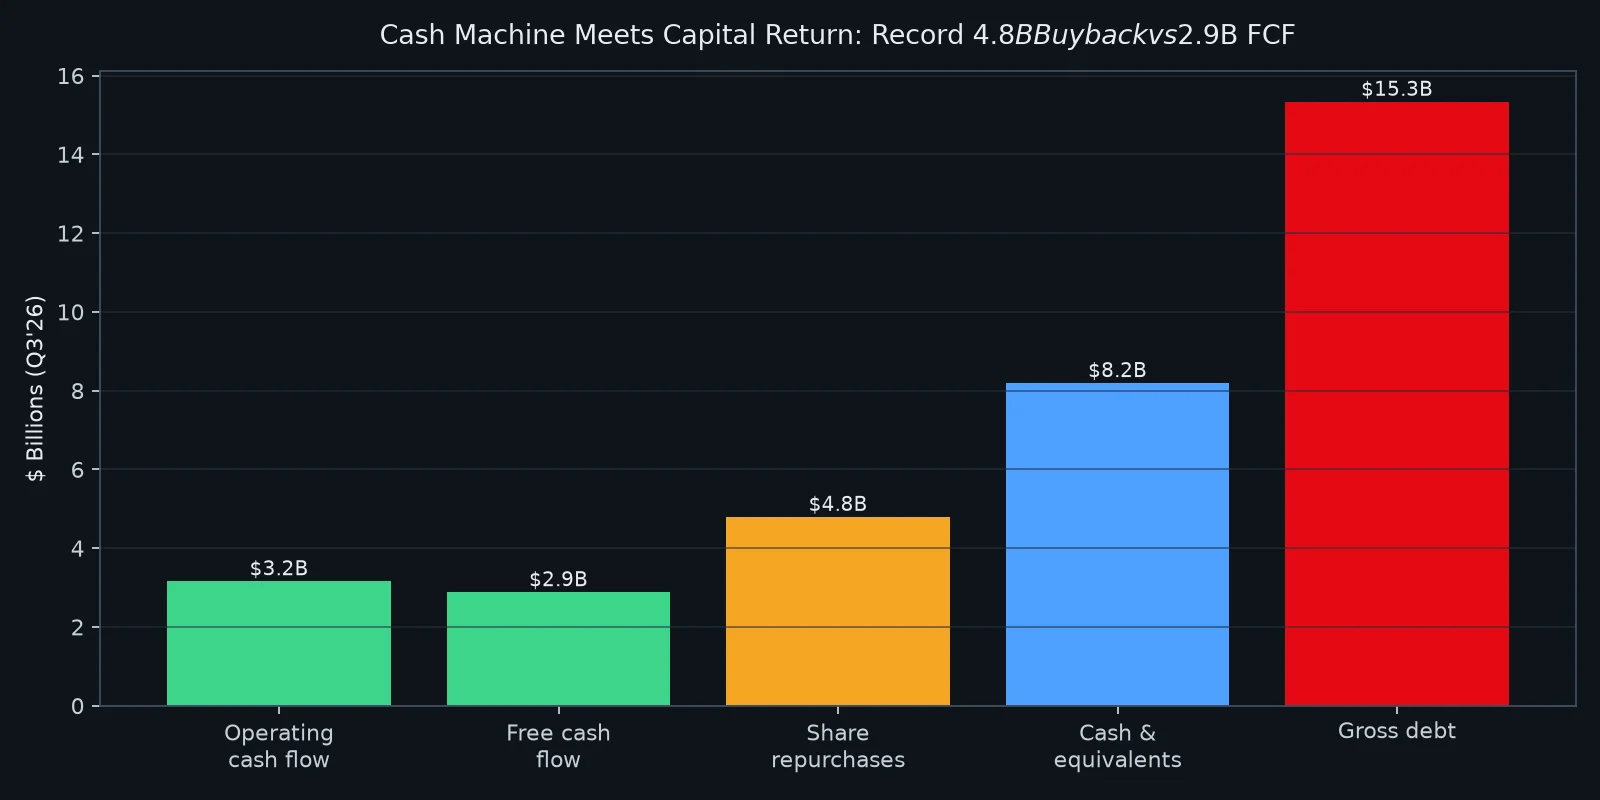
| Operating cash flow | $3.162B | $2.825B | +12% |
| Free cash flow | $2.884B | $2.660B | +8% |
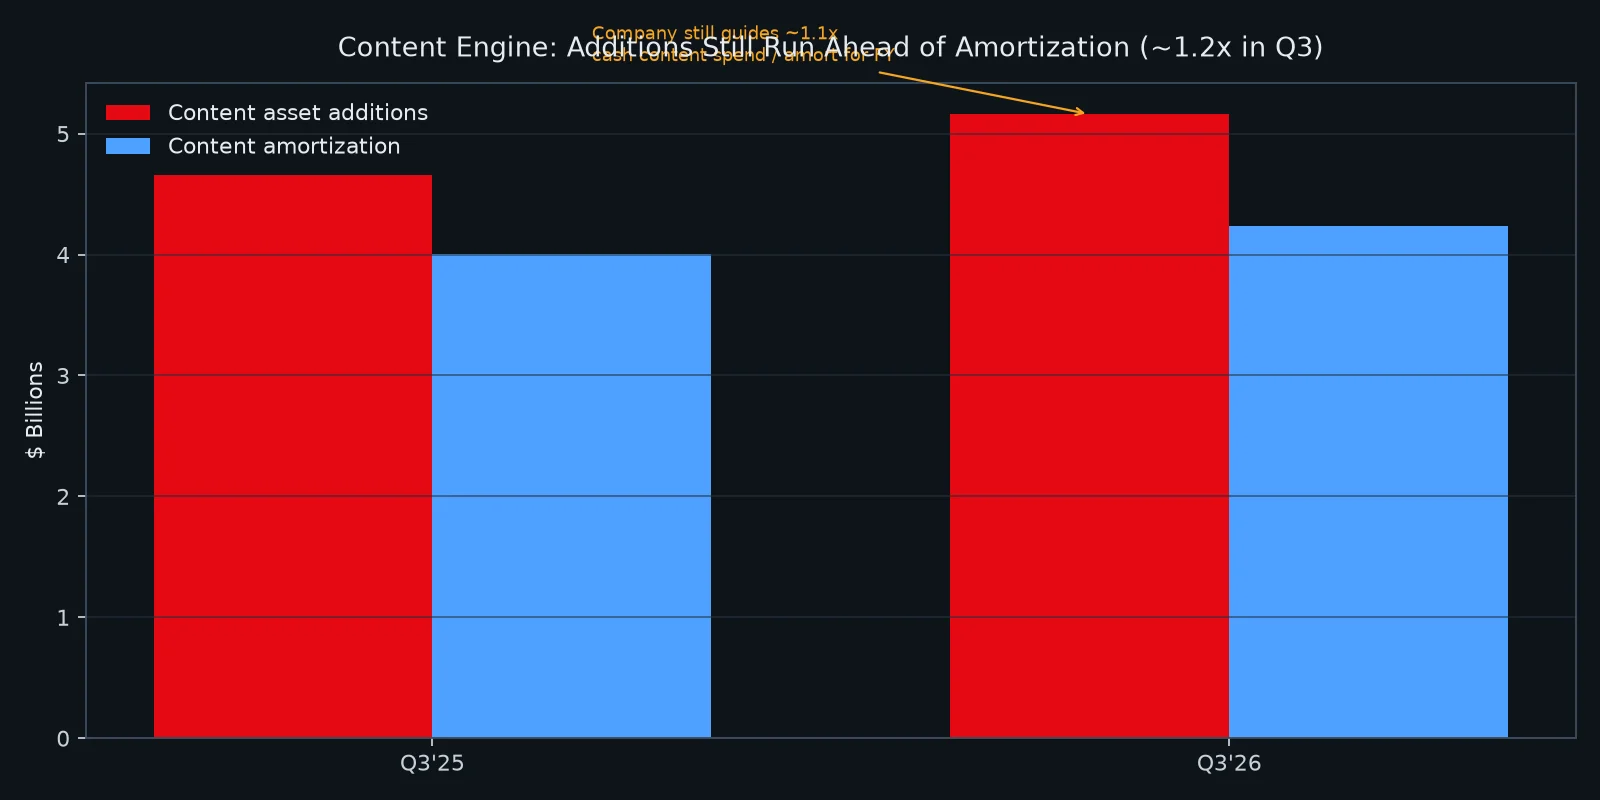
| Content amortization | $4.235B | $4.003B | +6% |
| Content asset additions | $5.160B | $4.654B | +11% |
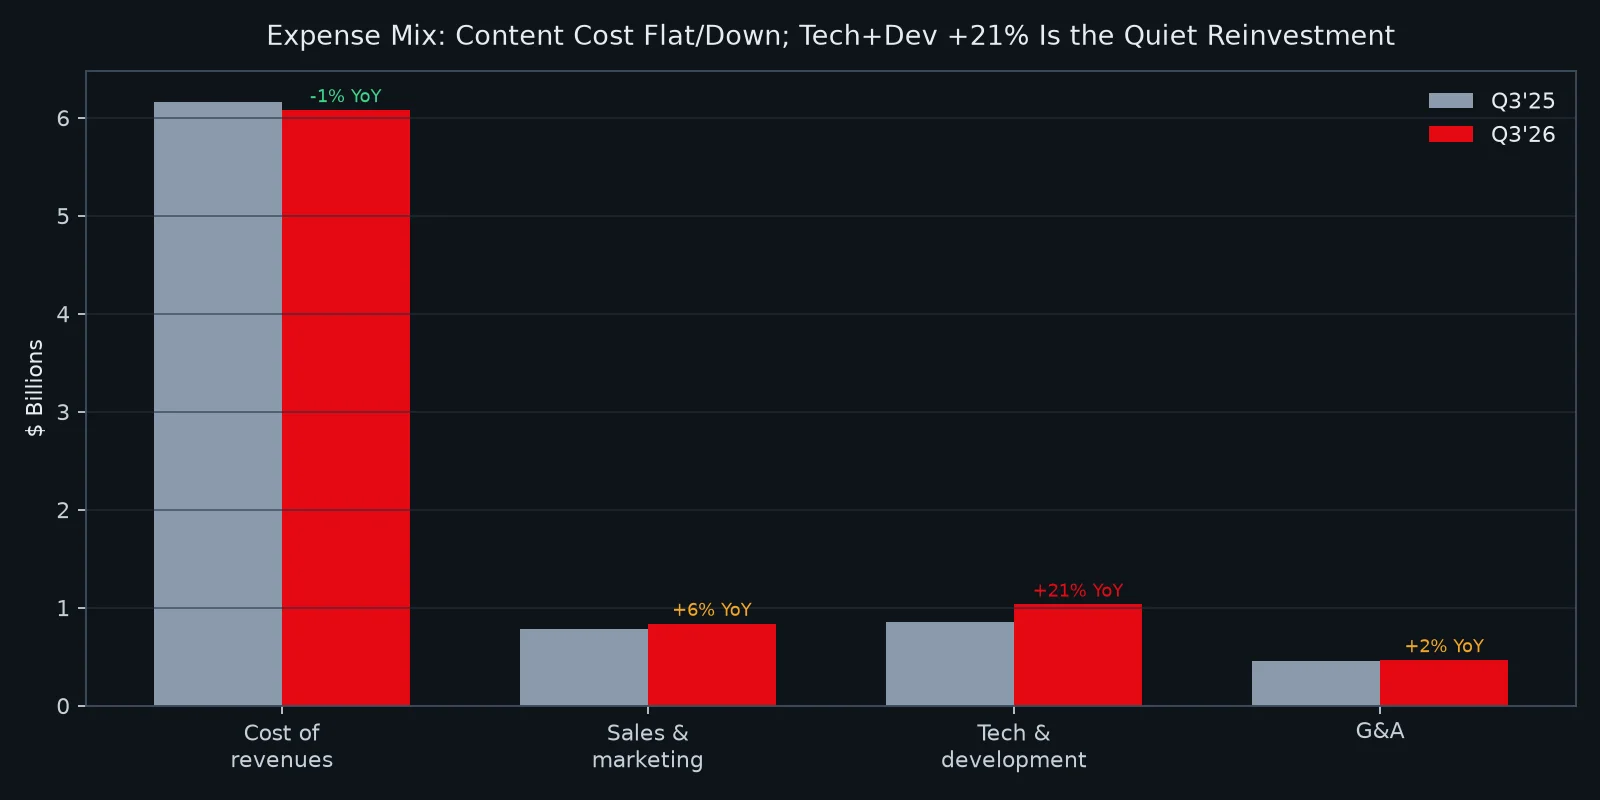
| Tech & development | $1.033B | $0.854B | +21% |
| Share repurchases | $4.797B | $1.857B | Record quarterly buyback |
| Cash & equivalents | $8.194B | — | vs YE’25 $9.034B |
| Gross debt (par context) | ~$15.3B | — | +~$1B QoQ on new bond for Q4 maturity |
| Net debt (company non-GAAP) | $7.114B | — | Still a cash-generative levered model |
| Streaming content obligations | $25.223B | $24.039B (YE’25) | On + off balance sheet |
Two traps in the scorecard:
Trap one — EPS looks better than the growth story. A 49% EPS jump is real, but a chunk of the operating-margin leap vs last year is base-effect and timing (last year’s Brazil non-income tax hit in cost of revenues; this quarter’s expense timing favorability). Management said margin beat their own forecast “primarily due to the timing of expenses.” That is honesty — and also a warning not to annualize 34.6%.
Trap two — Q4 is designed to look ugly on margin. Guide: revenue $13.442B (+11.5% YoY), operating income $3.500B, operating margin 26.0%, diluted EPS $0.67. Inside that 26% sits roughly 120 basis points of headcount-reduction cost — the largest cut since 2022. Street had been closer to $13.52B revenue and $0.73 EPS for Q4 (Benzinga/Longbridge compilations). The “miss” investors punished was mostly forward, not trailing.
3. How the engine actually made money this quarter
MD&A in the 10-Q is unusually clear on the revenue bridge. Of the $1.364B YoY revenue increase:
- Subscription revenue +$1.057B — memberships and pricing.
- Advertising revenue +$256M.
- Foreign exchange, net of hedging, a favorable $101M.
So yes, ads contributed. No, ads were not the main character of the quarter — subscriptions and price still are. That matters for how you read the ad-guidance cut: the core flywheel did the heavy lifting; the second engine sputtered on the roadmap, not on demand (more on that from the call below).
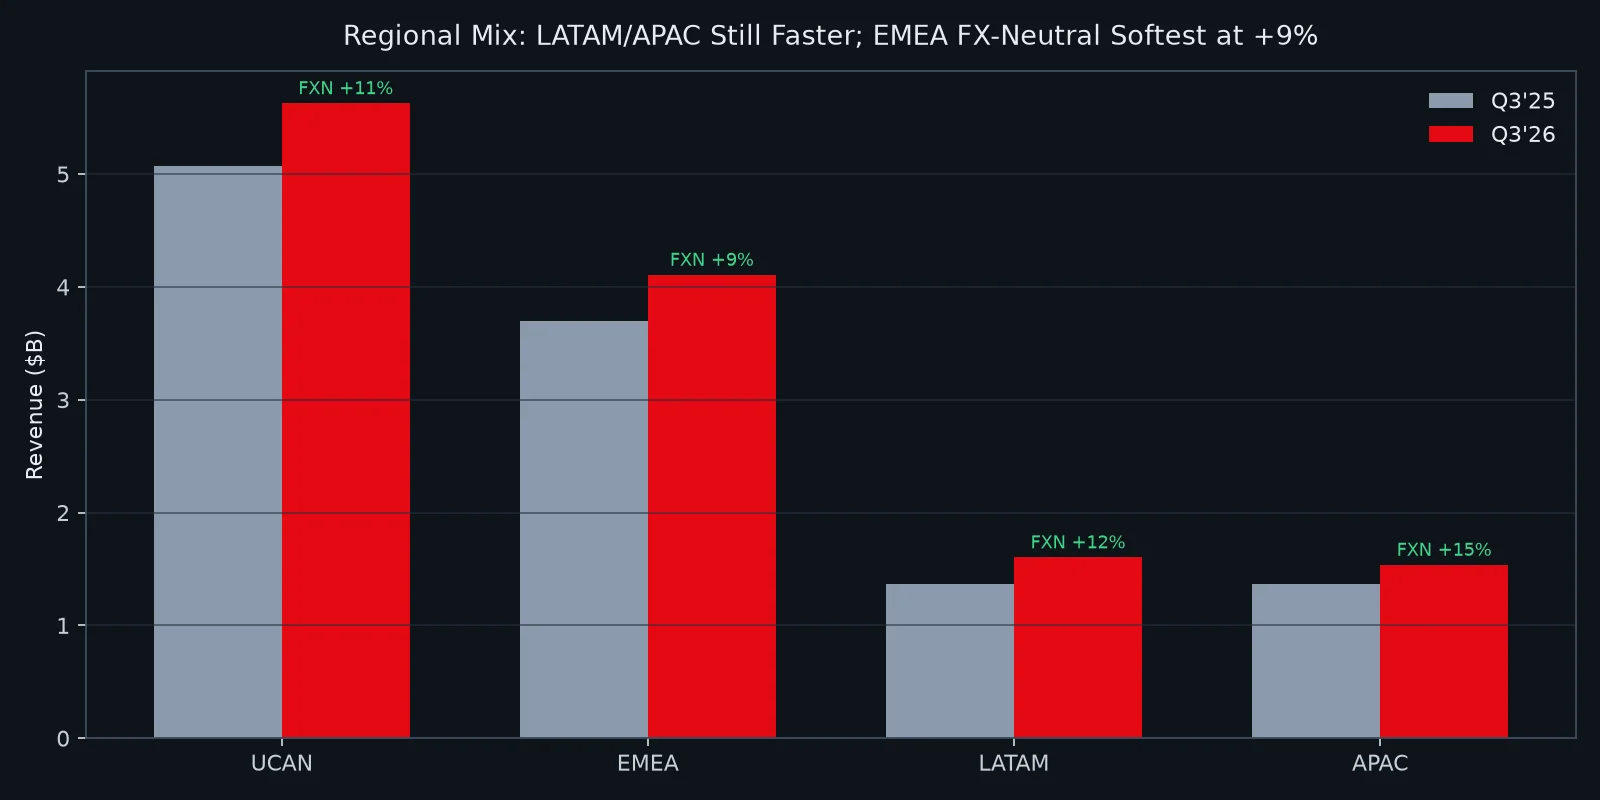
Regionally, the growth map still looks like a global company, not a U.S. nostalgia stock:
| Region | Q3’26 revenue | YoY reported | YoY F/X-neutral |
|---|---|---|---|
| UCAN | $5.628B | +11% | +11% |
| EMEA | $4.107B | +11% | +9% |
| LATAM | $1.603B | +17% | +12% |
| APAC | $1.537B | +12% | +15% |
EMEA’s F/X-neutral +9% is the softest major region. APAC’s +15% F/X-neutral is the strongest — and management’s India vignette is the proof-of-concept the bulls want copied elsewhere.
India as mechanism story. Shareholder letter: Lock Upp (first daily reality series) drove the most viewing of any title ever on Netflix India; combined with scripted hits and a Flipkart loyalty bundle, India delivered its largest quarter ever of paid net additions, view hours +24% YoY, revenue roughly +18% F/X-neutral. Co-CEO Greg Peters on the earnings interview: “That is a great example of how the core model works. We deliver on member value, and we get the business outcomes that we are looking for.”
The bull translation: when the slate hits, engagement and memberships and revenue still move together. The bear translation: if that coupling only shows up in selected emerging markets, the U.S. multiple should not pretend India is the base case.
4. Management’s voice: strategy unchanged, U.S. content “could do better”
Netflix does not run a classic prepared-remarks-then-Q&A call the way Meta does; it runs a live analyst-question interview with co-CEOs Ted Sarandos and Greg Peters, CFO Spence Neumann, and IR’s Spencer Wang. The useful quotes cluster into three themes.
4.1 The strategy sentence (Sarandos)
“Our strategy is unchanged and it has always been and it continues to be, to combine best-in-class entertainment with industry-leading discovery, global distribution, and the best possible monetization.”
He added the product hierarchy investors keep forgetting: originals are the anchor; live events (NFL, boxing) are breakout fuel for membership and ads; third-party licensing and experiments like TF1 in France expand the offering; but “roughly 95% of our spend and nearly all of our revenue is focused on that core.” Short-form and other side quests stay “early-stage” and tightly funded.
4.2 Engagement defense (Peters)
“The best evidence that we have that we are delivering that value is churn. We have healthy retention in every region. Q3 churn, both globally and in the United States, improved year-on-year. It is better than forecast.”
Price increases in 2026, he said, tracked prior cycles and expectations. On a per-hour basis, he claimed U.S. members still pay less than on competing SVODs — sometimes less than half. That is the quality-of-engagement defense: even if hours are soft, value-per-hour and retention are not.
Then the concession: U.S. engagement is “solid” and “will allow us to continue to grow,” but “we know that we can do better, and that better is our upside.”
4.3 Ads honesty (Peters)
Ads are still growing over 80% this year. Demand is strong; advertiser breadth is expanding. The miss vs the ~$3B target is product-roadmap and partner-integration delays, not vanishing demand:
“We strongly believe that a modest short-term hit for a better long-term strategic position is a good ultimate trade-off.”
Fifteen new ad-tier countries arrive in 2027 (first tranche March 2027: nine EMEA markets plus Colombia, Peru, New Zealand). The ARM gap between ads tier and standard-without-ads is “still” there but “narrowing” — which is another way of saying under-realized revenue is also an optionality pool.
4.4 2027 posture (Neumann)
“We expect to deliver strong revenue growth into 2027 as well with those same three levers” — members, pricing, ads. Full-year 2027 guide waits until the January call. Financial objectives unchanged: sustain double-digit revenue growth, expand margins, grow free cash flow.
That last sentence is the entire bull case in twelve words. The market sold the stock because it wants the twelve words with a view-hours receipt attached.
5. The risk ledger: ads cut, layoff cliff, content obligations, buyback intensity
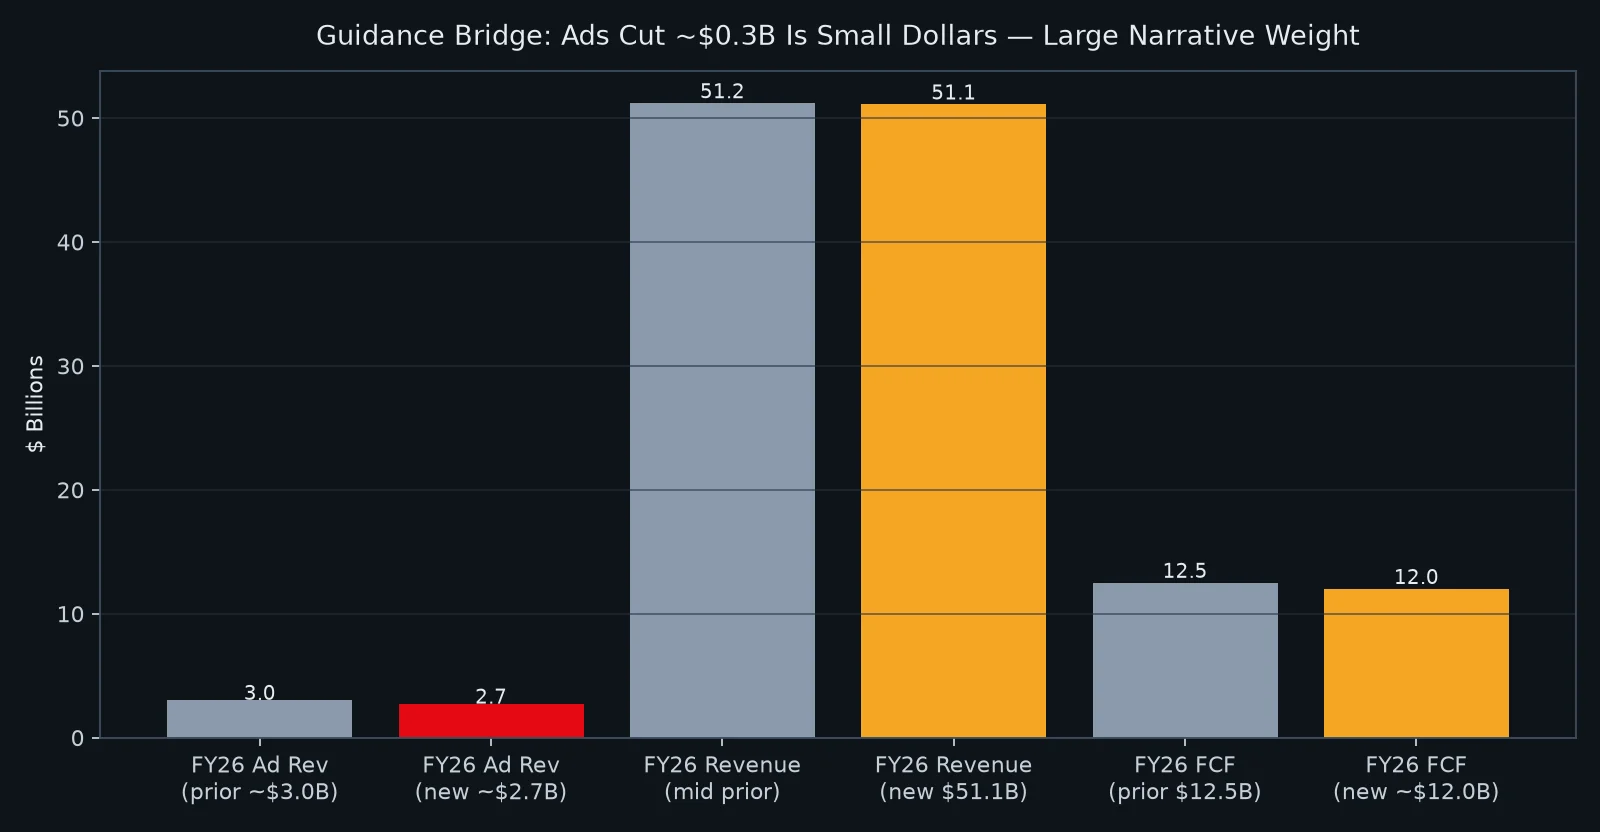
Ads: $300 million that punched above its weight. Moving FY26 ads from ~$3B to ~$2.7B is about 0.6% of guided company revenue. It is not thesis-busting math. It is narrative-busting optics — because management spent quarters telling investors to watch ads as the upside accelerant. When you miss a target you taught people to care about, the punishment is asymmetric.
Layoffs: 120 bps in Q4, philosophy in 2027. Peters framed the cuts as a “forcing function” after years of top-line growth left some teams overbuilt. Neumann refused to quantify 2027 run-rate savings, only that prioritization lets Netflix “continue to invest aggressively into the highest impact areas.” The charitable read: margin expansion toolkit. The skeptical read: growth anxiety dressed as efficiency.
Content obligations: $25.2B. Of that, $3.9B current liabilities, $1.7B non-current liabilities, and $19.6B not yet on the balance sheet. Additions still run ahead of amortization ($5.16B vs $4.24B in Q3). Company still guides cash content spend / amortization near ~1.1× for the year. This is not Meta’s $825B commitment table — but it is a multi-year creative payroll that only works if hit rates hold.
Capital return: the loudest vote management cast. Q3 buybacks $4.8B — largest quarter ever — with $22.3B authorization remaining. Gross debt rose ~$1B on a bond deal to pre-fund a Q4 maturity; cash ended at $8.2B; FCF guide for 2026 trimmed to ~$12.0B from $12.5B mainly on a real-estate closing. A company buying $4.8B of its own stock in the same quarter it cuts ad guidance is saying, with cash, that the dislocation is opportunity. Markets sometimes agree later. They rarely agree the same afternoon.
Side plot already booked: the WBD breakup fee. Q1’26 interest-and-other income includes the $2.8B termination fee Paramount Skydance paid on Warner Bros. Discovery’s exit from the Netflix merger path. That fee is why nine-month “other income” looks surreal ($2.95B). Do not let anyone annualize it into the streaming thesis.
6. Long vs short: named voices after the print
Constructive but cutting targets (the reluctant bulls):
- BofA (Jessica Reif Ehrlich): maintained Buy, cut PT $105 → $90.
- Morgan Stanley (Sean Diffley): maintained Overweight, cut PT $80 → $77.
- Rosenblatt (Barton Crockett): maintained Neutral, cut PT $75 → $71.
- Barclays: maintained Equal Weight, cut PT $70 → $65 (near the post-print tape).
The clear downgrade:
- Needham (Laura Martin): Buy → Hold. Framing in secondary coverage: slowing F/X-neutral growth, a content problem that “seems clear,” and a fix that could take on the order of two years across a ~$20B content slate. No new PT in several writeups — the downgrade was the signal.
What the two sides are really arguing:
| Bulls | Bears | |
|---|---|---|
| Growth | Double-digit revenue can persist on members + price + ads | Deceleration from 17% → 12% → guided low-11s is multiple compression |
| Ads | >80% growth; roadmap delay, not demand death; 15 countries in 2027 | Missed own $3B target after teaching Street to care; ARM gap persists |
| Engagement | Churn improved; price hikes landed; India proves the model | View-hours soft; U.S. slate “doubles and triples,” not enough home runs |
| Capital | Record buybacks = insider conviction | Buying the dip does not fix the slate |
| Leadership | Peter Rice as CCO = execution upgrade | Leadership change mid-anxiety confirms the content issue |
Sarandos’s own words feed both columns. Thanking Bela Bajaria for a decade of hits, he said of the U.S.: “We had some really solid doubles and triples this year… the other territories count on some of those titles being home runs.” And: “I know that we could do better.” Bulls hear a fixable execution gap under a proven operator (Rice’s Fox/Disney resume). Bears hear a confession.
7. Side plots that are not side plots
Content leadership change. Peter Rice in as Chief Content Officer is not gossip if you believe Needham’s two-year repair cycle. Sarandos pitched Rice as rare across TV, film, streaming, and live sports — and explicitly as someone who can improve talent relations in a market where creators choose homes. Near-term, Rice can still touch projects already in flight; the real test is the 2027–2028 U.S. home-run rate.
Platform aggregation without becoming a cable bundle. TF1 in France is the working prototype: early metrics show incremental viewing, monthly growth in TF1 viewing on Netflix, brand kept distinct inside the UI. Disney licensing (Ice Age library hitting Top 10 ahead of a 2027 theatrical) and the new Globo deal in Brazil sit in the same logic — expand the offering, keep originals as the economic core. If this works, Netflix becomes harder to cancel without becoming a dumb pipe. If it fails, spend rises without retention lift.
Live sports as membership and ads fuel. Thanksgiving Eve NFL (U2 halftime), Christmas Day doubleheader, Fury–Joshua — management treats live as breakthrough programming in an attention-overloaded world, not as a separate P&L religion. Watch whether live shows up in ads fill and gross additions next letter.
Theatrical as awareness machine. ~30 theatrical releases a year; specialty windows vs 45-day family windows (Narnia, Charlie vs Chocolate Factory); first box-office reporting for La Bola Negra at a claimed $69k+ per-screen average. Streaming-first remains the religion; theatrical is marketing with a receipt.
8. Three threads, one thesis
Thread one — the subscription printer still prints. Price landed, churn improved, regional revenue all double-digit reported, FCF ~$2.9B in the quarter, buybacks at a record. This is not a broken consumer business.
Thread two — the second engine (ads) is early, fast, and currently behind its own map. Eighty-percent growth with a $300M guide cut is the definition of a high-expectations asset. 2027 country expansion and ad-tech completeness are the falsifiers.
Thread three — the market has switched Netflix’s multiple from “scarcity growth” to “prove the engagement.” Same financial data, different lens — exactly the Meta CapEx-reframe rhyme. Hours, U.S. hit rate, and ads roadmap milestones now sit upstream of the P/E.
The single disagreement worth saying out loud: Can Netflix turn “quality/variety of viewing + better churn” back into accelerating view hours and U.S. home runs without blowing the margin algorithm? If yes, $2.7B ads becomes a footnote and the buyback looks genius. If no, double-digit revenue persists but the multiple keeps walking down the stairs — one quiet quarter at a time.
9. Four falsifiable watchpoints
- Q4 revenue vs $13.442B and margin vs 26%. Beat on revenue with layoff costs contained → narrative stabilizes. Clean miss on both → the deceleration tape hardens.
- January 2027 full-year guide. Neumann already previewed the vocabulary — double-digit revenue, expanding margin, rising FCF. The number that matters is whether 2027 revenue growth is guided at/above the high-11s / low-12s zone or allowed to sink into high-single-digits.
- Ads proof points, not promises. First 2027 country tranche in March; ARM gap commentary; any return to quantifying quarterly ads dollars. The falsifier for the bull ads story is another silent guide cut.
- U.S. slate scoreboard under Rice. Q4 names are stacked (East of Eden already in market chatter, Diplomat S4, Cliff Booth / Fincher / Tarantino / Pitt, Christmas NFL). Needham’s bear case dies if 2027 produces unmistakable U.S. traveling home runs; it lives if the “doubles and triples” pattern persists.
10. Why a sober optimism is still earnable
Not cheerleading — evidence:
First, the P&L quality underneath the scare is high. 34.6% operating margin, cost of revenues down 1% YoY, FCF positive and guided near $12B, effective tax rate 15% in the quarter. This is a cash compounder having a multiple argument, not a turnaround having an existence argument.
Second, retention is the forgotten KPI. Improved churn globally and in the U.S., price hikes absorbed on plan, industry-leading retention repeatedly claimed and not yet falsified in the letter. Hours can lag while the membership annuity holds — for a while. That “for a while” is the option value.
Third, India is not a one-off curiosity if the same playbook travels. Local hits + packaging innovation (Flipkart) + accessible price points is a template for other mid-penetration markets Peters listed (Indonesia, Colombia, Mexico, Japan, Philippines, Turkey). Revenue mix already says more than half of growth energy sits outside pure U.S. saturation math.
Fourth, management is spending its own dry powder. A $4.8B buyback in the quarter you guide ads down is either hubris or information. Combined with Rice’s hiring, TF1/Disney/Globo distribution bets, and a live slate that still can spike membership, the company is acting like the problem is execution tempo, not business model expiration.
Sarandos’s must-have line is still the right north star: first service members check, last one they cancel. The stock’s job over the next two report cards is simpler and crueler — show the hours and the U.S. home runs that make that sentence feel expensive again, or accept a lower multiple on a still-excellent annuity.
Sources: Netflix Q3 2026 Letter to Shareholders (Oct 20, 2026) and Exhibit 99.1 on EDGAR; Netflix Form 10-Q for the quarter ended September 30, 2026; Netflix Q3 2026 earnings interview transcript (company video / Investing.com transcript); CNBC, Motley Fool, Longbridge/Benzinga analyst-target roundups, and related secondary price-reaction reporting. Consensus figures are as cited by those outlets (LSEG/Benzinga) and can differ by vendor.
Disclaimer: For information and research-methodology demonstration only — not investment advice, a solicitation, or a performance guarantee. Verify all figures against primary SEC filings before making decisions.
FAQs
Did Netflix beat Q3 2026 earnings estimates?
Yes on EPS. Diluted EPS was $0.87 vs roughly $0.82 Street (CNBC/LSEG). Revenue of $12.874B was essentially in line with Netflix’s own forecast and Street near $12.87B. Operating margin was 34.6%, ahead of the company’s forecast.
Why did Netflix stock fall after the Q3 2026 beat?
Investors focused on the forward story: FY2026 ad revenue cut to about $2.7B from ~$3B, FY revenue guided to $51.1B (low end of the prior range), Q4 margin guided to 26% including ~120 bps of layoff costs, and ongoing concern about view-hours growth and U.S. content hit rate.
What are Netflix’s key Q4 and FY2026 guides?
Q4 revenue $13.442B, operating margin 26.0%, diluted EPS $0.67. Full-year 2026 revenue $51.1B (+13% YoY) and operating margin 31.5%. Free cash flow guide trimmed to about $12.0B from $12.5B, mainly on a real-estate transaction.
Related articles
- Stock Market Surges After 2026 Midterms: What the Democratic Sweep Means for Your PortfolioThe stock market rallied after Democrats won the 2026 midterms. Discover what the election means for investors, tech stocks, and the S&P 500 outlook.
- Stock Market Surges After 2026 Midterms: What the Democratic Sweep Means for Your PortfolioThe stock market rallied after Democrats won the 2026 midterms. Discover what the election means for investors, tech stocks, and the S&P 500 outlook.
- Oil Prices Surge Above $105 Amid US-Iran Conflict: Energy Investment Opportunities in November 2026Oil prices climb past $105 as US strikes Iran's Qeshm Island. Discover energy investment opportunities, top oil stocks, and market outlook for November 2026.
- Nvidia Stock August 2026: Why Analysts Predict a Major BreakoutNvidia stock could skyrocket in August 2026. Discover why analysts are bullish, with $500B in AI chip bookings and demand outpacing supply 12-to-1.
- Nuclear Energy Stocks: The Hidden Gem of Clean Energy Investment in 2026Discover why nuclear energy stocks are surging in 2026. Learn about NuScale Power (SMR), Oklo (OKLO), and emerging opportunities in the clean energy sector.
- Tesla Stock Analysis August 2026: Navigating the EV Market's Next ChapterIn-depth Tesla stock analysis for August 2026. Explore TSLA price trends, EV market growth, and investment strategies. Expert insights on Tesla's future.