

Alphabet Q3 2026 Deep Dive: Search Miss, Negative FCF, Cloud +103%
Alphabet Q3 2026 sell-side deep dive: Search ads miss vs LSEG, -$9.1B FCF after $51B CapEx, Google Cloud +103% to $30.7B, and why GOOGL fell ~10% after hours while Microsoft beat.
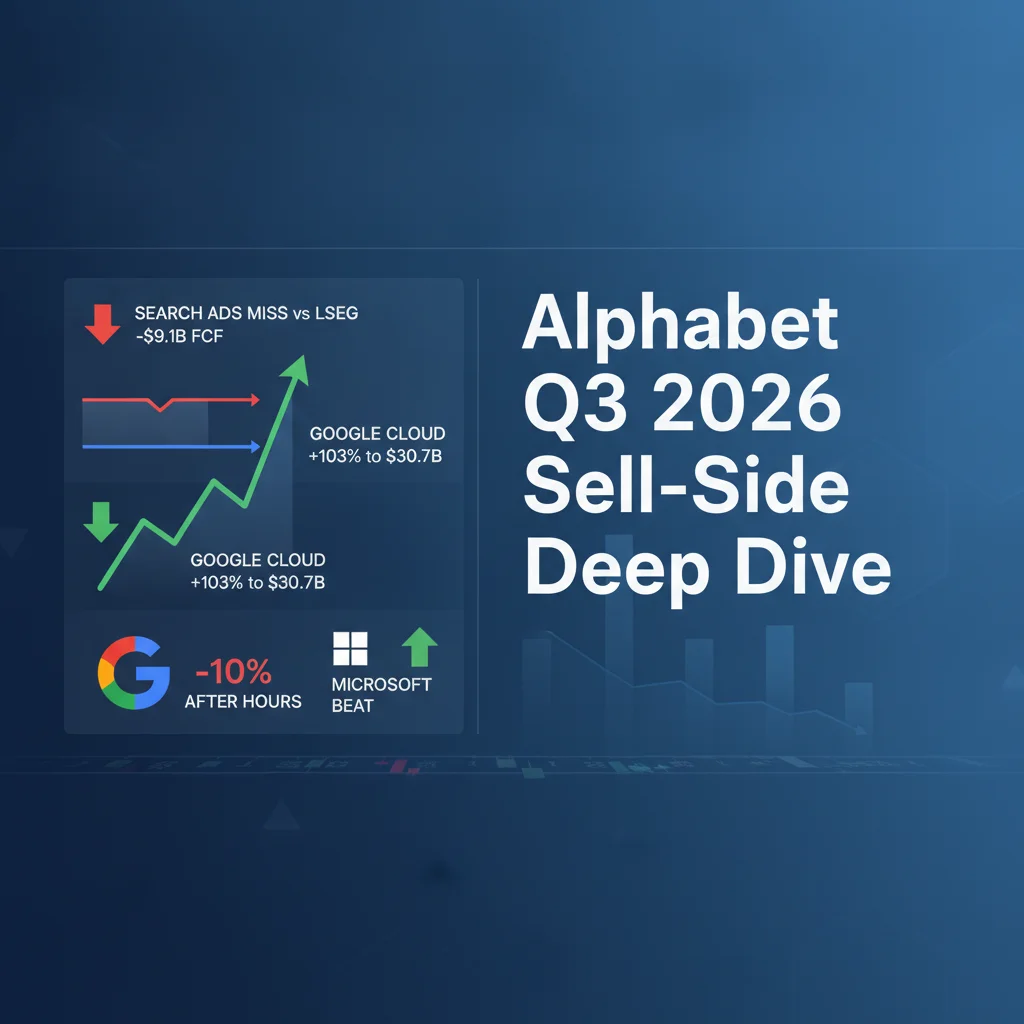
Alphabet Q3 2026 Deep Dive: Search Miss and Negative FCF Collide With a Cloud Doubling—Why the Tape Punished a 25% Grower
After the close on October 28, 2026, Alphabet (NASDAQ: GOOGL / GOOG) printed what should have looked like a victory lap on any other tape: consolidated revenue $127.577B, +25% YoY, a thirteenth straight quarter of double-digit growth, Google Cloud +103% to $30.709B, operating income +30% to $40.576B at a 31.8% margin. Instead, Class A shares slid roughly 9%–10% in after-hours (CNBC cited ~9%; Investing.com showed about -10.4% to ~$288 from a ~$322 regular-session close). The market did not argue with Cloud. It argued with the cash ledger and the Search line.
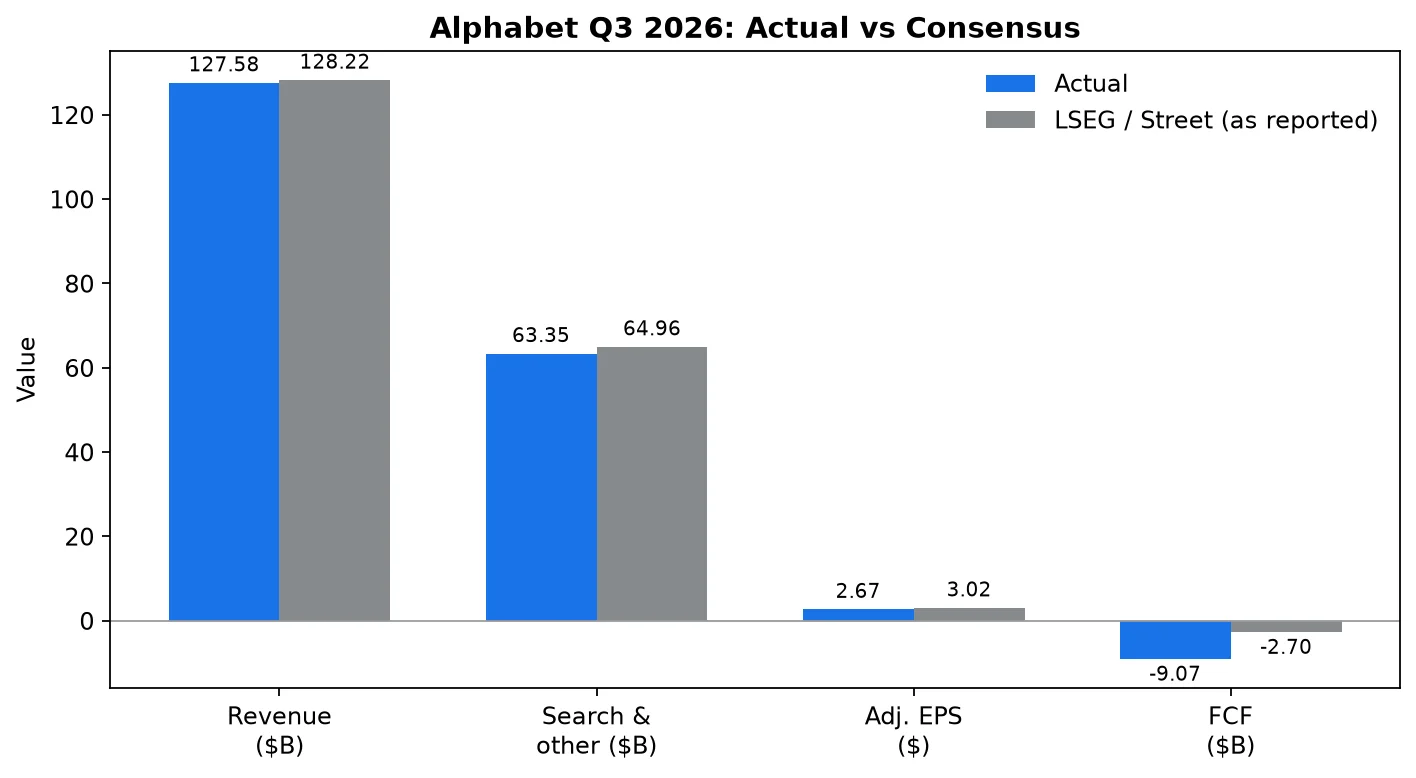
Three numbers framed the emotion. Core Google Search & other advertising came in at $63.350B, below the LSEG consensus near $64.96B. Total revenue missed LSEG's ~$128.22B. And free cash flow printed -$9.065B—far worse than the roughly -$2.70B Street sketch CNBC cited—after $51.355B of CapEx. Same night, Microsoft beat and Azure grew 48%, with MSFT up about 2% after hours. The split screen wrote itself: one hyperscaler got paid for AI spend; the other got marked for AI spend that still looks like a cash sink plus a Search soft patch.
This note reads the print the way the tape did—as a conflict story—then rebuilds the mechanism from Alphabet's Form 8-K Exhibit 99.1 and the Q3 2026 earnings call (Sundar Pichai, Philipp Schindler, Thomas Kurian, Anat Ashkenazi). Numbers below are from that primary release unless attributed to a secondary source.
1. What the Market Was Afraid Of
Heading into the print, the fear was not "does Google still grow?" It was a braid of three anxieties:
- Search monetization under AI surfaces — queries can accelerate while ad dollars lag if AI Overviews / AI Mode show fewer or lower-yielding ads.
- CapEx to FCF compression — FY26 CapEx guide already sat at $195B–$205B; any hint that 2027 steps up significantly without a matching FCF path invites multiple compression.
- Balance-sheet generosity — ATM equity issuance, large debt raises, and multi-hundred-billion purchase commitments make the AI build look less like optional CapEx and more like a locked-in industrial program.
Citizens' Andrew Boone had already cut his target to $450 from $515 while keeping a Buy / Market Outperform stance, flagging Search competition from AI agents and CapEx payback risk (TipRanks / MarketBeat, mid-to-late October). Deutsche Bank's framing—AI CapEx compressing FCF yield and limiting buybacks—was in the same zip code. The after-hours gap said those worries found a print to attach to.
2. Scorecard: Growth Everywhere, Misses Where It Hurt
| Metric | Q3 2026 actual | Benchmark / prior year | Read-through |
|---|---|---|---|
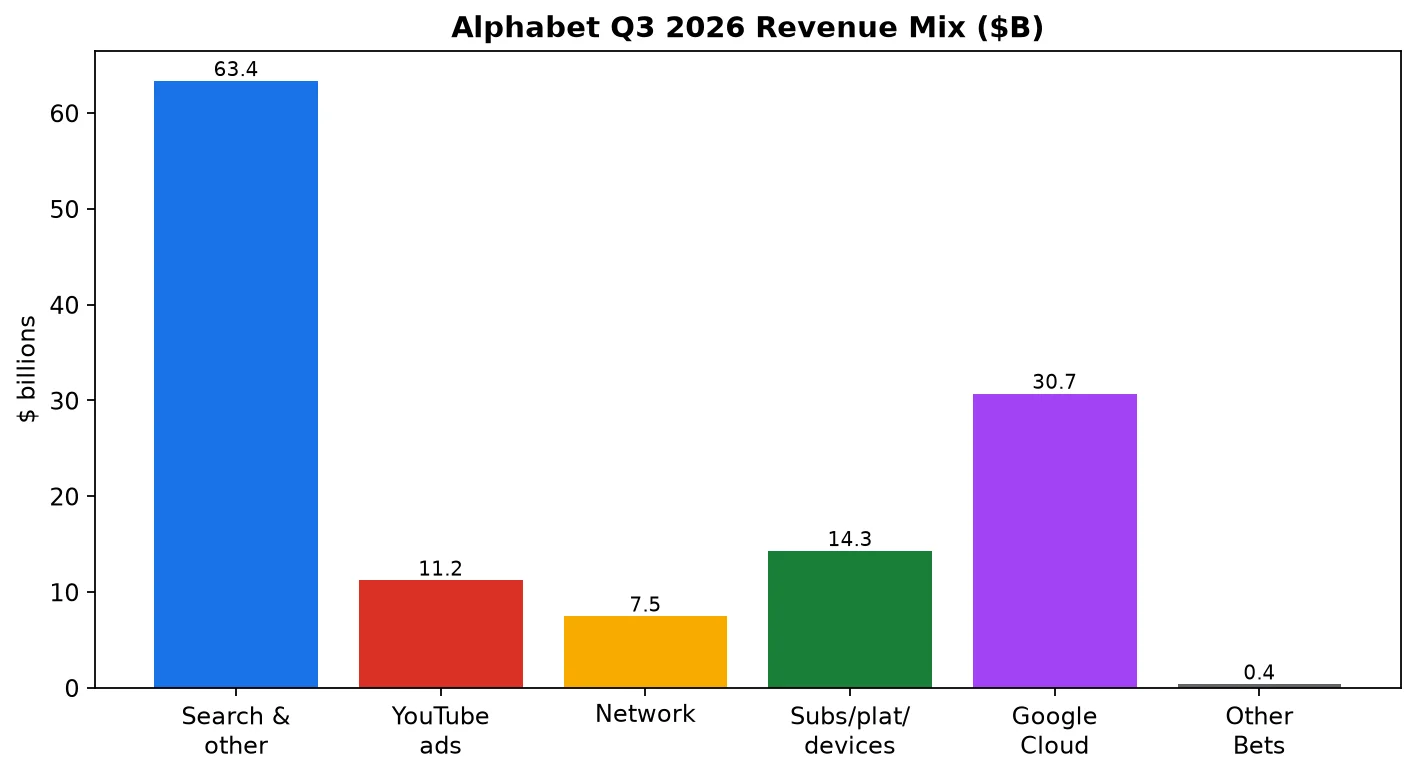
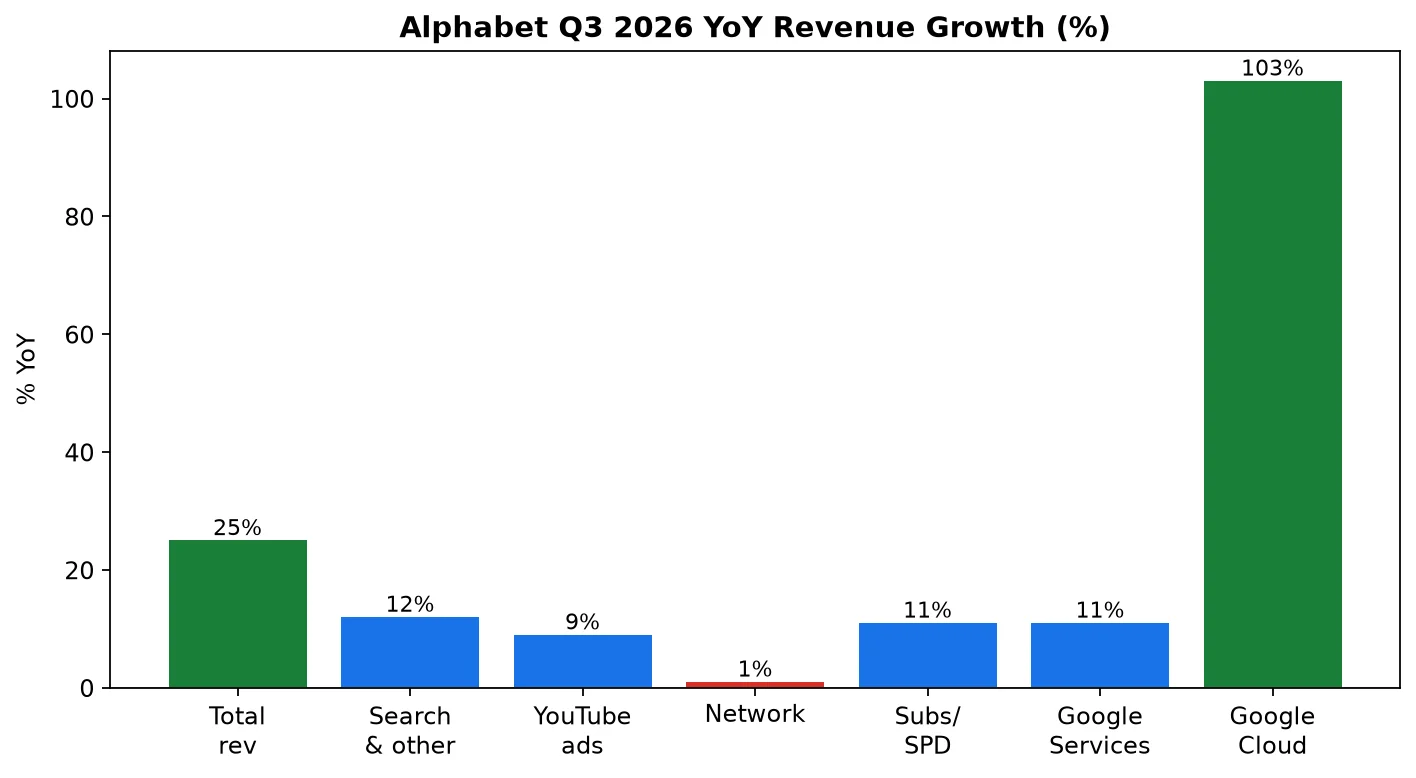
| Total revenue | $127.577B | LSEG ~$128.22B; PY $102.346B | Slight miss vs cons.; +25% YoY |
| Search & other ads | $63.350B | LSEG ~$64.96B; PY $56.567B | Miss vs Street; +12% YoY |
| YouTube ads | $11.207B | PY $10.261B | +9% YoY |
| Google Network | $7.455B | PY $7.354B | +1% YoY |
| Google advertising | $82.012B | PY $74.182B | +11% YoY |
| Subs / platforms / devices | $14.290B | PY $12.870B | +11% YoY |
| Google Services rev | $96.302B | PY $87.052B | +11% YoY |
| Google Cloud rev | $30.709B | PY $15.157B | +103% YoY |
| Other Bets rev | $0.372B | PY $0.344B | Small |
| Operating income | $40.576B | PY $31.228B | +30% YoY; margin 31.8% |
| Diluted EPS (GAAP) | $2.12 | PY $2.87 | Down on OI&E |
| Adj. EPS (CNBC / LSEG frame) | $2.67 | Cons. ~$3.02 | Miss |
| CapEx (PPE purchases) | $51.355B | Street ~$55.09B (CNBC) | Slightly under Street spend |
| Operating cash flow | $42.290B | — | Solid, inventory + EC fine drag |
| Free cash flow | -$9.065B | Street ~-$2.70B (CNBC) | The kill shot |
| TTM FCF | $19.747B | — | Still positive trailing |
| Cash + marketable securities | $265.1B | — | Includes $90.4B equity securities |
| Long-term debt | $125.1B | YE 2025 $46.5B | Leverage up with AI funding |
| Employees | 204,757 | PY 190,167 | About +8% YoY |
Trap 1: Celebrating +25% revenue without noticing Search was the miss column. Trap 2: Reading GAAP EPS $2.12 without separating the -$8.221B OI&E (primarily unrealized SpaceX mark-to-market) from operating momentum. Trap 3: Treating CapEx under Street as dovish when FCF still cratered on inventory build for TPU system sales and a $5.2B EC fine cash payment.
3. Search: Fastest Query Growth in Five Years—and a Street Miss
Management's proudest Search claim and the Street's disappointment can both be true. Pichai: year-over-year query growth is the highest in five years, including commercial queries; AI Mode queries average 3x traditional length; one in five AI Mode searches globally use voice, images, or documents; visual searches crossed 50B per month. Schindler added that AI is integrated across ads quality, advertiser tools, and AI user experiences—Gemini-generated campaign assets topped 1.5B in Q3 alone, up over 7x YoY.
Yet Search & other ads grew 12% to $63.3B, decelerating versus the prior quarter's run-rate and missing consensus. On the call, Schindler walked the sequential slowdown with unusual candor:
- FX was the single largest driver of Search deceleration vs Q2.
- Retail: some APAC advertisers felt the EU eliminating its de minimis exemption.
- Media and entertainment: spend normalized after an unseasonably strong Q2 tied to the FIFA World Cup calendar.
- AI Mode mix: strong query growth with lower near-term monetization diluted the blended Search dollar.
Ashkenazi then mapped the forward trap: Q4 faces a slightly larger FX headwind at then-current spot rates, and Alphabet is lapping the Search acceleration that began in late 2025—about 3 points of growth already lapped in Q3, with a couple more points into Q4. That is not a demand-cliff narrative; it is a compare-and-mix narrative. The bull case needs ads in AI Overviews / AI Mode to scale without wrecking UX. Schindler's answer: experiments look promising; Alphabet is expanding ads in AI Mode internationally and launching multi-turn ads in the U.S., with click-through rates on sponsored vs organic product list items in AI Mode already similar.
Mechanism: Query growth without ad-load parity is a volume story that prints as a revenue miss. The Q4/Q1 watchpoint is whether international and multi-turn ad expansion closes that gap faster than lapping and FX open it.
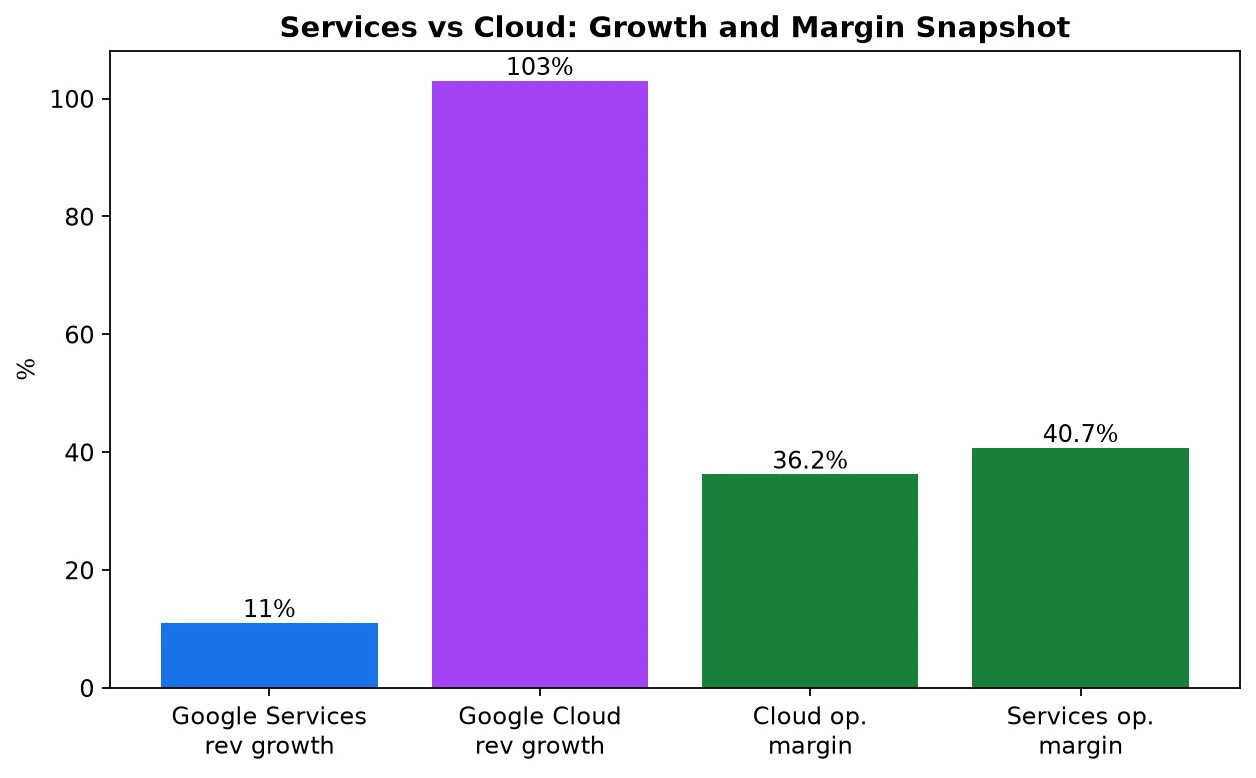
YouTube ads +9% to $11.2B—living room over one-third of YouTube ads revenue—kept brand alive while subscriptions (YouTube Music and Premium above 150M including trials) outgrew ads. Network ads were essentially flat (+1%). Services operating income still rose 17% to $39.2B at a 40.7% margin—the cash cow is not broken; its growth rate is being debated.
4. Cloud: +103%, $11.1B of Operating Income, and a TPU Systems Sidecar
Cloud is the other pole of the story. Revenue $30.709B (+103%); operating income $11.121B (more than 3x YoY); margin 36.2% vs 23.7% a year ago. Kurian: 18 Cloud product lines above $1B annual revenue; GCP the vast majority of Q3 Cloud; AI infrastructure, AI solutions, and core GCP all strong; TPU system sales a meaningful contributor. Backlog $561B, with just over 55% expected as revenue over the next 24 months.
Token and seat metrics support the claim that AI is real revenue: first-party model APIs at nearly 32B tokens per minute (+40% QoQ, more than 4x YoY); Gemini Enterprise used by nearly 90% of the Fortune 100; customers who used it in Q3 2025 more than quadrupled spend YoY; more than 100M knowledge-work seats sold across AI services; more than 2,600 customers past 100B tokens in twelve months.
The financial complexity is the TPU systems business. Ashkenazi: when Alphabet signs a systems sale, backlog rises first; then inventory builds (cash out) before revenue and cash in. That inventory build, plus the EC fine, hit Q3 operating cash flow and free cash flow even as Cloud margins looked excellent—third-party bridging capacity only arrived at the very end of Q3 and had limited margin damage this quarter, but management warned Q4 margin headwinds as that capacity ramps.
Bull read: Cloud is compounding, margins expanded, backlog is enormous, TPU distribution is widening (Oracle, Crux AI / Blackstone, customer data centers, TorchTPU with Meta). Bear read: reported Cloud growth includes a hardware-systems mix that is not classic consumption software; CapEx and inventory for that mix punish free cash flow before the P&L celebrates.
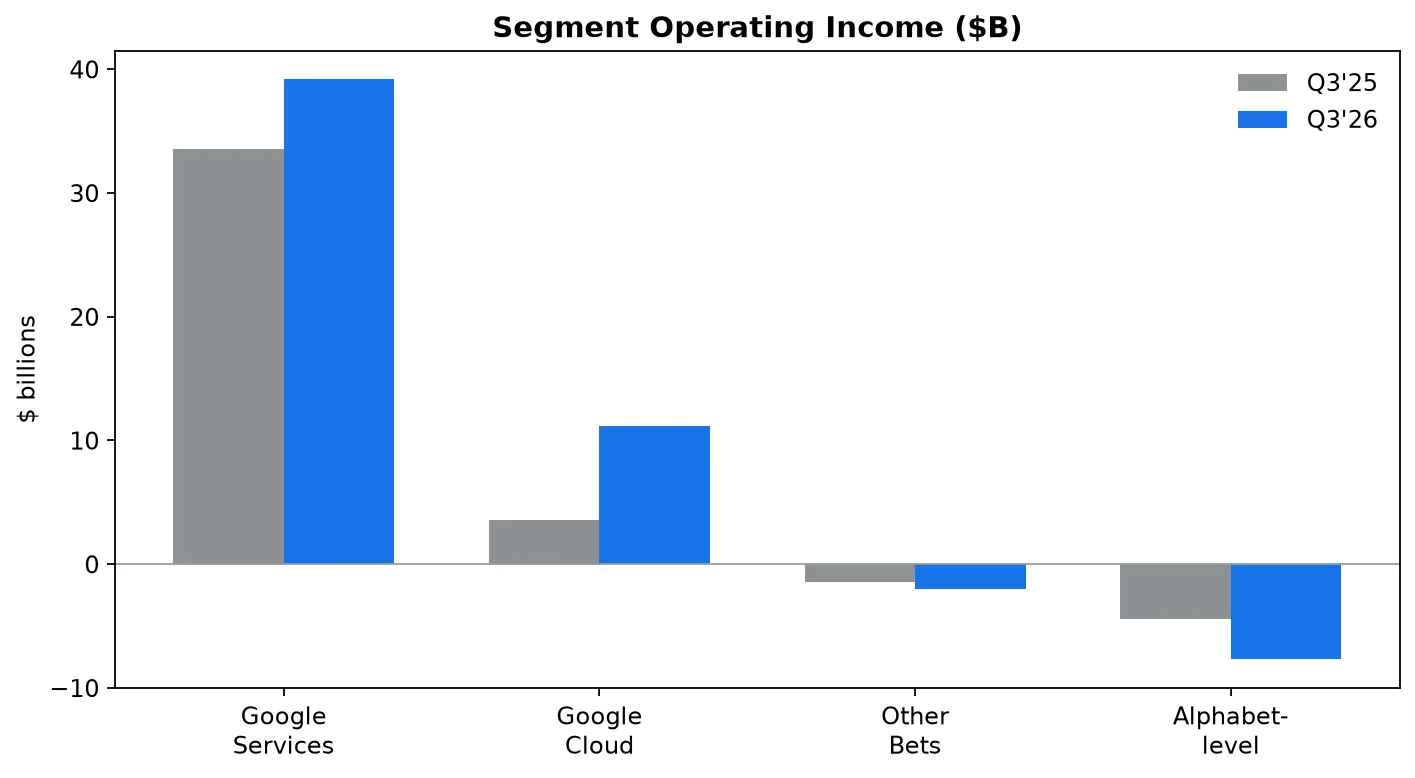
Segment operating income snapshot ($B): Google Services 39.16 (vs 33.53); Google Cloud 11.12 (vs 3.59); Other Bets -2.05 (vs -1.43); Alphabet-level activities -7.66 (vs -4.47).
5. Risk Ledger: CapEx, Commitments, Funding, and the Cash Bridge
Quarterly cash bridge from Exhibit 99.1 ($B):
| Q4 2025 | Q1 2026 | Q2 2026 | Q3 2026 | TTM | |
|---|---|---|---|---|---|
| Operating CF | 52.40 | 45.79 | 39.07 | 42.29 | 179.55 |
| CapEx (PPE) | 27.85 | 35.67 | 44.92 | 51.36 | 159.80 |
| Free cash flow | 24.55 | 10.12 | -5.86 | -9.07 | 19.75 |
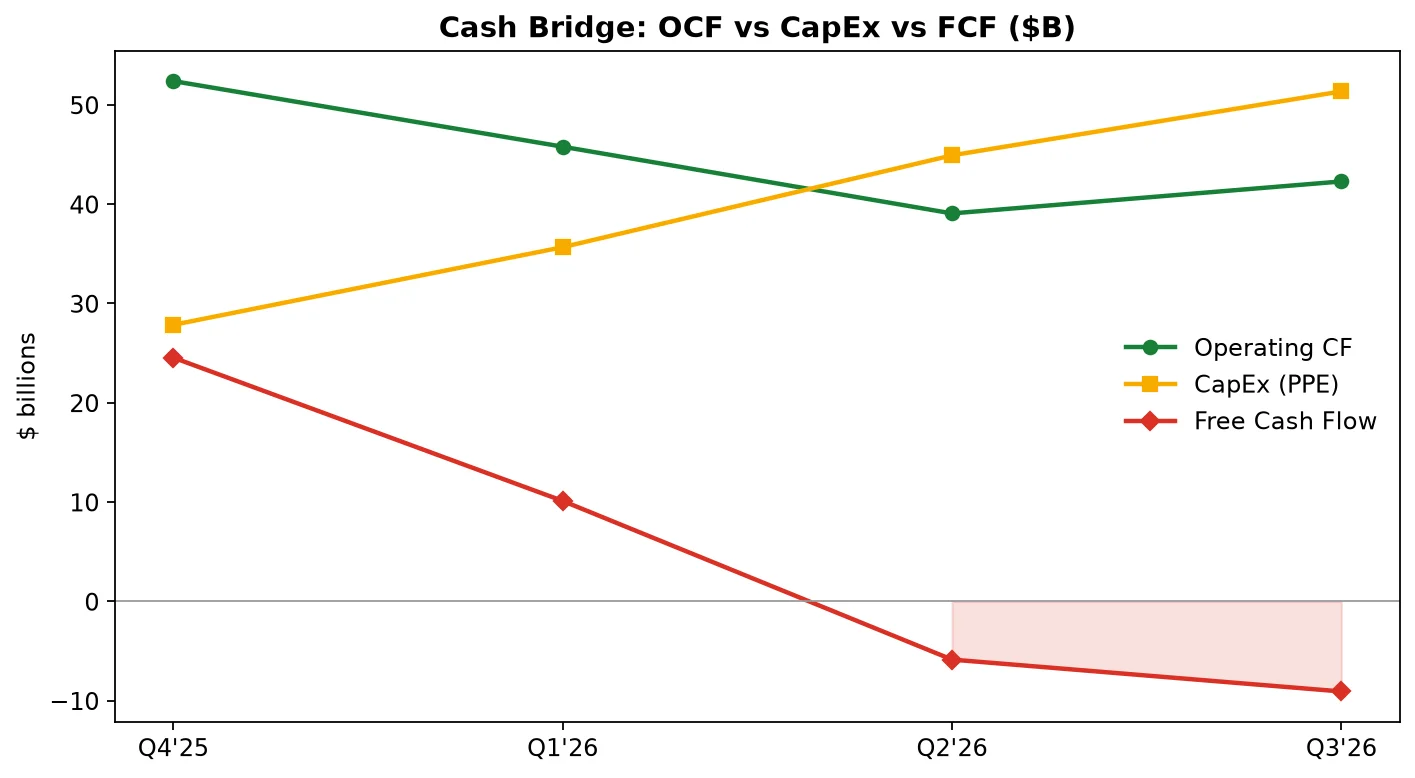
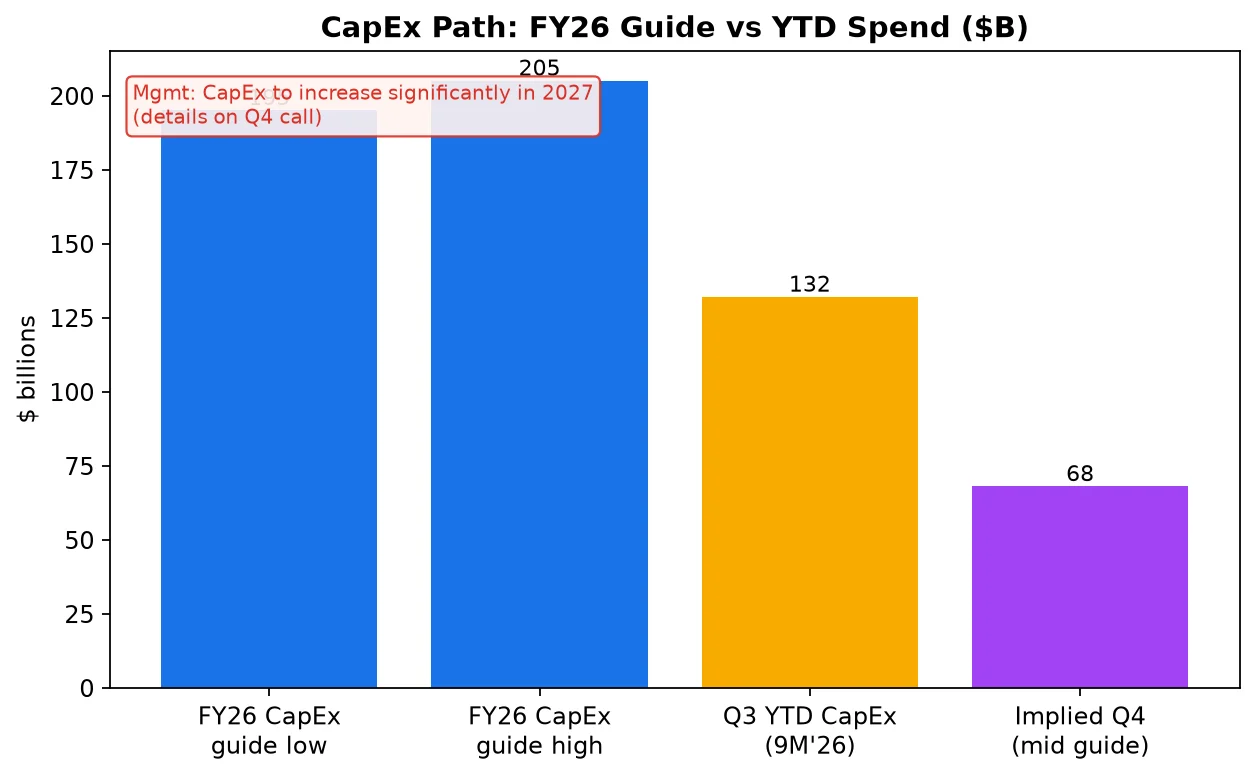
Two consecutive negative free-cash-flow quarters after years of Google-as-cash-machine is the emotional core of the selloff. CapEx composition in Q3: vast majority technical infrastructure; about 65% servers and networking (useful lives about 6 years), about 35% data centers (7 to 40 years). FY26 CapEx guide unchanged at $195B–$205B. Year-to-date PPE purchases through nine months: $131.953B—implying a still-heavy Q4 to land inside the guide band. Ashkenazi's line that landed hardest: CapEx will increase significantly in 2027, with details on the Q4 call. CNBC's market color went further, citing expectations that annual CapEx could exceed $300B in 2027—treat that figure as secondary reporting, not company guidance.
Off-balance and commitment stack at end-Q3:
- Future purchase commitments $924B
- Pre-commencement leases and other obligations $152B
- Management notes variable pricing and volume flexibility, so maxima overstate expected spend—but the order of magnitude is the point.
Funding mix in Q3 alone: ATM issuance—12M Class A for $4.3B net, 24M Class C for $8.1B net ($27.6B ATM capacity remaining); senior notes $28.7B net proceeds; common dividend declared at $0.22. Buybacks were $0 in Q3 (vs $11.5B a year ago)—the Deutsche Bank warning about buyback capacity compressed is visible in the cash flow statement.
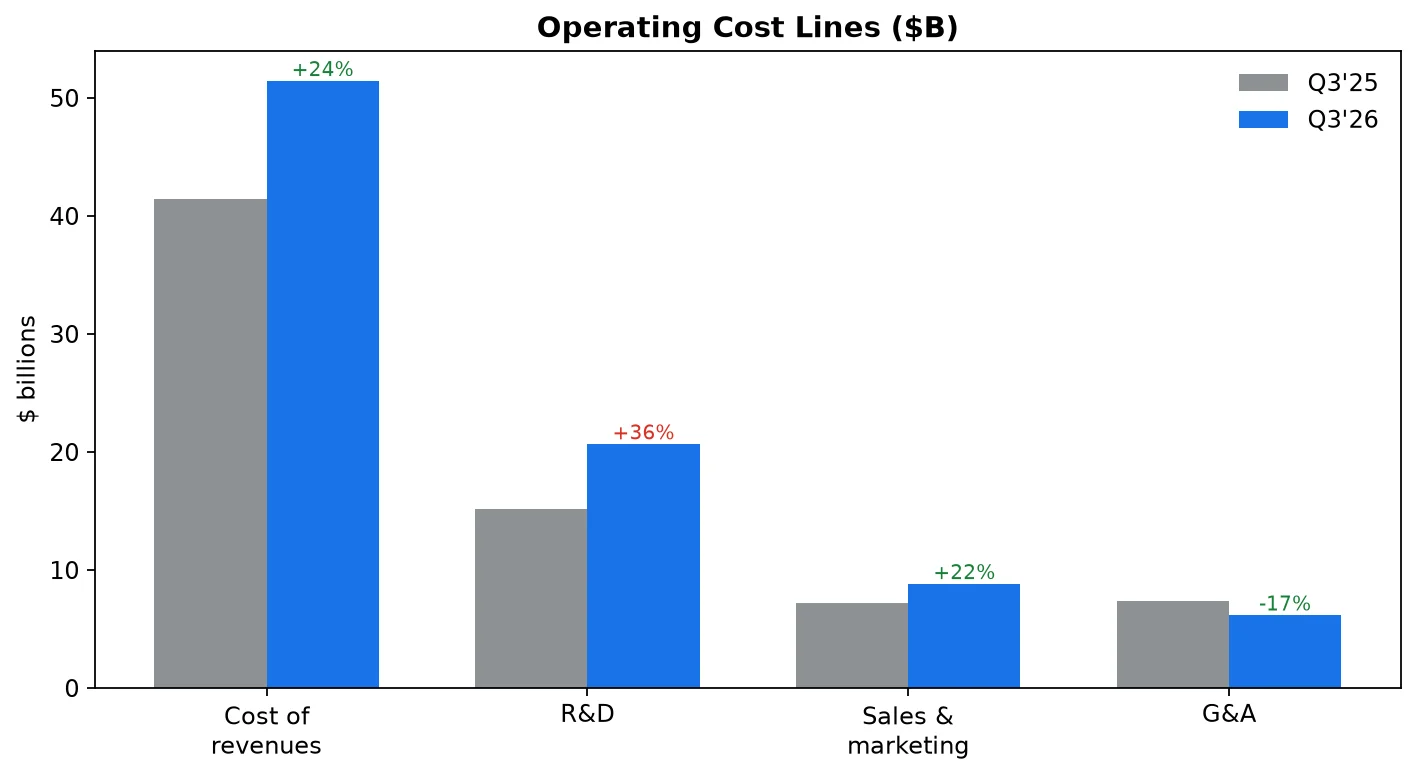
Expense inflation matches the AI war: cost of revenues +24% to $51.4B (TAC +10% to $16.4B; other cost of revenues +32% on TPU hardware COGS, depreciation, content, infra ops); R&D +36% to $20.6B; sales and marketing +22% to $8.8B; G&A -17% on legal lap. Alphabet-level activities loss widened to -$7.7B on shared AI R&D. Other Bets operating loss -$2.0B as Waymo expands (more than 300M autonomous miles; 15 U.S. cities; new public service in San Antonio, San Diego, Tampa; international plans).
6. Management Voice: What They Sold
Pichai's frame: half-trillion revenue run-rate; full-stack AI; Gemini 4 Argon and Carbon at the frontier (Carbon number one on the Artificial Analysis Intelligence Index at 59); Gemini app at 1B users ("fastest-growing product in Google's history"); recursive self-improvement accelerating model velocity; agentic experiences coming to consumers later this year after an Enterprise-first security bar.
Schindler's frame: Search is one product across traditional and AI surfaces; ads expansion in AI Mode is deliberate; Universal Commerce Protocol, Universal Cart, and Agent Payments Protocol as commerce rails; YouTube flywheel with Amazon joining YouTube Shopping.
Kurian's frame: diversified Cloud across AI labs, enterprises, and capital markets; TPU as a full system rather than a chip; expand distribution without abandoning GCP consumption.
Ashkenazi's frame: return on invested capital still expected above cost of capital; strong operating cash flow through the cycle; free-cash-flow pressure is the price of infrastructure and TPU inventory; Q4 Cloud margins soft on third-party capacity; Search compares tough.
The story they sold is coherent: spend to win distribution and tokens now; monetize Search AI surfaces carefully; Cloud pays for itself even as consolidated free cash flow flexes negative. The tape's rebuttal: prove Search dollar growth re-accelerates and 2027 CapEx does not orphan free cash flow for years.
7. Long vs Short Debate (Named Sources)
Long / constructive
- Citizens (Andrew Boone): still Buy despite price-target cut—Cloud strength, Gemini 4 / Argon, Android and Chrome distribution for agents.
- Company operating math: Services 40.7% margin plus Cloud 36.2% margin plus 25% top-line is not a broken franchise.
- Backlog $561B and token/seat metrics argue AI demand is contracted, not a slideshow.
- Same-night Microsoft validation of AI infrastructure monetization (Azure +48%) supports the category—even if GOOGL was the relative loser on the night.
Short / cautious
- Consensus miss trio (revenue, Search, adjusted EPS) plus a free-cash-flow hole deeper than feared (CNBC / LSEG framing).
- Deutsche Bank-style free-cash-flow yield and buyback concern validated by zero Q3 repurchase and ATM-plus-debt funding.
- AI Mode monetization lag admitted on the call—bullish for engagement, awkward for near-term Search dollars.
- 2027 CapEx "significant increase" with only Q4 detail promised removes optionality from the bear case.
- Legal and cash noise: $5.2B EC fine cash out in Q3; ongoing antitrust overhang remains a side plot even when it is not the day's headline.
8. Side Plots That Connect
SpaceX mark-to-market: other income and expense -$8.2B, mostly unrealized equity loss; tax-affected EPS hit about $0.55 per the release footnote. This is volatile non-operating noise—but it did shape the GAAP EPS print headline scrapers spat out.
Capital structure shift: cash and securities $265B against long-term debt $125B and preferred stock on the balance sheet shows Alphabet financing AI like an industrial, not a 2019-era buyback machine.
Waymo / Other Bets: strategic optionality with a $2B quarterly operating drag—tolerable if Search and Cloud compound; toxic optics if free cash flow stays negative and services growth keeps decelerating.
Microsoft split-screen: the market can love AI CapEx and still punish the name whose Search miss and free-cash-flow print arrived in the same filing. Relative performance versus MSFT into the cash open is itself a watchpoint.
9. Thesis Braid
Alphabet Q3 2026 is a barbell print: Cloud and AI usage are sprinting; Search dollars and free cash flow are the soft underbelly; management is explicitly choosing capacity and model leadership over near-term free-cash-flow cosmetics. The after-hours crash is not a verdict that Google is "losing AI"—it is a verdict that the market will not pay a scarcity multiple for a story that simultaneously misses Search consensus, guides CapEx higher into 2027, and prints about -$9B free cash flow.
Base case into year-end: Cloud stays hot (with systems-sale mix and third-party capacity muddying margins); Search growth stays mid-teens or worse on compares and FX until AI Mode ads scale; free cash flow stays under pressure through inventory and CapEx seasonality. The equity works if AI Mode monetization and Cloud cash conversion turn the 2027 CapEx debate into a return-on-capital debate. It fails if query growth keeps outrunning ad dollars while commitments ratchet higher.
10. Falsifiers and Watchpoints
- Search and other ads growth in Q4 and Q1 — re-acceleration despite FX and lapping would falsify the "AI Mode dilutes forever" short; another miss versus a falling consensus would deepen it.
- AI Mode / AI Overviews ad-load metrics — management-disclosed monetization progress (or silence) on the Q4 call.
- FY27 CapEx detail — a significant increase that still maps to rising Cloud backlog conversion and stabilizing trailing free cash flow is digestible; an open-ended spike without a free-cash-flow bridge is not.
- Cloud margin in Q4 — how ugly is the third-party capacity bridge, and does GCP excluding TPU systems remain very strong?
- TPU systems cash cycle — does inventory convert to revenue and cash in 2027 as Ashkenazi sketched, or does it become a permanent working-capital sink?
- Capital return — any restoration of buybacks versus continued ATM would signal free-cash-flow confidence.
- Relative performance versus MSFT into subsequent sessions — whether GOOGL's drawdown was a one-night positioning flush or a regime shift on Search.
Optimism is earned if Search dollars catch queries and Cloud's backlog becomes cash without another step-down in free cash flow. Caution is earned until those two receipts show up in the same quarter.
Sources: Alphabet Inc. Form 8-K Exhibit 99.1 (October 28, 2026); Alphabet Q3 2026 earnings call transcript; Google Keyword CEO remarks; CNBC after-hours movers and GOOGL earnings coverage; Investing.com price notes; TipRanks / MarketBeat on Citizens; Deutsche Bank CapEx / free-cash-flow commentary as reported. Not investment advice.
FAQs
Did Alphabet miss revenue in Q3 2026?
Yes. Total revenue was $127.577B versus LSEG consensus near $128.22B, per CNBC/LSEG framing, while still growing 25% year over year per Alphabet IR.
Why did GOOGL fall after hours on October 28, 2026?
Shares dropped roughly 9%–10% after a Search ads miss, adjusted EPS miss, and free cash flow of -$9.065B, alongside commentary that CapEx will rise significantly in 2027.
How fast did Google Cloud grow in Q3 2026?
Google Cloud revenue rose 103% to $30.709B with operating income of $11.121B and a 36.2% operating margin, per Alphabet Exhibit 99.1.
What is Alphabet FY2026 CapEx guidance?
Management kept full-year 2026 CapEx at $195B–$205B and said CapEx will increase significantly in 2027, with details on the Q4 call.
Was free cash flow negative?
Yes. Q3 free cash flow was -$9.065B after $51.355B of property and equipment purchases; trailing-twelve-month FCF remained positive at $19.747B.
Related articles
- How to Rebalance a Concentrated Stock Portfolio in 2026: Mag7 Drift, Tax-Aware Trims, and Practical Rebalance a concentrated stock portfolio in 2026: Mag7 drift risk, 5pp bands, tax-aware trims, RSP/IWM diversifiers, and single-name caps.
- Small Cap Stocks Investing Guide 2026: Russell 2000, Fed Hikes, and the Financing TradeSmall-cap stocks investing guide 2026: Russell 2000 vs S&P, IWM rate sensitivity, floating-rate debt, Fed hikes, valuation discounts, and a practical checklist.
- Santa Claus Rally and the Year-End Stock Market: Investor Guide for Late 2026Santa Claus rally explained: 7-day window stats since 1950, Nov–Dec seasonality, post-midterm 2026 setup, and a risk-managed year-end investing playbook.
- PEG Ratio vs P/E: How to Use Growth-Adjusted Valuation in Late 2026PEG ratio vs P/E explained with late-Oct 2026 ADBE, INTU, GOOGL, and AMZN figures—when PEG works, when CapEx breaks it, and a practical checklist.
- Portfolio Rebalancing Strategy in Late 2026: Calendar, Threshold, and Hybrid Rules That Survive AI DHow to rebalance a stock portfolio in late 2026: calendar vs threshold vs hybrid rules, AI/tech drift, chip volatility, and automation with budget caps.
- Dividend Aristocrats Investing Guide for Late 2026: Yield Traps, Quality Screens, and the Cash-ReturHow to evaluate S&P 500 Dividend Aristocrats in late 2026: yield traps vs quality, NOBL ETF, October high yields, and a cash-return rotation checklist.