

Small Cap Stocks Investing Guide 2026: Russell 2000, Fed Hikes, and the Financing Trade
Small-cap stocks investing guide 2026: Russell 2000 vs S&P, IWM rate sensitivity, floating-rate debt, Fed hikes, valuation discounts, and a practical checklist.

Key Takeaway
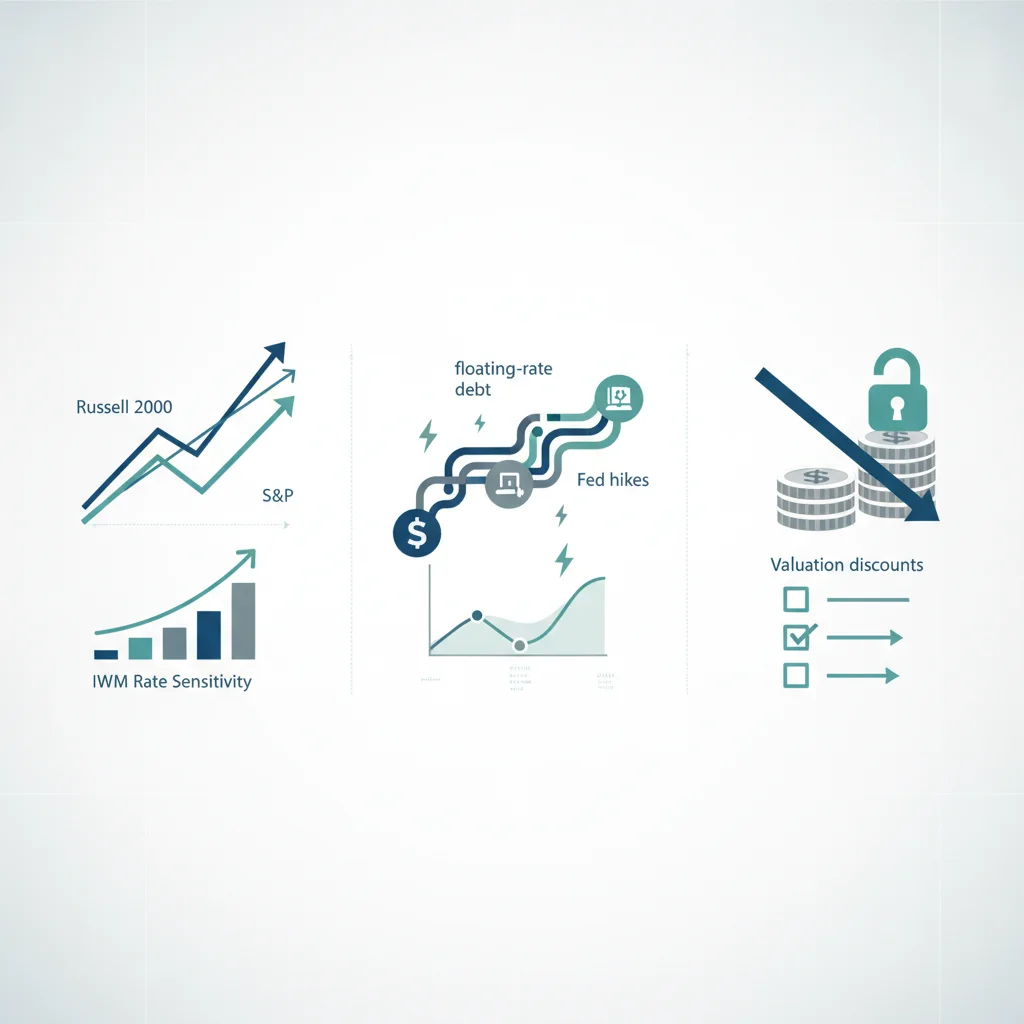
Small-cap stocks investing in late 2026 is less a story about "forgotten America" and more a story about financing costs. After leading large caps through parts of the first half, the Russell 2000 Index fell roughly 7.2% in the third quarter while large-cap benchmarks held up better, producing more than nine percentage points of underperformance versus the S&P 500—the steepest quarterly gap since the first quarter of 2020, according to late-September CNBC reporting citing CFRA. The proximate cause was not a sudden collapse in domestic demand; it was rising policy rates, a 10-year Treasury push above 5%, and the market's renewed focus on which balance sheets reprice when the Federal Reserve tightens.
The mechanism is unusually clear for equity investors. Goldman Sachs data widely cited across September–October 2026 commentary put floating-rate debt at about 32% of Russell 2000 companies versus roughly 6% of S&P 500 companies. J.P. Morgan Asset Management has separately framed small-cap interest coverage as far thinner than large-cap coverage, which means each Fed move shows up faster in interest expense and free cash flow. Bank of America estimates circulating in midterm-rotation notes put the operating-earnings hit near 2% per quarter-point hike. That is why a September 16, 2026, 25-basis-point hike to a 3.75%–4.00% funds target—the first hike since 2023—hurt IWM and Russell 2000 value/growth sleeves differently from megacap AI names that mostly term out fixed-rate debt.
Yet the valuation and earnings backdrop is not one-sided. FTSE Russell's Q3 2026 spotlight still showed the Russell 2000 ahead of the Russell 1000 on a year-to-date and twelve-month total-return basis as of September 30, even after the quarterly reversal. CFRA's Sam Stovall argued that the Russell 2000's price-to-earnings multiple sat near a 34% discount to its 20-year average after the selloff. Morningstar's November 3, 2026, market outlook continued to recommend an overweight in small caps by capitalization, alongside a barbell of value and growth. This guide treats small-cap stocks investing as a process: separate index beta from quality screens, map rate sensitivity before chasing cheap multiples, and keep falsifiers—another hike, a high-yield spread blowout, or an earnings recession—visible. Educational note only: verify live quotes, filings, and index reconstitutions before you act.
Why Small Caps Became a Financing Trade
Floating-rate debt is the first filter
When investors say "small caps are rate sensitive," they often mean something vaguer than the balance-sheet math. Floating-rate share near one-third of the Russell 2000 versus single digits for the S&P 500 means coupons reset with SOFR and policy expectations. A company that borrowed when cuts were priced into 2025 suddenly faces a higher coupon path after Warsh-era hawkishness and a September hike. Large caps that issued long fixed-rate bonds in 2020–2021 feel the same Treasury move mainly through equity duration and WACC, not through next quarter's interest line. Small-cap stocks investing that skips this filter will misread every FOMC week as a generic "risk-on/risk-off" event rather than a cash-flow event for leveraged issuers.
Cause and effect from Jackson Hole to IWM
Cause and effect in the second half of 2026 ran from inflation communication to futures odds to small-cap multiples. Sticky PCE readings and Fed commentary that inflation near the high-3% area was "concerning" pushed markets to price additional hikes into year-end. Energy prices and deficit concerns helped push the 10-year to multi-year highs near or above 5%. Small caps, carrying more leverage and more floating coupons, repriced first. CFRA's framing—"it's all about interest rates"—matched the tape: September alone saw the Russell 2000 down more than 4% in the CNBC window that flagged the quarterly underperformance path.
Quality versus the index headline
Nearly half of Russell 2000 names can show trailing losses in some measurement windows, which inflates headline trailing P/E and turns "cheap index" into a trap. Birinyi-linked commentary has shown trailing multiples for the Russell 2000 looking expensive versus the S&P when loss-makers distort the denominator, even while forward multiples and profitable-subset valuations tell a different story. Janus Henderson's mid-2026 note that Russell 2000 EPS grew roughly 43% in the second quarter—well ahead of ~26% expectations—matters precisely because it sat beside that quality problem: the index can deliver strong earnings growth at the aggregate level while still housing a large unprofitable cohort. Small-cap stocks investing therefore needs a profitability or free-cash-flow screen before an index overweight becomes a junk-yield bet.
Russell 2000 Versus S&P 500: What the 2026 Path Actually Shows
First-half leadership, third-quarter reversal
State Street's late-June commentary described a period when the Russell 2000 had delivered roughly 21% year-to-date versus about 10% for the S&P 500—leadership that felt like the long-awaited broadening after years of megacap dominance. FTSE Russell's September 30 snapshot then documented the flip: Russell 2000 total return about −7.2% for the quarter versus +1.8% for the Russell 1000, with Russell 2000 Growth −9.4% and Value −4.9%. Year-to-date, the Russell 2000 was still ahead of the Russell 1000 in that spotlight (about 16.2% versus 15.0%), which is why "small caps are broken" was the wrong slogan. The right slogan was "small-cap beta became a rate trade again."
IWM as the liquid expression—and its limits
The iShares Russell 2000 ETF (IWM) remains the default vehicle for expressing a small-cap stocks investing view without picking regional banks, biotech, or microcap industrials one by one. It is also a blunt instrument. Sector weights, profitability mix, and financials leverage inside IWM can diverge from the narrative you hold after reading Morningstar's small-cap overweight. Using IWM for beta and then deciding whether to overlay quality small-cap active funds, equal-weight large-cap diversification, or single-name cyclicals is usually cleaner than pretending the ETF already isolates "cheap domestic growth with clean balance sheets."
Value led growth inside the drawdown
Inside the Russell 2000, Q3's Value sleeve declined less than Growth (−4.9% versus −9.4% in FTSE Russell's figures). That pattern rhymes with hiking-cycle history in which value and energy have often held up better than speculative growth when funding costs rise. It also warns growth-oriented small-cap buyers: the names that benefited most from 2025's cut cycle can be the same names that give back the most when hike odds reappear. Style is not optional decoration on a small-cap overweight; it is part of the risk budget.
How Rate Hikes Transmit Into Small-Cap Earnings
Interest coverage and the 2% rule of thumb
J.P. Morgan's small-cap research has highlighted interest coverage near 1.5× for small caps versus nearly 9× for large caps in earlier snapshots, alongside floating-rate debt shares near 41.5% versus 18% in one of their comparative frames. Exact ratios move with the cycle, but the direction is stable: small issuers have less cushion. Bank of America's roughly 2% operating-earnings hit per 25-basis-point hike is a planning number, not a law of physics—yet it is useful for position sizing. If futures imply two more hikes into early 2027, a mechanical earnings haircut of several percentage points belongs in your bull/base/bear table before you buy the "34% cheap versus history" CFRA multiple.
High-yield spreads as the early-warning dashboard
HB Wealth and other September 2026 strategy notes watched high-yield option-adjusted spreads as the bridge between Fed funds and small-cap equity multiples. Spreads that climb from tight levels while the 10-year spikes are how equity investors see refinancing stress before earnings season confirms it. Small-cap stocks investing that only watches IWM relative strength and ignores HY OAS is flying without the altitude gauge. A spread blowout is a clearer falsifier for a small-cap overweight than a single soft retail print.
Regional banks and industrials as transmission belts
Rate hikes do not hit every small-cap sector equally. Regional and mid-size banks feel net interest margin and credit simultaneously; industrials and materials feel WACC and end-demand; unprofitable biotech feels the discount rate on distant cash flows. Liquid large-cap proxies still help map the regime: PNC and JPM for banking transmission, CAT for cyclical industrial demand. Use them as regime dashboards even when your actual risk sits in IWM.
When you want to interrogate IWM, PNC, CAT, and JPM after every FOMC print without rebuilding a spreadsheet, Alphio's Conversational Trading lets you ask those questions in plain language, while Scheduled Task can calendar post-FOMC and post-CPI reviews so a small-cap overweight does not drift through a hawkish week unnoticed.

Stress-test small-cap rate scenarios with Conversational Trading

Automate FOMC-week portfolio checks with Scheduled Task
Valuation: Cheap Index Versus Cheap Businesses
The 34% discount and what it does not prove
CFRA's observation that the Russell 2000 traded near a 34% P/E discount to its 20-year average after the Q3 drawdown is a genuine signal that the index is no longer priced like a late-cycle melt-up. It is not proof that buying IWM tomorrow has positive expected alpha. Multiples can stay depressed while the Fed hikes, while HY spreads widen, or while earnings estimates for 2027 are cut. Stovall's own advice in the CNBC piece was patience: wait for a clearer borrowing-cost picture before treating the discount as a buy signal.
Morningstar's small-cap overweight in context
Morningstar's November outlook argued the US market traded about 10% below its covered fair-value composite as of October 30, 2026, and still recommended overweighting small caps, market-weighting large caps, and underweighting mid-caps—inside a barbell that overweights value and growth while underweighting core. That is a valuation-and-style framework, not a timing call on the next Fed meeting. Pairing Morningstar's capitalization tilt with a quality screen (positive earnings, manageable interest coverage, limited near-term maturities) is how small-cap stocks investing stays consistent with the research without cloning every passive share class.
Forward earnings and the 2027 growth debate
Janus Henderson noted that consensus still expected small-cap earnings to grow faster than large-cap earnings into 2027 in one midyear frame (about 21.8% versus a slower large-cap pace in their comparison). If that path holds while rates stabilize, the valuation gap can close through earnings rather than multiple expansion. If hiking continues and coverage ratios compress, the same growth estimate becomes the first line revised lower. Write both paths down; do not outsource the decision to a single "small caps are cheap" headline.
A Practical Framework for Small-Cap Stocks Investing
Taxonomy before tickers
Label exposure as (1) Russell 2000 / IWM beta, (2) quality profitable small-cap or active sleeve, and (3) cyclical or financial transmission proxies (industrials, regional banks) that tell you whether the rate shock is still intensifying. The taxonomy explains why October's "Anything but AI" rotation into energy, staples, utilities, and healthcare—documented in Morningstar's November note—can coexist with soft small-cap absolute returns when financing stress dominates capitalization. It also clarifies whether you are expressing diversification away from Magnificent Seven concentration or simply buying more leverage to policy rates.
Checklist that survives a Fed week
Ask whether the names behind your small-cap stocks investing sleeve have floating-rate share you can estimate; whether trailing multiples are distorted by loss-makers; whether HY spreads and the 10-year are confirming or contradicting the equity bid; whether Value versus Growth inside the Russell 2000 matches the style you intended; and whether IWM already embeds the sector bets you are about to amplify with single names. A short written answer beats another relative-strength chart after a two-day bounce.
Encode caps if you automate
If you express a small-cap view through Alphio Copy Trade strategies or Autonomous Trading agents, hard budget and stop rules matter more than the narrative. A nine-point quarterly underperformance gap versus the S&P and a first hike in three years are exactly the moments when automation without caps turns a diversification idea into unintended rate leverage.

Keep small-cap copy-trade budgets capped on Alphio

Set agent risk limits with Autonomous Trading
Risks and What Would Break the Thesis
Another hike or a stuck 5% Treasury
The cleanest near-term falsifier is policy and term yields. If December or early-2027 hikes land while the 10-year holds above 5%, floating-rate interest expense keeps rising and CFRA's "wait for clearer borrowing costs" advice stays binding. Small-cap stocks investing that assumes the September hike was a one-and-done without watching futures is wishful.
Credit stress and earnings recession
A sharp widening in high-yield spreads, rising delinquencies at regional banks, or a broad cut to 2027 small-cap EPS estimates would invalidate the "cheap and growing" synthesis even if IWM looks washed out on charts. The 2020-style underperformance gap can return if growth fears join rate fears.
Narrative reversal into megacap leadership
Conversely, if AI-ROI fears fade and megacap tech reclaims leadership—the mirror of October's Anything-but-AI rotation—equal-weight and small-cap sleeves can lag without a recession. Build the sleeve so that reversal is uncomfortable, not catastrophic: size IWM as diversification, not as a leveraged bet that large-cap concentration must mean-revert on your timetable.
Conclusion
Small-cap stocks investing into the remainder of 2026 sits at the intersection of a still-constructive relative valuation case and a clearly hostile financing regime. The Russell 2000's roughly 7.2% Q3 drawdown, more than nine points of underperformance versus the S&P 500, ~32% floating-rate debt share versus ~6% for large caps, and a September hike to 3.75%–4.00% explain why IWM became a rate trade again. Against that, FTSE Russell's YTD leadership for the Russell 2000 into September 30, CFRA's ~34% P/E discount to the 20-year average, Morningstar's continued small-cap capitalization overweight, and episodes of strong small-cap EPS growth keep the opportunity set alive for patient, quality-screened capital.
Operationalize the view with taxonomy, a written IWM-versus-quality checklist, and hard risk caps. When you are ready to turn that process into a living workflow, use Alphio's Scheduled Task for Fed-and-CPI calendar reviews, Conversational Trading to interrogate IWM, PNC, CAT, and JPM in plain language, and keep any Copy Trade or Autonomous Trading small-cap sleeves inside budget limits so a rate shock cannot rewrite your book without consent.
This article is for educational purposes only and is not investment advice. Verify live quotes, filings, index methodology, and rate data before making decisions.
FAQs
Why did Russell 2000 small-cap stocks underperform in Q3 2026?
Rising policy rates and Treasury yields were the main driver. The Russell 2000 fell about 7.2% in Q3 and underperformed the S&P 500 by more than nine percentage points—the steepest such gap since Q1 2020—after the Fed's September 25 bp hike and a 10-year move above 5%. Roughly 32% of Russell 2000 firms carry floating-rate debt versus about 6% of S&P 500 firms, so higher rates hit small-cap interest expense faster.
Are small-cap stocks cheap after the 2026 selloff?
Relative to history, CFRA argued the Russell 2000 P/E sat near a 34% discount to its 20-year average after the Q3 drawdown, and Morningstar's November outlook still recommended overweighting small caps. Cheap multiples are not a timing signal: wait for clearer borrowing-cost and high-yield-spread conditions, and screen out unprofitable names that distort headline trailing P/Es.
How should investors use IWM for small-cap exposure?
IWM is the liquid Russell 2000 beta vehicle, useful for a capitalization tilt away from megacap concentration. It is blunt on quality, sector mix, and floating-rate leverage. Many investors pair IWM for beta with a quality or active small-cap sleeve and watch HY spreads plus Value-versus-Growth inside the Russell 2000.
How much do Fed hikes hurt small-cap earnings?
Bank of America estimates cited in 2026 strategy notes put the operating-earnings hit near 2% per 25-basis-point hike for small caps, reflecting higher floating-rate share and thinner interest coverage versus large caps. Treat that as a planning assumption to stress-test, not a precise forecast for every constituent.
What would falsify a small-cap overweight into year-end 2026?
Key falsifiers include additional Fed hikes while the 10-year stays above ~5%, a sharp widening in high-yield spreads, cuts to 2027 small-cap EPS estimates, or a renewed megacap leadership phase that leaves IWM lagging even without a recession. Stabilizing yields plus confirmed profitable-cohort earnings growth would support the opposite case.
Related articles
- Santa Claus Rally and the Year-End Stock Market: Investor Guide for Late 2026Santa Claus rally explained: 7-day window stats since 1950, Nov–Dec seasonality, post-midterm 2026 setup, and a risk-managed year-end investing playbook.
- AppLovin Q3 2026 Deep Dive: Beaten-Down S&P Dog Meets Axon Next-Gen Beat-and-Raise—and a $3.2B BuybaAppLovin Q3 2026: $2.185B rev (+55%), EPS $4.30 vs ~$4.03–4.04 Street, Adj EBITDA $1.842B (84%). Beat own guide $100M; Q4 $2.365–2.395B; auth +$3.2B; AH +22–24%.
- Democratic Sweep Sends Stocks Soaring: Dow Posts Best Post-Midterm Rally in 44 Years Amid AI Sector US stocks surged after Democrats swept the 2026 midterms. The Dow jumped 1,569 points for its best post-election day since 1982 as markets cheered political clarity.
- Stop Limit Orders: The Complete Guide to Advanced Order TypesMaster stop limit orders with our comprehensive guide. Learn how stop limit orders work, when to use them, and key strategies for risk management in trading.
- Federal Reserve Interest Rate Decision July 2026: Market Analysis & Investment OutlookComprehensive analysis of the Federal Reserve's July 2026 interest rate decision. Discover how Fed policy impacts stocks, bonds, and your investment strategy.
- Margin Rate Explained: Understanding the True Cost of Leveraged TradingLearn everything about margin rates in 2026: how they're calculated, broker comparisons (Robinhood, IBKR, Schwab), hidden costs, and risk management strategies.