

PEG Ratio vs P/E: How to Use Growth-Adjusted Valuation in Late 2026
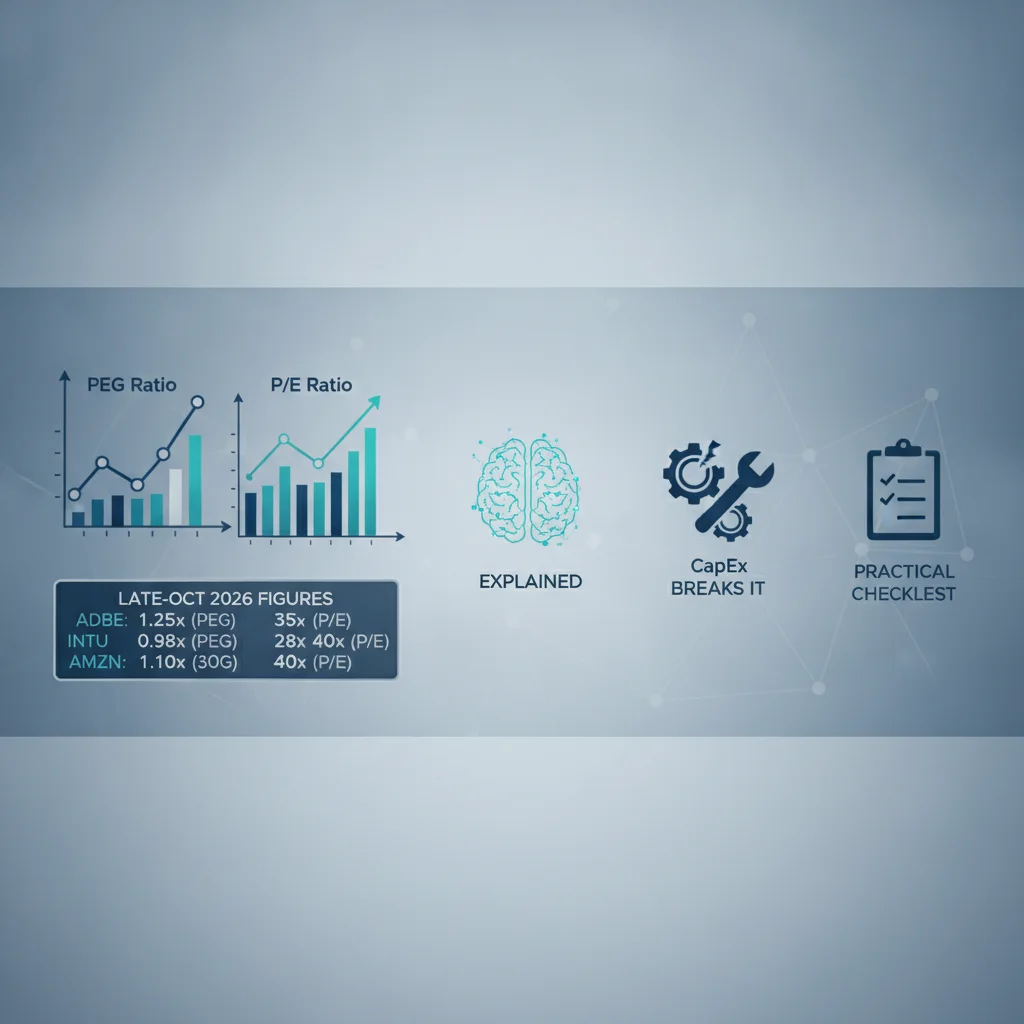
PEG ratio vs P/E explained with late-Oct 2026 ADBE, INTU, GOOGL, and AMZN figures—when PEG works, when CapEx breaks it, and a practical checklist.

Key Takeaway
In late October 2026 the S&P 500 trades at a forward 12-month P/E of roughly 18.7, according to FactSet as of October 23—below both the five-year average near 19.8 and the ten-year average near 19.1. That headline multiple looks almost calm next to what investors actually confront in individual names. Adobe sits near $258.62 with a trailing P/E of 14.43, a forward P/E of 9.63, and a StockAnalysis PEG of 0.69, while Alphabet prints a trailing P/E of 15.90 yet a forward P/E of 23.68 and a PEG of 1.78. Amazon’s trailing P/E of 20.03 and PEG of 1.29 coexist with negative free cash flow of $11.63 billion. The lesson is blunt: a single P/E number without growth context, and a single PEG number without cash-flow context, can each tell a confident story that the rest of the financials refuse to support.
The PEG ratio—price-to-earnings divided by expected EPS growth—exists to answer the question P/E leaves hanging: how much growth are you paying for? Classic educational heuristics from Investopedia, Schwab, and CNBC often frame PEG below 1 as potentially cheap relative to growth and PEG above 2 as rich, but those thresholds are rules of thumb, not laws. They work best for growth companies with credible forecasts and fail badly when growth estimates are wrong, when CapEx swallows free cash flow, or when you compare a software compounder to a capital-intensive hyperscaler as if they shared the same risk. This guide walks through how PEG and P/E differ, how Adobe, Intuit, Alphabet, and Amazon look side by side in late October 2026, when PEG misleads, and how to turn a valuation screen into a disciplined watchlist process.
Educational note: nothing here is investment advice. Multiples change with prices and estimate revisions; always verify current figures and match the method to your own constraints.
What the P/E Ratio Actually Measures (and Distorts)
Trailing versus forward earnings
The price-to-earnings ratio is the market’s most familiar valuation shorthand: share price divided by earnings per share. Trailing P/E uses the last twelve months of reported EPS; forward P/E uses consensus estimates for the next twelve months. In late October 2026 that distinction is not academic. Adobe’s trailing P/E of 14.43 versus forward P/E of 9.63 implies the market is pricing a sharp earnings step-up relative to the recent past. Alphabet flips the pattern: trailing P/E of 15.90 looks cheaper than a forward P/E of 23.68, which embeds a more expensive claim on tomorrow’s earnings power. Amazon sits in between on trailing terms at 20.03 but stretches to a forward P/E of 26.81. Reading only one of those columns is how investors accidentally compare a rear-view mirror to a forecast.
What P/E quietly ignores
P/E says nothing about growth duration, capital intensity, or cash conversion. A low trailing multiple can simply mean earnings already peaked, or that the market distrusts the quality of those earnings. A high forward multiple can mean either exuberance or a correctly priced multi-year compounding story. Free cash flow is the missing character. Alphabet’s operating cash flow of $185.68 billion is enormous, yet CapEx of $132.40 billion leaves free cash flow at $53.27 billion and an FCF yield of only 1.37%, with a P/FCF of 72.73. Amazon’s CapEx of $173.03 billion exceeds operating cash flow of $161.40 billion, producing negative free cash flow of $11.63 billion and an FCF yield of −0.43%. Earnings multiples that look “reasonable” on the income statement can still sit on top of a cash-flow story that is anything but cheap.
Index context without false comfort
The S&P 500’s forward P/E near 18.7—also cited in the mid-18.6 to 18.7 range around October 26—sits below recent multi-year averages, which some investors read as modest valuation. Index averages hide dispersion. Software names with mid-teens or single-digit forward P/Es can coexist with hyperscalers whose forward multiples and CapEx loads look nothing like the index mean. Using the market’s 18.7 as a personal hurdle rate for every stock is how PEG and peer work get skipped. P/E is a starting coordinate, not a destination.
How the PEG Ratio Adds Growth Context
The formula in plain language
PEG equals the P/E ratio divided by the expected EPS growth rate (typically expressed as a whole number, so a 20% growth expectation enters the math as 20). If a stock trades at 20 times earnings and consensus expects 20% EPS growth, PEG is 1.0. If another stock trades at 15 times earnings with 30% expected growth, PEG is 0.5. The intuition is that you are normalizing the multiple for the growth you believe you are buying. Educational sources often treat PEG under 1 as a screen for growth that may not be fully priced and PEG above 2 as a flag for optimism that looks expensive relative to the growth rate used in the denominator.
Why the growth input dominates the answer
PEG is only as honest as the growth rate you plug in. Swap a five-year analyst growth estimate for a one-year number, or swap a bullish house model for a skeptical one, and the same stock’s PEG can jump from “cheap” to “fair” overnight. Adobe’s StockAnalysis PEG of 0.69 is the figure used in this article, but Yahoo Finance and Zacks sometimes show Adobe PEG readings in a wider band—roughly 0.77 to 1.80 depending on the growth source. That spread is not a data-vendor conspiracy; it is the PEG ratio admitting that growth is an estimate, not a fact. Whenever two screens disagree on PEG, the first diagnostic is which growth rate each screen used, not which website is “right.”
Where PEG earns its keep
PEG is most useful for growth companies with reasonably stable business models and analyst coverage dense enough that a consensus growth rate is not a single analyst’s fantasy. Software and platform names with visible subscription or advertising engines often fit that profile better than deeply cyclical industrials or early-stage biotechs. Even then, PEG should be peer-relative: Adobe’s 0.69 versus Intuit’s 1.14 versus Alphabet’s 1.78 versus Amazon’s 1.29 is a conversation about relative growth pricing inside a late-2026 tape, not a universal bargain ranking. Pair PEG with forward P/E, FCF yield, and balance-sheet context before treating any reading as a conclusion.
Side-by-Side: ADBE, INTU, GOOGL, AMZN in Late October 2026
Adobe: low PEG, high cash conversion
Adobe closed near $258.62 on October 26 with a market capitalization of about $100.65 billion. Trailing P/E of 14.43 and forward P/E of 9.63 already look restrained against the S&P 500’s forward multiple near 18.7; the StockAnalysis PEG of 0.69 pushes the growth-adjusted reading into the territory classic primers call potentially inexpensive. Cash-flow quality backs the income statement more than many AI-era peers: free cash flow of $10.59 billion against revenue of $25.97 billion and net income of $7.28 billion, with P/S of 3.88, P/FCF of 9.50, and FCF yield of 10.52%. Gross margin of 89.25%, operating margin of 36.32%, and ROE of 61.90% describe a high-quality software P&L. The stock is still down about 26.84% over fifty-two weeks, and the average analyst target of $272.31 implies roughly 5.29% upside with a Hold-leaning consensus—so the cheap-looking PEG coexists with muted Street enthusiasm and a bruised chart.
Intuit: mid-teens forward P/E, PEG near fair
Intuit trades near $339.89 with a market cap of about $90.83 billion. Trailing P/E of 20.65 and forward P/E of 14.27 sit closer to “quality compounder” than “deep value,” and a PEG of 1.14 lands near the educational fair-value zone around 1. Free cash flow of $8.66 billion, P/FCF of 10.48, and FCF yield of 9.54% keep cash conversion respectable against revenue of $21.45 billion. Gross margin of 80.98%, operating margin of 28.80%, and ROE of 23.60% are strong without matching Adobe’s extreme ROE. The fifty-two-week drawdown of roughly 50.24% is severe; analysts still lean Buy with an average target of $407.76 (+19.97%), and a dividend yield near 1.62% adds a small income layer most pure growth screens ignore. Intuit is the reminder that PEG near 1 can still sit on a stock that has already absorbed a large price reset.
Alphabet: cheap trailing earnings, expensive growth and CapEx
Alphabet near $316.80 carries a $3.87 trillion market capitalization that dwarfs the software pair. Trailing P/E of 15.90 looks almost modest; forward P/E of 23.68 and PEG of 1.78 look less so. Revenue of $445.87 billion and net income of $244.12 billion are staggering, and ROE of 48.68% remains elite, yet free cash flow tells the AI CapEx story: operating cash flow of $185.68 billion minus CapEx of $132.40 billion leaves FCF of $53.27 billion, FCF yield of 1.37%, and P/FCF of 72.73. PEG alone cannot see that earnings power is being reinvested into infrastructure at a scale that compresses owner cash yield. Analysts still mark Strong Buy with a target near $429.12 (+35.46%), which means the Street is underwriting the CapEx cycle as value-creating—even while a PEG-and-FCF checklist says “growth is priced and cash is scarce today.”
Amazon: growth priced in, free cash flow negative
Amazon near $249.09 shows trailing P/E of 20.03, forward P/E of 26.81, and PEG of 1.29—neither a classic bargain nor an obvious bubble on the PEG heuristic alone. Revenue of $775.68 billion and net income of $135.28 billion confirm scale and profitability on an earnings basis. Free cash flow of −$11.63 billion, CapEx of $173.03 billion against operating cash flow of $161.40 billion, and FCF yield of −0.43% show why PEG is incomplete: you can look roughly fair on growth-adjusted earnings while still delivering no free cash to equity holders in the current CapEx wave. Strong Buy consensus and a target of $332.24 (+33.38%) again illustrate the gap between earnings-based optimism and cash-flow austerity. A PEG near 1.3 is not a free lunch when the cash statement is running negative.
When PEG Works — and When It Fails
Conditions where PEG adds signal
PEG works best when three conditions hold at once. First, the company is a growth business where EPS growth is a meaningful driver of value, not a side effect of a commodity cycle. Second, the growth rate used in the denominator is drawn from a transparent, peer-comparable source—and you keep that source fixed when you rank names. Third, cash conversion and balance-sheet risk are not the dominant story. Adobe’s combination of PEG 0.69, FCF yield above 10%, and high margins is the textbook case for why investors invented PEG: a low multiple relative to growth, supported by cash. Intuit’s PEG near 1.14 with solid FCF yield is the fair-value cousin of that story.
Forecast error and the illusion of precision
PEG fails when the growth estimate is wrong. A stock that screens at 0.8 on a 25% growth assumption becomes a 1.6 if realized growth is only 12.5% and the multiple does not compress in sympathy. Late-cycle estimate cuts after an AI narrative cools are a classic way for “cheap PEG” screens to disappoint. The Adobe PEG dispersion across data vendors—StockAnalysis at 0.69 versus other feeds that can print higher—is a live warning that two investors can run the same screen and get different buy lists solely because of the growth input.
Capital intensity and mature businesses
PEG also fails when CapEx and working capital dominate the economic reality. Alphabet and Amazon in October 2026 are teaching examples: earnings can look investable while free cash flow is scarce or negative because AI infrastructure spend is the real budget. Mature, low-growth companies create a different failure mode: dividing a moderate P/E by a tiny growth rate produces a huge PEG that screams “expensive” even when the stock is a stable cash cow better judged on dividend, FCF yield, or EV/EBITDA. PEG is a growth tool. Using it as a universal valuation language for utilities, deep-value cyclicals, or CapEx-heavy platforms is a category error.
Building a Valuation Checklist Beyond One Ratio
Layer multiples instead of crowning one king
A practical checklist starts with trailing and forward P/E, then PEG, then at least one cash-flow multiple and one yield. For Adobe that stack might read: trailing 14.43, forward 9.63, PEG 0.69, P/FCF 9.50, FCF yield 10.52%. For Alphabet: trailing 15.90, forward 23.68, PEG 1.78, P/FCF 72.73, FCF yield 1.37%. The same five columns immediately show why “cheap on trailing earnings” and “cheap on growth-adjusted earnings” are not synonyms for “cheap on owner cash.” Add EV/EBITDA when net cash or net debt distorts equity multiples, and always peer-compare inside the industry rather than against the S&P 500’s 18.7 forward P/E alone.
Quality, balance sheet, and margin structure
Multiples without quality context invite value traps. Gross and operating margins, ROE, and revenue scale explain whether a low PEG is earned. Adobe’s 89.25% gross margin and 36.32% operating margin support a premium quality label even after a 26.84% fifty-two-week decline. Intuit’s 80.98% gross and 28.80% operating margins similarly underwrite a mid-teens forward P/E. Alphabet’s ROE of 48.68% and Amazon’s sheer revenue base of $775.68 billion keep both in the quality conversation even when FCF yields look poor. Balance-sheet strength—liquidity, leverage, buyback capacity—belongs on the same page as PEG so a cheap growth screen does not ignore refinancing risk.
Analyst targets as context, not oracles
Average price targets and ratings are useful as a sentiment overlay, not as a substitute for your checklist. Adobe’s Hold and ~5% implied upside contrast with Intuit’s Buy and ~20% upside, and with Strong Buy ratings and mid-30% implied upside on Alphabet and Amazon. Those gaps often reflect narrative debates about AI CapEx, competitive positioning, and multiple re-rating more than a mechanical PEG ranking. Treat targets as one more input that can falsify complacency—especially when a low-PEG name carries muted Street enthusiasm, or a high-CapEx name still carries aggressive upside.
Turning Valuation Screens into a Watchlist Process
From spreadsheet to repeatable workflow
Most investors who “use PEG” actually glance at a single column once and move on. A durable process turns the screen into a watchlist with rules: define the universe (for example, U.S. large-cap software and platforms), lock the growth-rate source for PEG, require FCF yield or P/FCF alongside PEG, and write down what would knock a name off the list—estimate cuts, CapEx spikes that crush FCF, or peer-relative PEG expansion without fundamental improvement. Revisit the list on a schedule rather than whenever a headline appears. That is how PEG ratio versus P/E analysis becomes a habit instead of a one-off blog chart.
If you want that habit encoded in software rather than sticky notes, Alphio’s Scheduled Task can run recurring valuation and price checks so the Adobe-versus-Intuit-versus-hyperscaler comparison does not depend on memory. Pair scheduled reviews with Conversational Trading when you need to interrogate the book—“show forward P/E and PEG peers for ADBE and INTU,” “flag names where FCF yield collapsed while PEG still looks cheap”—without rebuilding the worksheet every Sunday night.

Automate valuation watchlist checks with Scheduled Task

Ask valuation questions with Conversational Trading
Budget caps when screens become trades
Screens create temptation. A PEG of 0.69 on Adobe or a beaten-down Intuit chart can invite oversized bets that ignore portfolio concentration. If you also follow strategies through Copy Trade or run Autonomous Trading agents, valuation conviction must still sit inside budget caps and stop rules. An agent that scales into every sub-1.0 PEG name without a cash-flow filter will happily buy “cheap growth” that is actually CapEx-constrained. Encode the same checklist you use manually—PEG plus FCF yield plus peer band—before automation is allowed to increase risk.

Set copy-trade budget caps on Alphio
Conclusion
PEG ratio versus P/E is not a contest with one winner. P/E tells you what you pay for a dollar of earnings; PEG asks whether that price looks sane relative to expected growth; free cash flow asks whether those earnings ever become cash you can own. In late October 2026, with the S&P 500 forward P/E near 18.7, Adobe’s StockAnalysis PEG of 0.69 and double-digit FCF yield sit in a different economic universe from Alphabet’s PEG of 1.78 with 1.37% FCF yield or Amazon’s PEG of 1.29 with negative free cash flow. Intuit’s PEG near 1.14 after a deep fifty-two-week drawdown shows that “fair” on PEG can still be a reset story rather than a momentum story. Heuristics that celebrate PEG below 1 or worry above 2 remain useful teaching tools—so long as you remember they are heuristics, growth estimates vary by source, and CapEx can falsify an earnings-only screen.
Build the checklist, lock your data sources, peer-compare inside the industry, and schedule the review. When you are ready to operationalize that discipline, use Alphio’s Scheduled Task for recurring valuation checks, Conversational Trading to stress-test PEG versus FCF questions in plain language, and keep any Copy Trade or Autonomous Trading sleeves inside hard budget caps so a pretty PEG cannot quietly rewrite your risk.
This article is for educational purposes only and is not investment advice. Verify live prices, estimates, and filings before making decisions.
FAQs
What is the difference between PEG ratio and P/E?
P/E divides price by earnings and says how much you pay for a dollar of EPS. PEG divides that P/E by expected EPS growth to ask whether the multiple looks reasonable relative to growth. PEG adds growth context; it does not replace cash-flow or balance-sheet analysis.
What is a good PEG ratio for stocks?
Educational sources often frame PEG below 1 as potentially inexpensive versus growth and PEG above 2 as rich, but those cutoffs are heuristics, not rules. Always peer-compare within an industry and confirm the growth-rate source, because different vendors can print very different PEG figures for the same ticker.
Why can Adobe show different PEG ratios on different sites?
PEG depends on which earnings multiple and which expected growth rate a data vendor uses. StockAnalysis showed Adobe PEG near 0.69 in late October 2026, while Yahoo or Zacks feeds sometimes print readings roughly between 0.77 and 1.80. Compare methodology before treating any single PEG as definitive.
Can a stock look cheap on PEG but expensive on free cash flow?
Yes. Alphabet’s late-October 2026 profile—trailing P/E near 15.90 and PEG near 1.78 alongside FCF yield of only about 1.37% after heavy CapEx—shows how earnings-based screens can look acceptable while owner cash yield is scarce. Amazon’s PEG near 1.29 with negative free cash flow is an even sharper version of the same lesson.
Should investors use PEG for every stock?
No. PEG works best for growth companies with credible forecasts. It is weak for mature low-growth firms, for names where CapEx dominates economics, and whenever growth estimates are unreliable. Pair PEG with forward P/E, FCF yield, EV/EBITDA, and peer context rather than using it alone.
Related articles
- Stock Market Surges After 2026 Midterms: What the Democratic Sweep Means for Your PortfolioThe stock market rallied after Democrats won the 2026 midterms. Discover what the election means for investors, tech stocks, and the S&P 500 outlook.
- Stock Market Surges After 2026 Midterms: What the Democratic Sweep Means for Your PortfolioThe stock market rallied after Democrats won the 2026 midterms. Discover what the election means for investors, tech stocks, and the S&P 500 outlook.
- Oil Prices Surge Above $105 Amid US-Iran Conflict: Energy Investment Opportunities in November 2026Oil prices climb past $105 as US strikes Iran's Qeshm Island. Discover energy investment opportunities, top oil stocks, and market outlook for November 2026.
- Oil Prices Surge Past $90: How to Position Your Portfolio for the 2026 Energy RallyOil prices hit $85-91/barrel amid Strait of Hormuz tensions. Discover top energy stocks like XOM and CVX, plus investment strategies for the 2026 oil rally.
- Fed Interest Rate Policy and Stock Market Outlook: Navigating August 2026's Uncertain WatersAnalysis of Federal Reserve interest rate policy, inflation trends, oil price impacts, and investment strategies for August 2026. Expert insights on market outlook.
- Rising Oil Prices and Stock Market Impact: August 2026 Investor GuideOil prices near $89/barrel amid Iran tensions are pressuring stocks. Learn how the Hormuz crisis impacts markets, sectors to watch, and investment strategies for August 2026.