




Genius Group Ltd

Análisis de la acción Genius Group Ltd (GNS)

$0.102

-0.001 (-1.17%)Al cierre

Loading chart…
Máximo
0.113
Apertura
0.113
Precio medio ponderado por volumen
0.10
Volumen
4.38M
Capitalización
53.81M
Mínimo
0.094
Importe
450.37K
EV/EBITDA, TTM
-0.94

Genius Group Limited is an artificial intelligence (AI)-powered Bitcoin-first education group. The Company delivers AI powered, education and acceleration solutions. The Company’s Genius City education model delivers local AI-based ecosystems between schools, businesses and government, delivering both AI training and AI tools. Its AI edtech platform, GeniusU, connects Genius Cities to student and its partner marketplace joining peer intelligence and AI solutions across energy, finance, logistics, manufacture, retail, tech and telco sectors. The Company provides personalized, entrepreneurial AI pathways combining human talent with AI skills and AI solutions at the individual, enterprise and government level. Its courses include iLAB Mentor, PromINence Online, Remote Work Startup, Speaker Sales Plan, Cash Flow Design and Build, Crypto Investor Microschool, Crypto Investor Microcourse, Passion Test Consultant, Real Estate Mogul Master Plan, and InSight-U Coaching Programme, others.

Análisis de IA of Genius Group Ltd (GNS)

Vender

Genius Group Ltd is not a good buy right now due to its significant recent losses and weak technical indicators. The current price is $0.10, which is a steep decline of 83.38% year-to-date. The RSI is at a very low 18.465, indicating oversold conditions but also suggesting a lack of buying momentum. The forward P/E ratio is 1.025, which may seem attractive, but the company has consistently reported net losses, with a net income of -$19,896.79 in Q2 2026. The main risk is the declining revenue trend, with a 5-day change of -15.56% and a 20-day change of -31.92%, indicating ongoing bearish sentiment.

Métricas de valoración

El PER previsto actual de Genius Group Ltd (GNS) es 1.02, frente a su media de 5 años de 92.45.

PER previsto

Valor razonable
Media 5A P/E
92.45
P/E actual
1.02
Sobrevalorada
551.76
Infravalorada
-366.85

EV/EBITDA previsto

Valor razonable
Media 5A EV/EBITDA
20.97
EV/EBITDA actual
-0.94
Sobrevalorada
101.08
Infravalorada
-59.14

Precio/ventas previsto

Valor razonable
Media 5A P/S
1.64
P/S actual
0.76
Sobrevalorada
3.39
Infravalorada
-0.11

Cronología de eventos

2026-11-05 (ET)

10:30:00

FingerMotion Signs Second Agreement with Genius Group

2026-10-27 (ET)

09:30:00

Genius Group and FingerMotion Sign Agreement to Build GENIUSpark Alberta

2026-10-20 (ET)

09:30:00

Genius Group Reports Q3 Revenue of $4.1M

2026-10-06 (ET)

09:30:00

Genius Group Resumes Bitcoin Purchases, Spending Approximately $854,000

2026-09-30 (ET)

09:01:00

Genius Group Lawsuit Against Defendants Upheld by Court, Seeks Nearly $1B in Damages

Noticias

Preguntas frecuentes sobre GNS, respondidas por Alphio AI

Genius Group Limited is an artificial intelligence (AI)-powered Bitcoin-first education group. The Company delivers AI powered, education and acceleration solutions. The Company’s Genius City education model delivers local AI-based ecosystems between schools, businesses and government, delivering both AI training and AI tools. Its AI edtech platform, GeniusU, connects Genius Cities to student and its partner marketplace joining peer intelligence and AI solutions across energy, finance, logistics, manufacture, retail, tech and telco sectors. The Company provides personalized, entrepreneurial AI pathways combining human talent with AI skills and AI solutions at the individual, enterprise and government level. Its courses include iLAB Mentor, PromINence Online, Remote Work Startup, Speaker Sales Plan, Cash Flow Design and Build, Crypto Investor Microschool, Crypto Investor Microcourse, Passion Test Consultant, Real Estate Mogul Master Plan, and InSight-U Coaching Programme, others. It operates in the Academic & Educational Services sector (PREPACKAGED SOFTWARE industry).

Genius Group Ltd is not a good buy right now due to its significant recent losses and weak technical indicators. The current price is $0.10, which is a steep decline of 83.38% year-to-date. The RSI is at a very low 18.465, indicating oversold conditions but also suggesting a lack of buying momentum. The forward P/E ratio is 1.025, which may seem attractive, but the company has consistently reported net losses, with a net income of -$19,896.79 in Q2 2026. The main risk is the declining revenue trend, with a 5-day change of -15.56% and a 20-day change of -31.92%, indicating ongoing bearish sentiment.

Comunidad

Más ↗
velvetswell14/10/2026

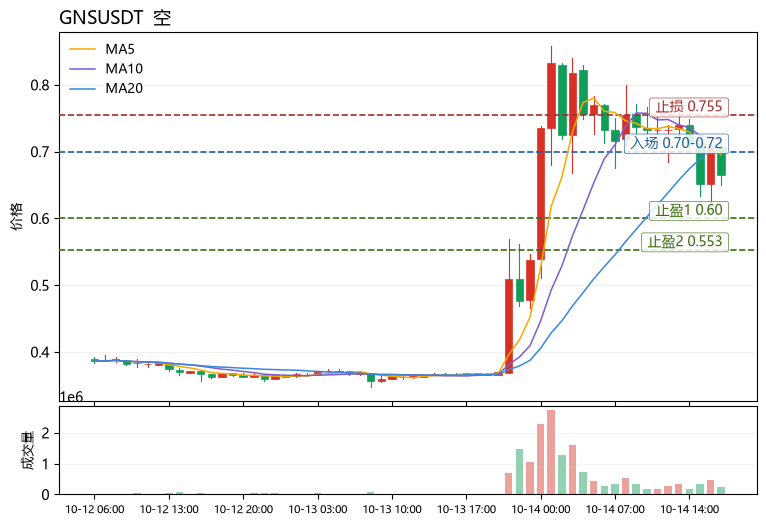
$GNS Conclusion first: the funding rate is severely diverging from price. Longs are crowded but there is little spot demand to absorb them, so the short-term bias is bearish, mainly selling into rebounds. $GNS is at 0.665, up 80.71% in 24h, but the contract funding side is already flashing red. The funding rate remains positive (longs pay), which shows long-chasing sentiment is overheated, while price is still below MA5=0.695 and MA20=0.713, and the bearish moving-average alignment is unchanged; the MACD histogram at -0.019 is still negative, RSI 53.1 is neutral-to-weak, and the volume-price divergence is obvious. 24h turnover is only 11.1M USDT, and under thin liquidity the 30-candle range is as high as 74.74%, making sharp wicks up and down and cascading liquidations very easy. The greed index is 62, market sentiment is hot, and this is often a window where longs get harvested. The Bollinger Bands [0.553, 0.873] are extremely wide, price is near the lower side of the middle band, and a rebound into the 0.70-0.72 area is an ideal short entry zone: that area is also capped by MA5/MA20 and is an earlier dense trading trapped zone. Take-profit 1 is 0.60 (above the lower Bollinger Band plus short-term support), take-profit 2 is 0.553 (lower Bollinger Band), and stop-loss is 0.755 (if price breaks above MA20 and holds, the short thesis is invalidated). Also watch during the same period: weakness, RSI 34 near oversold, $ZK in a narrow range with unclear direction, and neither has the same intensity of capital battle as GNS. [Data] Pair: GNSUSDT Direction: Short Entry: 0.70-0.72 Take-profit 1: 0.60 Take-profit 2: 0.553 Stop-loss: 0.755 (Personal view only, for reference only, and not any investment advice. Contract risk is extremely high, please strictly control position size.)

Mostrar más

FoxKettle14/10/2026

GM GM, respect to everyone who bought the dip on $GNS at $0.4. Getting ready to touch $1 next 🔥 Meanwhile, AMP is getting ready for $0.001. How long do you think this will take? What's your prediction? GNSPriceAnalyisis

Mostrar más
rektcitadel4614/10/2026

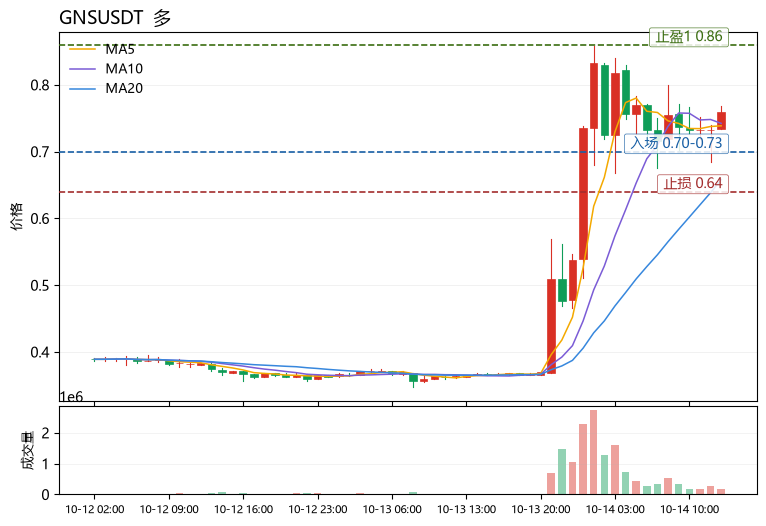
$GNS is at 0.76, up 108.22% in 24h, with 10.1M USDT in volume, and the Fear & Greed Index at 62, in greed territory. After doubling in a single day, MA5=0.7386 has crossed above MA20=0.658, forming a bullish moving average alignment, but the MACD histogram has turned negative (-0.004171), and price is approaching the upper Bollinger Band at 0.962158, suggesting short-term momentum is showing signs of fading. At the broader market level, under greedy sentiment, funds favor high-volatility small-cap names. GNS is a typical sentiment-driven rally. If BTC remains strong, the pullback depth may be limited; once the broader market weakens, the retracement in coins that have doubled can expand significantly. Directionally, I lean toward buying on a pullback rather than chasing the high. Entry reference is the 0.70–0.73 range, which is close to MA5 support and is the first pullback confirmation zone after the breakout; TP1 is 0.86, corresponding to prior high resistance below the upper Bollinger Band; TP2 is 0.95, near the extreme position of the upper Bollinger Band at 0.962158; stop loss is set at 0.64, as falling below the platform above MA20 would mean the structure of this rally has broken down. RSI=66.8 has not yet entered overbought extremes, and with the Fear & Greed Index at 62, sentiment still supports one more push higher, but the bearish MACD histogram requires keeping position size light. Also watching: $ZE, $RLC. Among them, $ZEC has bullish moving averages and RSI 59.8, relatively stronger, while $RLC has already fallen below MA5 and RSI is only 39.9, clearly weaker than $GNS. (Personal view, for reference only, and not any investment advice. Futures risk is extremely high, please strictly control position size.) [Data] Pair: GNSUSDT Direction: Long Entry: 0.70-0.73 TP1: 0.86 TP2: 0.95 Stop Loss: 0.64

Mostrar más
leadenraptor7814/10/2026

$BTC $OP Wake up, BTC is grinding at 84K. Yili Hua says 81K is an iron floor at the 400-day moving average — every touch bounces; 84K is the 20-day resistance, and a break above it points straight to 86.5K. The bigger cycle is still a bull pullback, with the super bull market expected next year. But the real story is the data: exchange BTC dropped from 2.8M in February to 2.67M, while cold wallets quietly accumulate. The U.S. Treasury doubled buybacks in August, the dollar weakens, and the debasement trade is back — Bitcoin eats this old script. Supply shrinks, and if demand improves even slightly, the supply-demand imbalance becomes rocket fuel. 🔥 By the way, what's the story with $GNS? It ripped 100 points straight. That little dog on Ethereum also looks tasty — worth watching. 🐾 Friends, have you gotten into GNS yet? Tell me in the comments. #BitcoinBreaks84K #BitcoinDominanceBackTo60% #BitcoinReboundsAbove83K

Mostrar más
patienttotem5713/10/2026

$BTC is still consolidating near 84K. Yili Hua points to key levels: 81K is strong support at the 400-day moving average, with quick bounces on each touch; 84K is resistance at the 20-day moving average, and a breakout would test 86.5K. On the larger cycle, this still looks like a phased correction within a bull market, with the real super bull market perhaps next year. But one data point is more noteworthy: exchange BTC reserves have dropped from 2.8 million in February to 2.67 million, with cold wallets accumulating. After peaking at 126K in October 2025, most of this year has been a bear market below 65K. In August, the U.S. Treasury doubled liquidity buybacks, the dollar weakened, and the "debasement trade" heated up again — Bitcoin is benefiting, just like the historical script. Supply is shrinking, and if demand continues to improve, the supply-demand imbalance becomes upside fuel. #比特币市占率回升至60% By the way, what's the story behind this $GNS? It pumped 100 points straight. Anyone who knows, drop a comment. 🐾🔥 #比特币突破8.4万美元 This little dog on Ethereum also looks decent, worth watching (GNSUSDT) (BTCUSDT)

Mostrar más
Regístrate o inicia sesión para participar

Artículos relacionados

Esta página es solo para investigación y no constituye asesoramiento de inversión. Los modelos pueden equivocarse. El rendimiento pasado no garantiza resultados futuros.

Empezar a operar