
B
Bull
Bull · 25%FLUX
$1.80
Scenario price
$0.317
+0.006 (+1.83%)At close
Flux Power Holdings, Inc. designs, manufactures, and sells lithium-ion energy storage solutions for electrification of a range of industrial and commercial sectors including material handling, airport ground support equipment (GSE), and stationary energy storage. The Company’s lithium-ion battery packs, including the proprietary battery management system (BMS) and telemetry, provide customer ownership, and an environmentally friendly alternative, in many instances, to traditional lead acid and propane-based solutions. Its battery technology is designed with the flexibility to meet the energy requirements of diverse industries and applications, such as material handling vehicles and ground support equipment. Its batteries are designed with modular components which facilitate design flexibility that is adaptable to various applications. It also offers energy management solutions, which include real-time fleet monitoring and a customizable dashboard and reporting.
Flux Power Holdings Inc is not a good buy right now due to its current price of $0.3167 and a very low RSI of 21.583, indicating oversold conditions. The company has seen a staggering year-to-date change of -77.70% and a 52-week high of $2.48, which highlights significant volatility and risk. Additionally, the forward P/E ratio is 28.8184, suggesting that the stock is overvalued relative to its earnings potential, especially given the recent revenue decline and negative earnings reports. The main risk is the company's declining gross margin, which was reported at 27.36% in the last quarter, down from 34.49% a year ago, reflecting increased costs and competition. Overall, the financial instability and negative trends make this a risky investment at this time.
Scenario prices are the last monthly forecast band of the current year. Probabilities are fixed model weights (25 / 50 / 25), not guarantees.

Flux Power to Report Q1 2027 Results on November 3

Solidion Refuses to Raise Acquisition Bid for Flux Power

Solidion Refuses to Raise Acquisition Offer for Flux Power

Solidion Refuses to Raise Acquisition Offer for Flux Power

Solidion Refuses to Raise Acquisition Offer for Flux Power
Flux Power Holdings, Inc. designs, manufactures, and sells lithium-ion energy storage solutions for electrification of a range of industrial and commercial sectors including material handling, airport ground support equipment (GSE), and stationary energy storage. The Company’s lithium-ion battery packs, including the proprietary battery management system (BMS) and telemetry, provide customer ownership, and an environmentally friendly alternative, in many instances, to traditional lead acid and propane-based solutions. Its battery technology is designed with the flexibility to meet the energy requirements of diverse industries and applications, such as material handling vehicles and ground support equipment. Its batteries are designed with modular components which facilitate design flexibility that is adaptable to various applications. It also offers energy management solutions, which include real-time fleet monitoring and a customizable dashboard and reporting. It operates in the Industrials sector (MISCELLANEOUS ELECTRICAL MACHINERY, EQUIPMENT & SU industry).
Flux Power Holdings Inc is not a good buy right now due to its current price of $0.3167 and a very low RSI of 21.583, indicating oversold conditions. The company has seen a staggering year-to-date change of -77.70% and a 52-week high of $2.48, which highlights significant volatility and risk. Additionally, the forward P/E ratio is 28.8184, suggesting that the stock is overvalued relative to its earnings potential, especially given the recent revenue decline and negative earnings reports. The main risk is the company's declining gross margin, which was reported at 27.36% in the last quarter, down from 34.49% a year ago, reflecting increased costs and competition. Overall, the financial instability and negative trends make this a risky investment at this time.

$FLUX FLUXUSDT is forming a bullish pattern on the 1-hour timeframe. Price has been moving along a descending channel on the 1-hour timeframe. Price has reached the lower boundary and is now looking to bounce, suggesting a possible upward move on a retest of this level. The Relative Strength Index (RSI) shows a downward trend; however, given that price has reached "oversold" levels on the 1-hour chart, a bullish breakout is more likely. The orange trendline further supports the possibility of a bullish bounce. There is an initial support level at 0.0676, which can serve as an initial support zone. There is a key support zone at 0.0640 (marked in green); price has bounced from this zone multiple times, making it a strong support level. Price is moving toward the 100-period moving average — we are currently approaching this level, which further strengthens the possibility of an upward move. Entry price: 0.0720. Target 1: 0.0750. Target 2: 0.0750. Target 3: 0.0768. Stop loss: the green support zone. Remember this simple rule: money management. Thank you.
Show more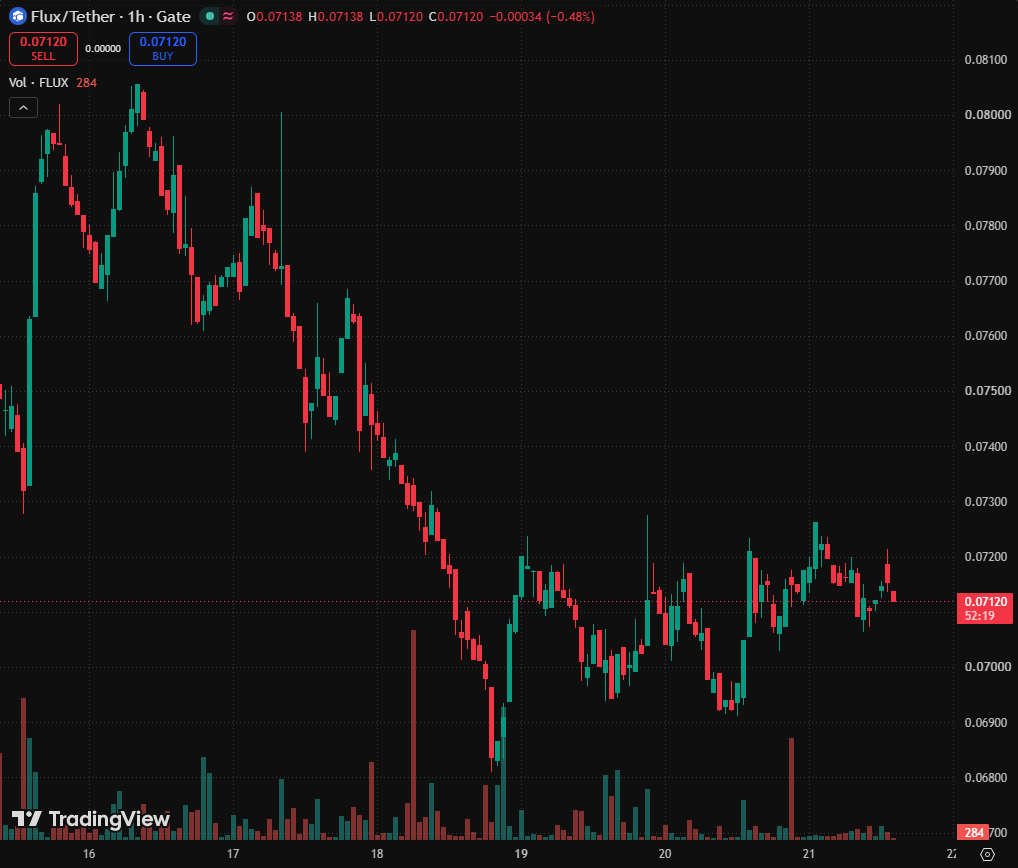
This page is for research only and is not investment advice. Models can be wrong. Past performance does not guarantee future results.