
D
Duquesne Family Office LLC
+ を保有Q
+9.50%
3か月リターン
$109.830
+1.065 (+0.97%)終値時点
Qnity Electronics, Inc. is engaged in providing materials and solutions for semiconductor and electronics industries. The Company has two business segments, namely Semiconductor Technologies and Interconnect Solutions. The Semiconductor Technologies segment provides a portfolio of materials and solutions utilized across multiple stages of the semiconductor manufacturing process. These materials are integrated into customers' roadmaps and are intended to support improvements in chip performance, production yield, and the implementation of advanced node technologies. The Interconnect Solutions segment offers a comprehensive range of material solutions that address the complexities of signal integrity, thermal and power management, and advanced packaging. These solutions are used in advanced electronics hardware applications, including complex printed circuit boards and advanced semiconductor packaging.
Currently, Qnity Electronics Inc is not a strong buy due to its low RSI of 25.369, indicating oversold conditions, and a current price of $109.83, which is significantly below the analyst price target range of $160 to $211. However, the stock has shown a year-to-date change of +29.24%, suggesting potential for recovery. The main risk is the recent 5-day change of -4.80%, indicating short-term volatility.
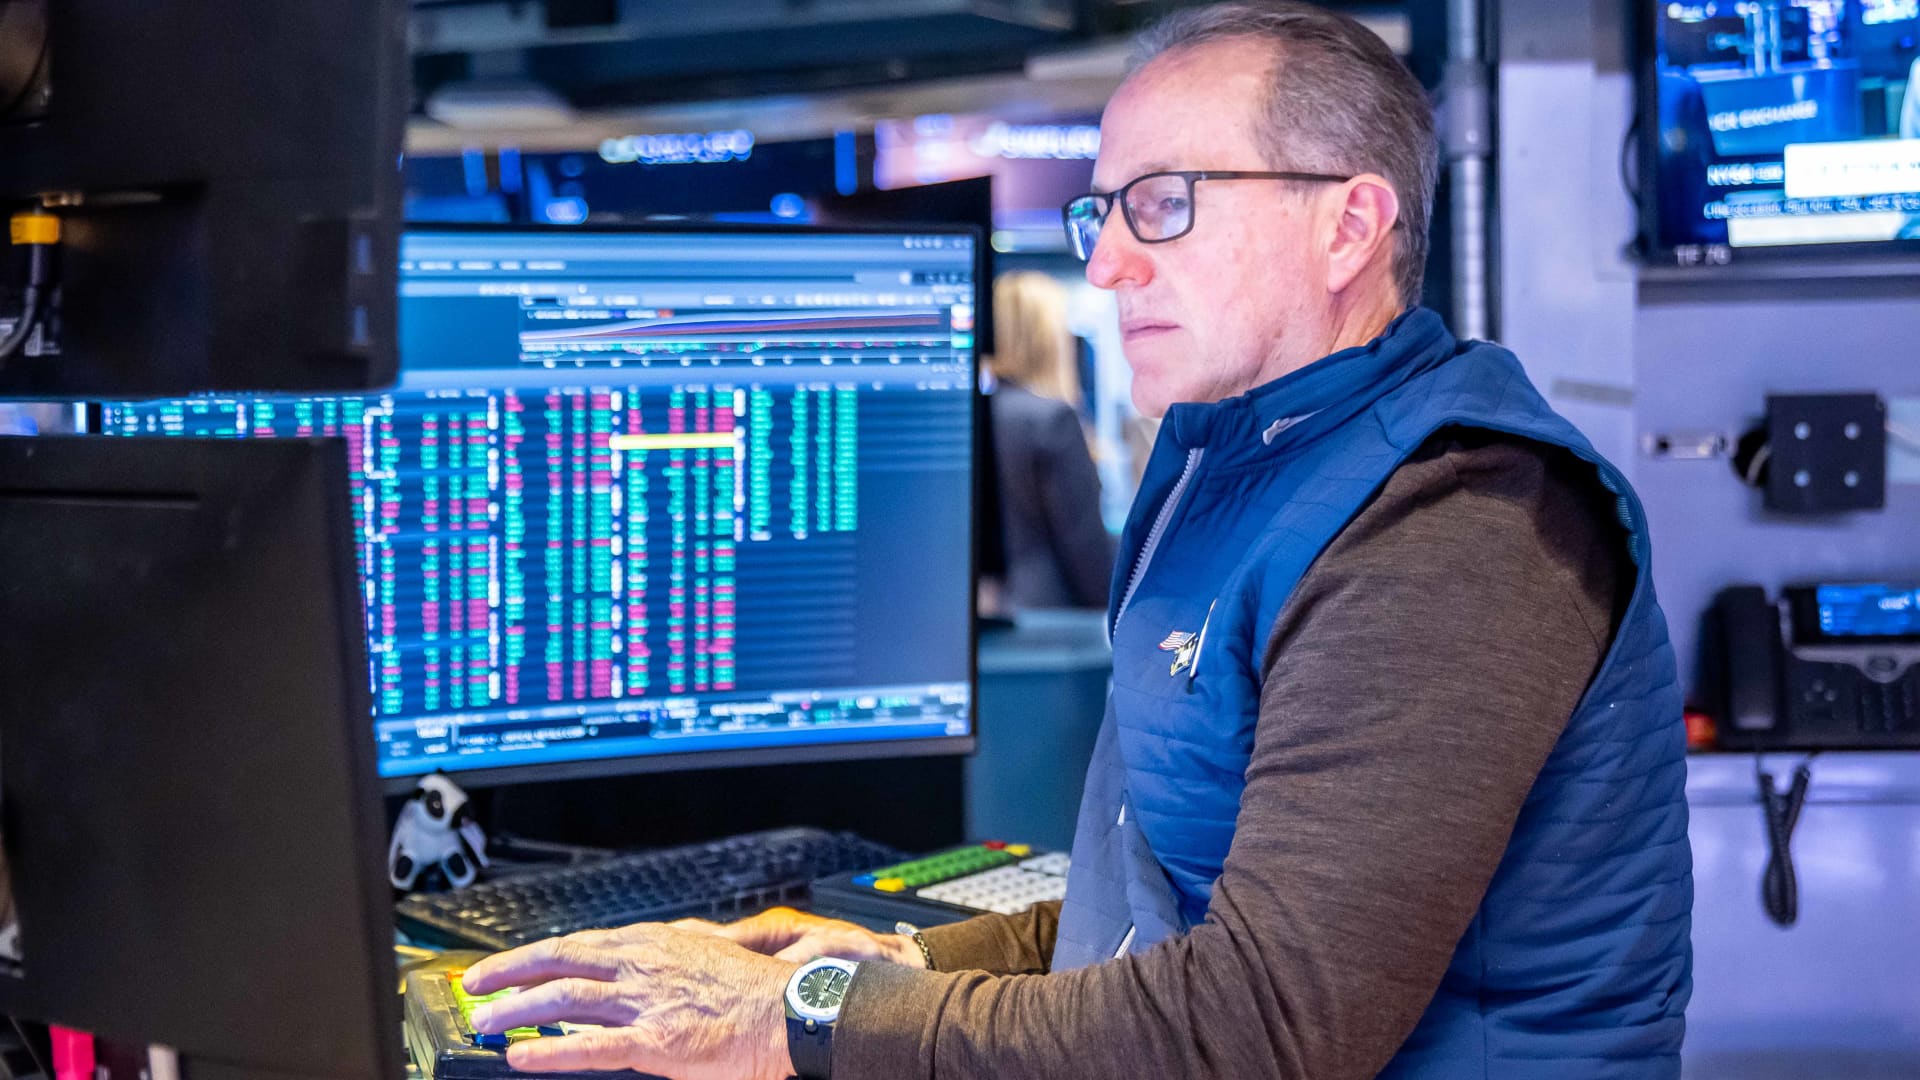
Wall Street Volatility Driven by AI Financing Concerns
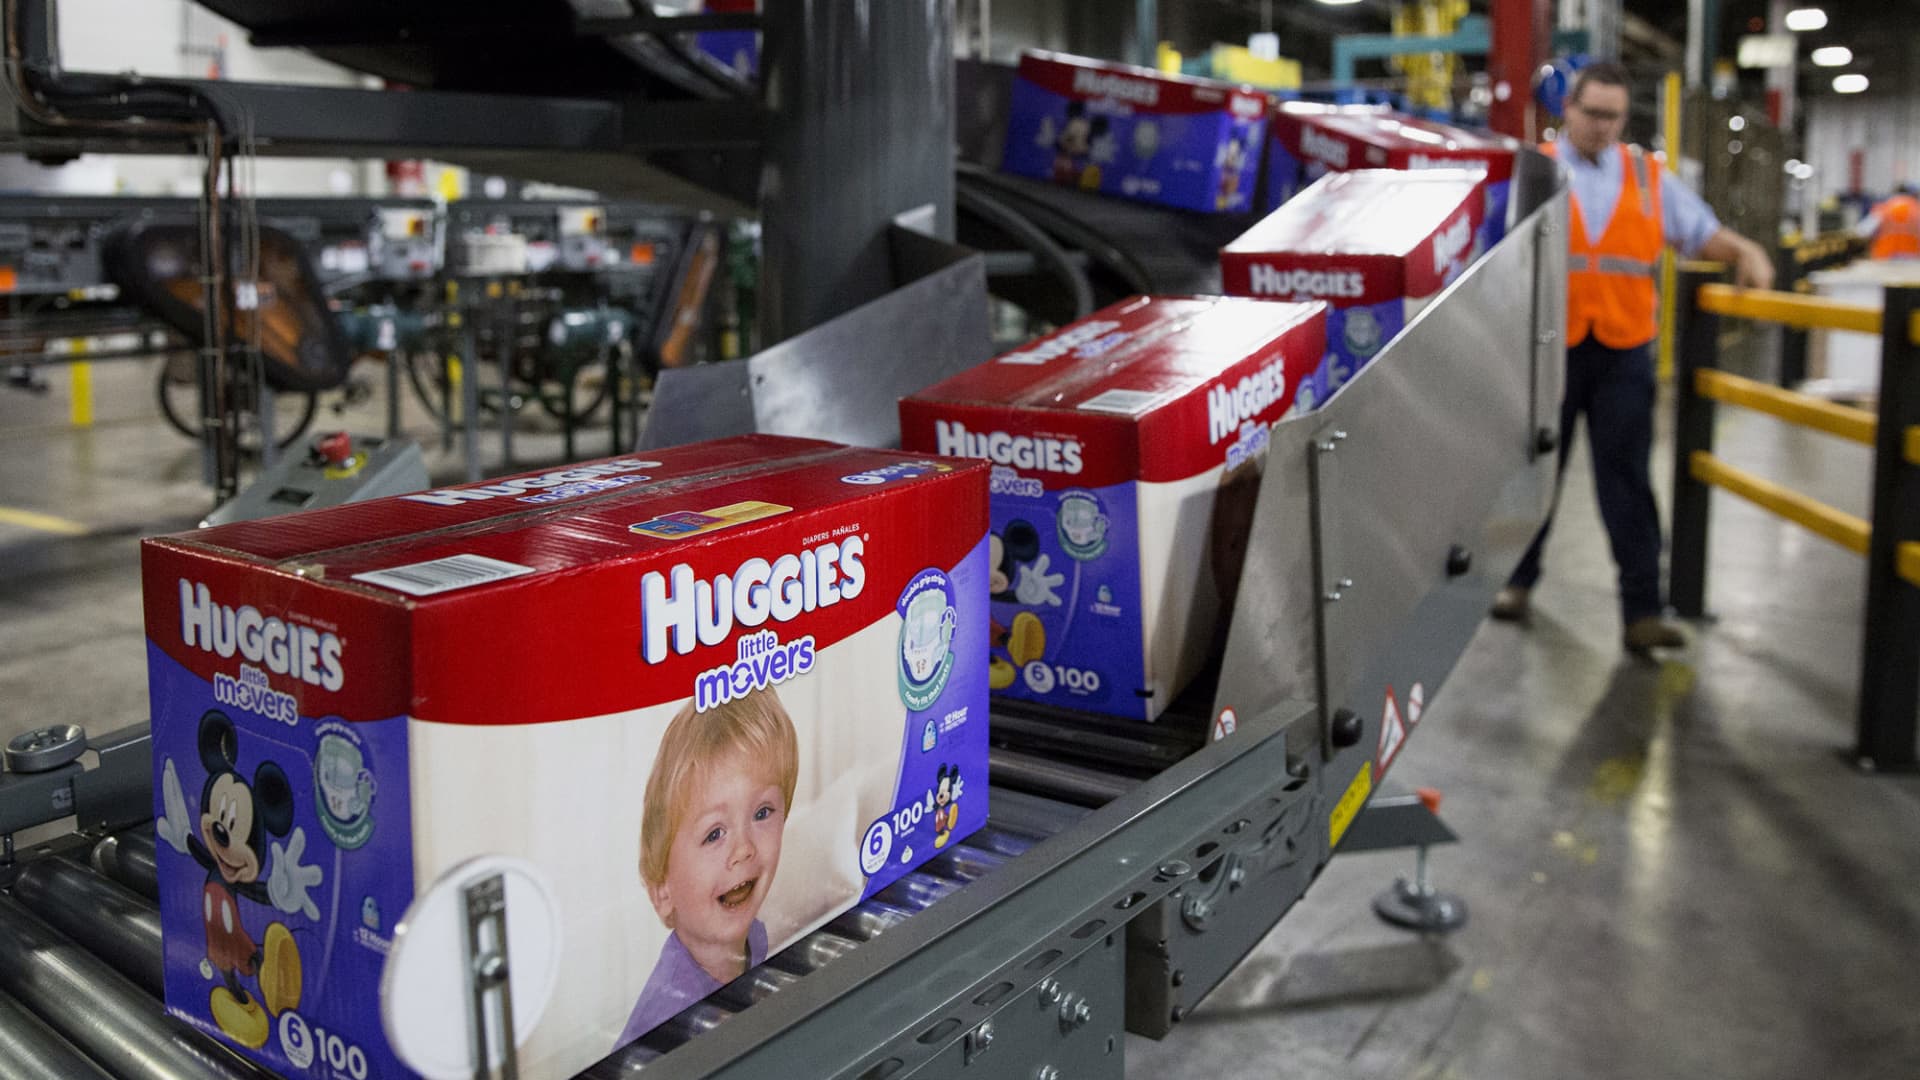
AI Trade Volatility Intensifies Amid Market Shifts

Market Update: Tech Stocks Decline Amid Earnings Reports

Tech Stocks Rebound Drives Market Higher

U.S. Stocks Rise as Apple Expands Partnership
Qnity Electronics, Inc. is engaged in providing materials and solutions for semiconductor and electronics industries. The Company has two business segments, namely Semiconductor Technologies and Interconnect Solutions. The Semiconductor Technologies segment provides a portfolio of materials and solutions utilized across multiple stages of the semiconductor manufacturing process. These materials are integrated into customers' roadmaps and are intended to support improvements in chip performance, production yield, and the implementation of advanced node technologies. The Interconnect Solutions segment offers a comprehensive range of material solutions that address the complexities of signal integrity, thermal and power management, and advanced packaging. These solutions are used in advanced electronics hardware applications, including complex printed circuit boards and advanced semiconductor packaging. It operates in the Technology sector.
Currently, Qnity Electronics Inc is not a strong buy due to its low RSI of 25.369, indicating oversold conditions, and a current price of $109.83, which is significantly below the analyst price target range of $160 to $211. However, the stock has shown a year-to-date change of +29.24%, suggesting potential for recovery. The main risk is the recent 5-day change of -4.80%, indicating short-term volatility.

$Q info signal Short entry: $0.057300 stop loss $0.06235 1. take profit: $0.03567 2. take profit: $0.02456 3. take profit: $0.01734 Hello, take profit as always, do your own research, okay..!!!!
もっと見る
$Q The downtrend is firmly aligned across 15m, 1H, and 4H, with lower highs and lower lows pointing to continued selling pressure. But RSI is deeply oversold and buyers still dominate taker volume, so watch for a confirmed breakdown before chasing the move. $Q Short setup. Entry: 0.06216 – 0.06247 TP: 0.05767 – 0.05361 – 0.04838 SL: 0.06654 DYOR AS WELL
もっと見る
$JCT will come down 100%. I was stuck in a $Q short for a week but kept holding and am now in profit. Similarly, I'm short on this because the market as a whole is bearish, and these kinds of coins will fall fast. If Bitcoin is bearish, these coins don't stand a chance.
もっと見る
$Q $ONDO $MAGMA There was a time I was honestly ready to give up on crypto completely. I had gone through enough losses to make me doubt myself, and it felt like no matter how hard I tried, nothing was working. Then I came across Alyssa Tan. I didn't rush into it at first, I took my time, watched from a distance, and read what people were saying about her before reaching out. When I finally did, I understood why so many people spoke highly of her. She was calm, patient, and took the time to guide me properly instead of just making empty promises. A few months under Alyssa's guidance completely changed my experience. I was able to make a profit of $57,490, and for me, that was more than just money, it was proof that I didn't give up too soon and that the right guidance really makes a difference. I'm genuinely grateful for how far I've come under her mentorship, and I'll always appreciate Alyssa for helping me turn things around.
もっと見る
🚨 Q/USDT IS BOUNCING BACK 🫣 BUT IS THE RECOVERY STRONG ENOUGH? Q has dropped 28.67% in 24 hours, but buyers have stepped in near $0.0686, pushing the price back to $0.0852. Rising volume and a recovering RSI suggest short-term buying momentum is returning, but the downtrend still needs confirmation before calling a reversal. 📈 Bullish scenario: Holding above $0.0686 and breaking toward $0.1019 could strengthen recovery. 📉 Bearish scenario: If the bounce loses momentum, Q could retest the $0.0686 support zone. 👀 Key levels to watch 🟢 Support: $0.0686116 🔴 Resistance: $0.1018617 💡 Trader takeaway: After a sharp fall, the first bounce can be tempting—but don’t confuse relief buying with a confirmed trend reversal. Watch how price reacts at resistance, and manage risk before entering. $Q $Q
もっと見る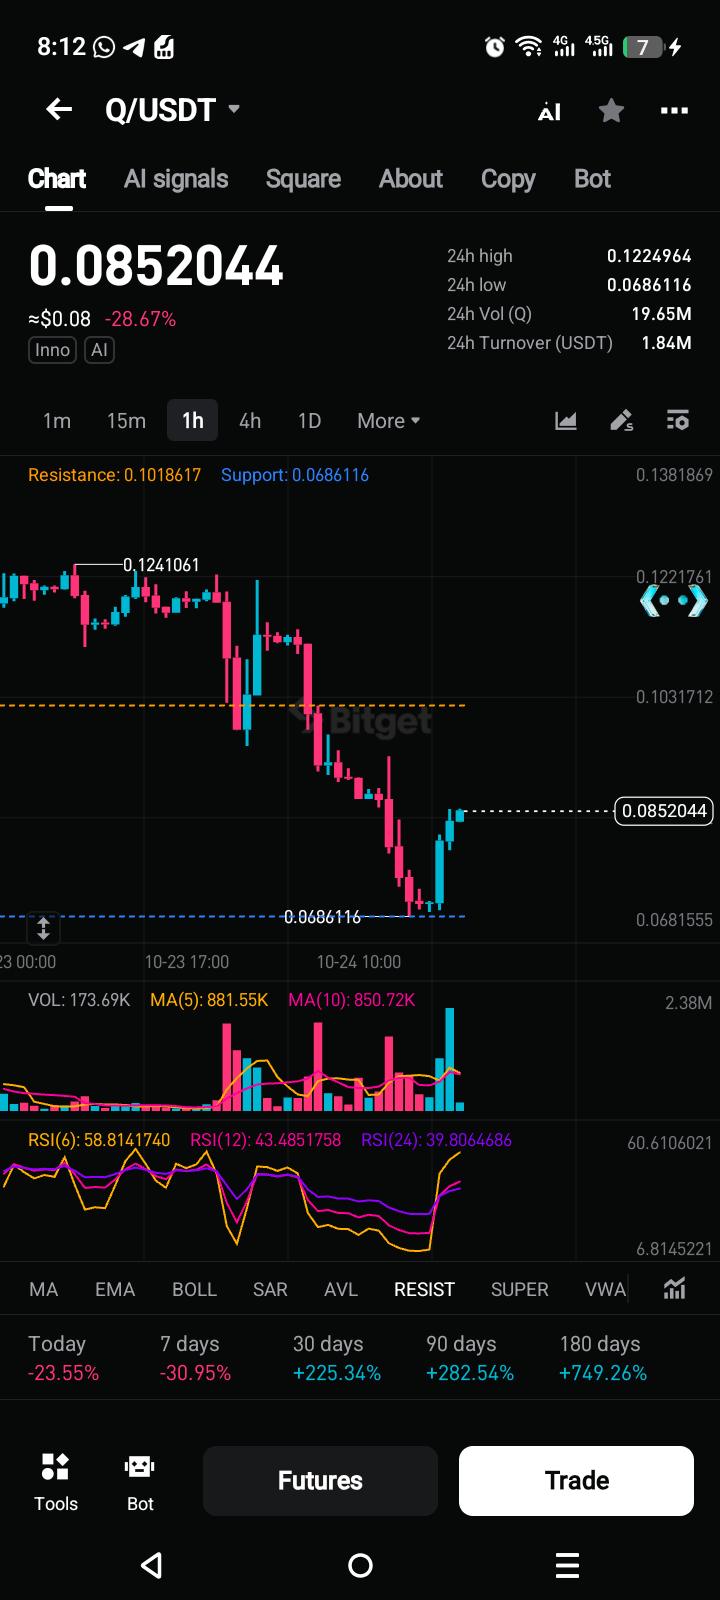
本ページは調査目的であり、投資助言ではありません。モデルは誤ることがあります。過去の実績は将来の成果を保証しません。