
強
強気
強気 · 25%ALAB
$191.54
シナリオ価格
$325.410
+1.302 (+0.40%)終値時点
Astera Labs, Inc. is a global semiconductor company. The Company provides semiconductor-based connectivity solutions for cloud and artificial intelligence (AI) infrastructure. It has developed and deployed its Intelligent Connectivity Platform built from the ground up for cloud and AI infrastructure. Its Intelligent Connectivity Platform provides its customers with the ability to deploy and operate high-performance cloud and AI infrastructure on a scale, addressing an increasingly diverse set of requirements. It provides its connectivity products in various form factors, including Integrated Circuits (ICs), boards, and modules. Its PCIe, CXL and Ethernet semiconductor-based connectivity solutions are purpose-built to unleash the potential of accelerated computing at cloud-scale. The Company's products include Aries products, Taurus products, Leo products and Scorpio products.
Astera Labs Inc is currently priced at $342.21, with a forward P/E of 55.56, indicating potential for growth despite its high valuation. The stock has shown a remarkable year-to-date change of +90.58%, reflecting strong momentum. However, the RSI is at 40.79, suggesting it is nearing oversold conditions, which could lead to a price correction. The main risk is the heavy customer concentration, with 86% of sales coming from just three clients, which could significantly impact revenue if relationships change.
シナリオ価格は本年の最終月次予想レンジです。確率はモデルの固定ウェイト(25 / 50 / 25)であり、保証ではありません。

Astera Labs Unveils Modular Orion Architecture for AI Infrastructure

Lumentum and Astera Labs Jointly Demonstrate AI Rack Architecture

Analysis of AI Accelerator Market Dynamics

Analysis of Investment Opportunities in AI Sector ETFs

Tech Stocks Volatility and Investment Outlook
Astera Labs, Inc. is a global semiconductor company. The Company provides semiconductor-based connectivity solutions for cloud and artificial intelligence (AI) infrastructure. It has developed and deployed its Intelligent Connectivity Platform built from the ground up for cloud and AI infrastructure. Its Intelligent Connectivity Platform provides its customers with the ability to deploy and operate high-performance cloud and AI infrastructure on a scale, addressing an increasingly diverse set of requirements. It provides its connectivity products in various form factors, including Integrated Circuits (ICs), boards, and modules. Its PCIe, CXL and Ethernet semiconductor-based connectivity solutions are purpose-built to unleash the potential of accelerated computing at cloud-scale. The Company's products include Aries products, Taurus products, Leo products and Scorpio products. It operates in the Technology sector (SEMICONDUCTORS AND RELATED DEVICES industry).
Astera Labs Inc is currently priced at $342.21, with a forward P/E of 55.56, indicating potential for growth despite its high valuation. The stock has shown a remarkable year-to-date change of +90.58%, reflecting strong momentum. However, the RSI is at 40.79, suggesting it is nearing oversold conditions, which could lead to a price correction. The main risk is the heavy customer concentration, with 86% of sales coming from just three clients, which could significantly impact revenue if relationships change.

What are we discussing today? Gate Square's trending topics have been updated! $BTC rebounded after falling back to $81,000, and its 24-hour decline has narrowed! Is this normal volatility and shakeout, or is the short-term trend starting to weaken? AI-related stocks broadly declined, with $ALAB down more than 9%, while $NVDA, $AMD, and $ARM all moved lower! Is AI valuation starting to cool down? $ZEC plunged more than 14% in a single day, while Grayscale ZCSH saw weekly net outflows exceeding $90 million! Can the privacy sector keep moving forward? Funding rates across CEX and DEX collectively turned negative, and shorts began paying funding fees to longs! Has market sentiment reached an extreme? Gate Money is now officially live, further connecting digital assets, fiat currency, stocks, ETFs, gold, bank accounts, and payments. Post trending topics, and high-quality content can receive traffic support and featured recommendations, and can also participate in content mining rewards. In a market with divided views, this is especially suitable for discussing different perspectives:
もっと見る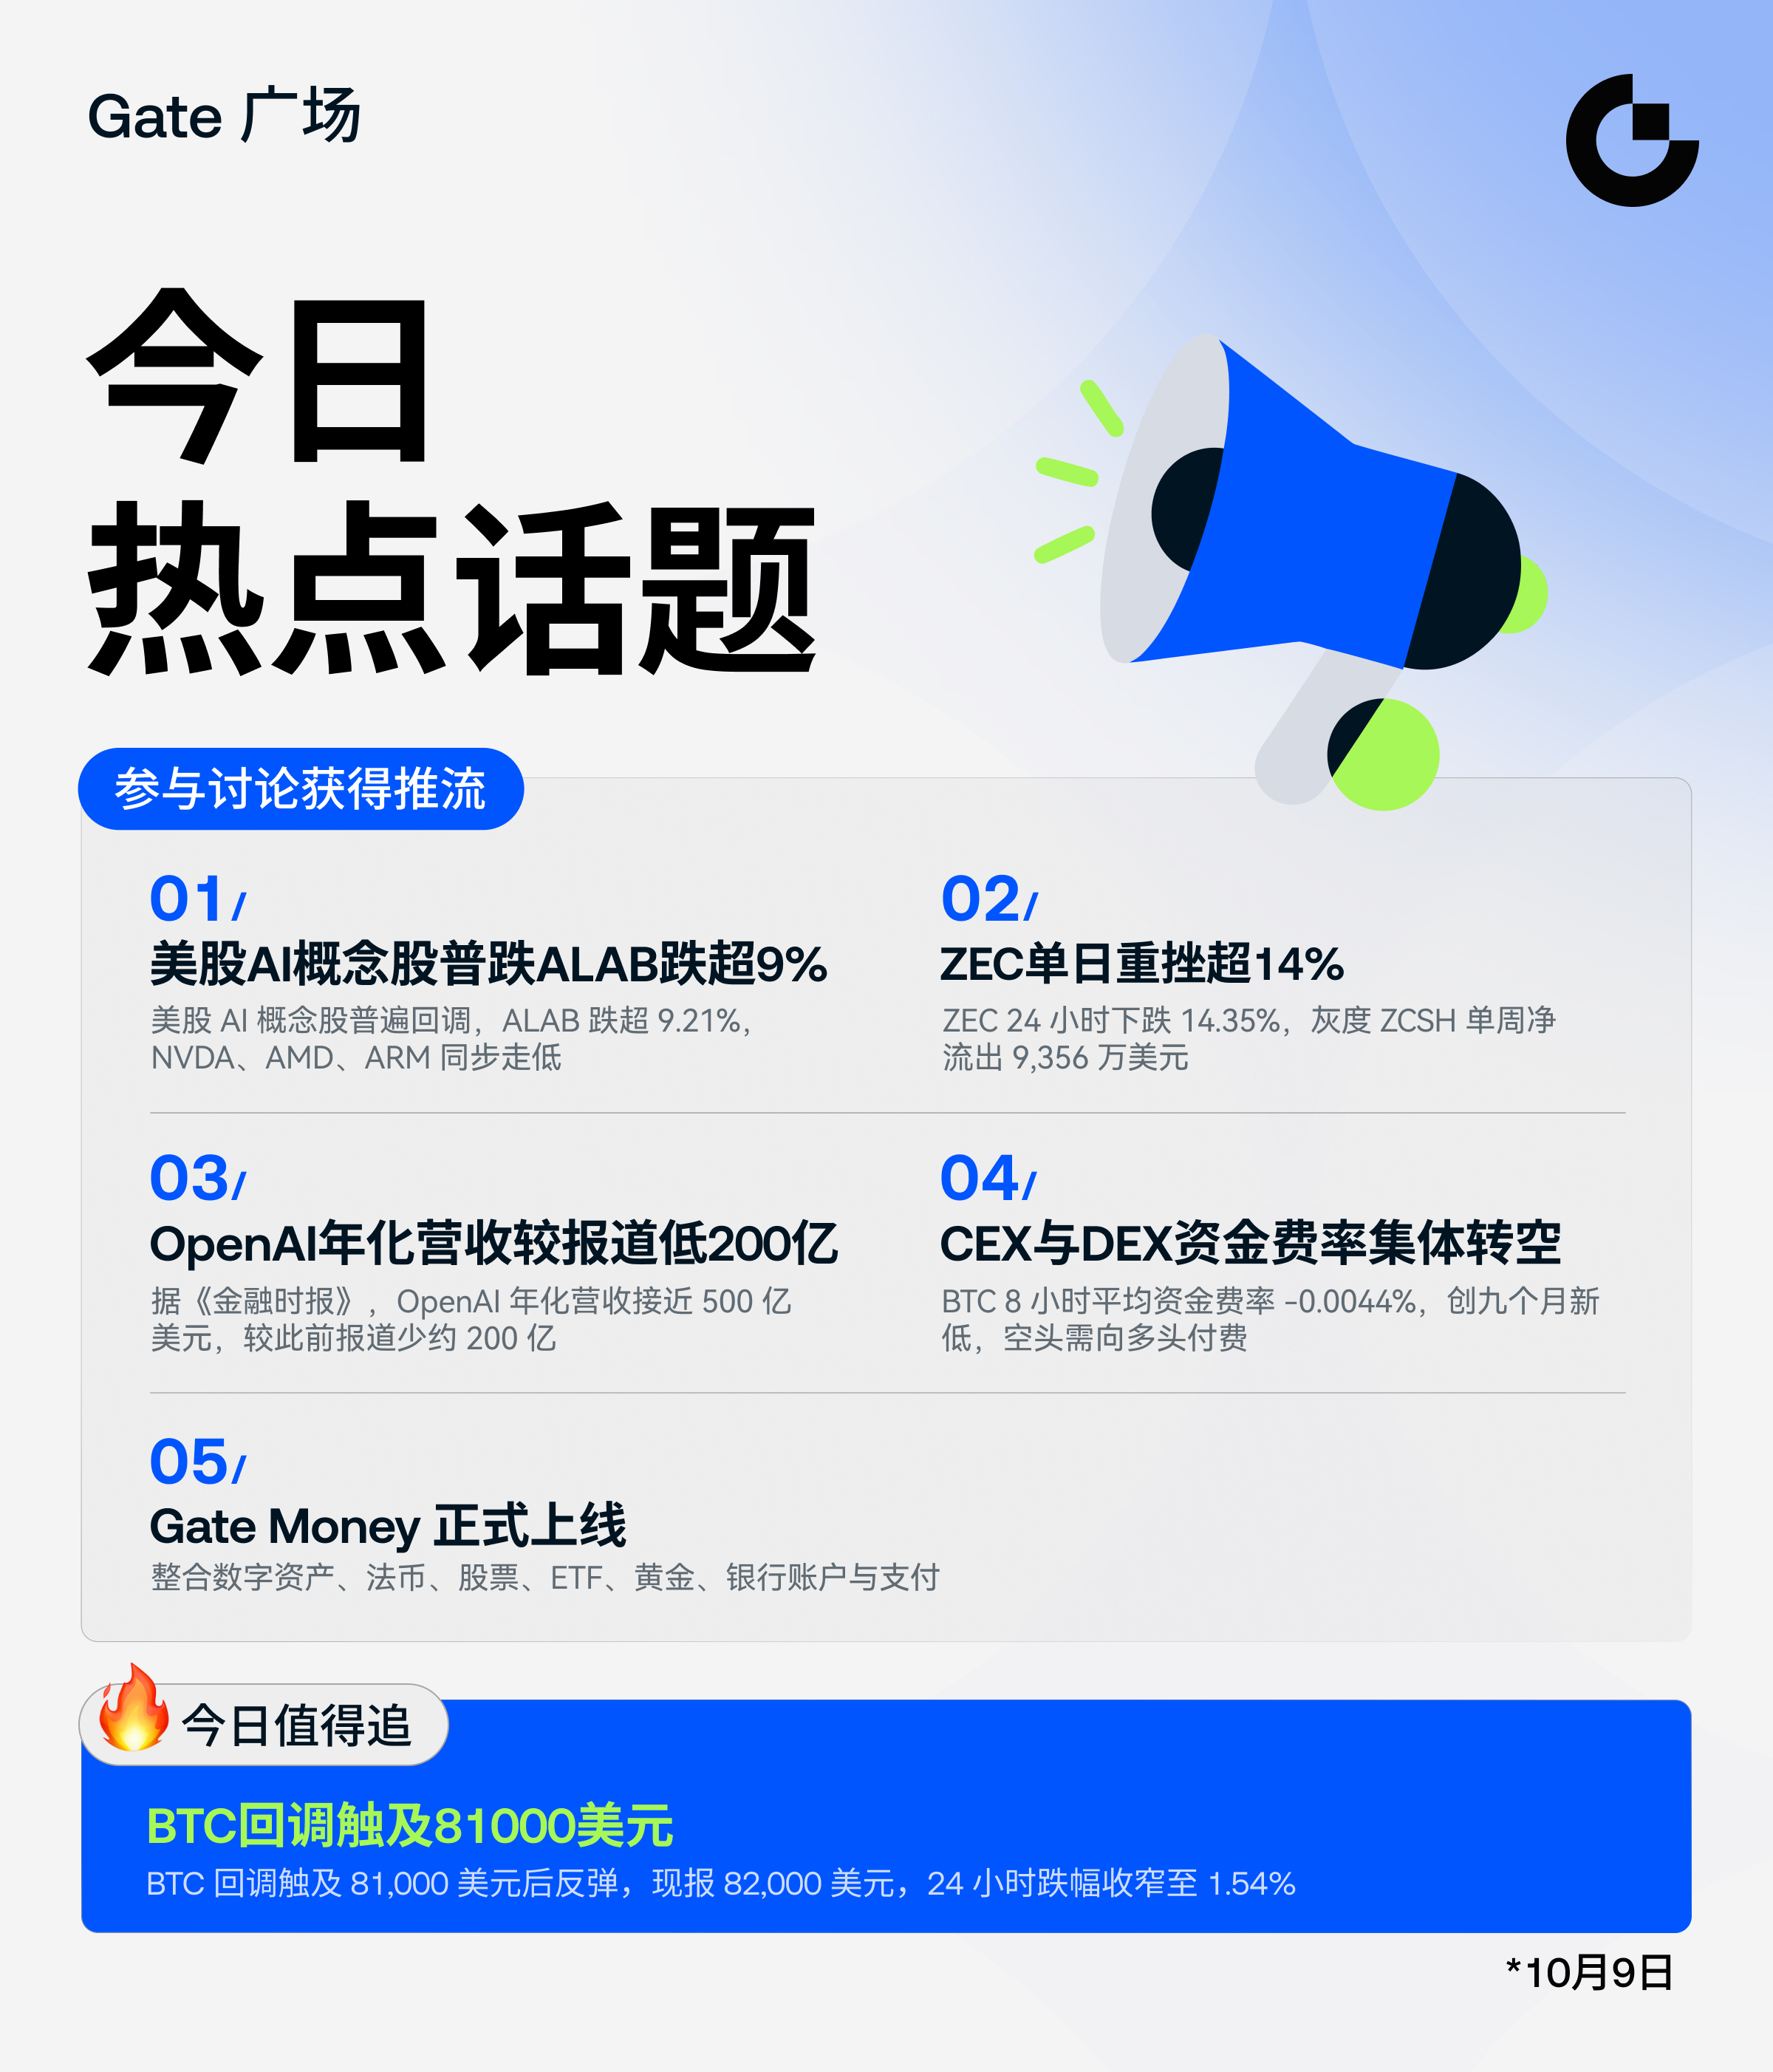

Analyst Gu Jingci: 10.9 Bitcoin/Ethereum long and short positions continue to profit, with market analysis attached. Bitcoin/Ethereum had been repeatedly reminded to enter short positions earlier. Last night into early morning, especially twice around 80500 to 81000 and 2400 to 2420, entering long was reminded. The current upward move is obvious, and the long position space is decent. The overall picture is visible to all, and many friends who followed along captured quite a bit of space. At present, the market has started rebounding and rising after bottoming out in the early morning. It is expected that there is still some space above. When shorts were called, people did not dare to enter; when longs were called, people were equally afraid, and even after entering, they could not hold on. This invisibly wasted a lot of space. The hourly chart still has some room for rebound and upward movement. Watch the resistance around 2550 and 83500 above. Below that resistance, continue entering short positions in batches on rallies. Trading suggestion: Enter short near Bitcoin 83000 to 83500, target near 81500; enter short near Ethereum 2520 to 2540, target near 2440. Analysis and strategy are for reference only, please bear your own risk. Article review and publication are not timely, please refer to real-time conditions. #GateAtTOKEN2049 #BTCReboundTouches81000USD #USAIStocksBroadlyFallALABDropsOver9%
もっと見る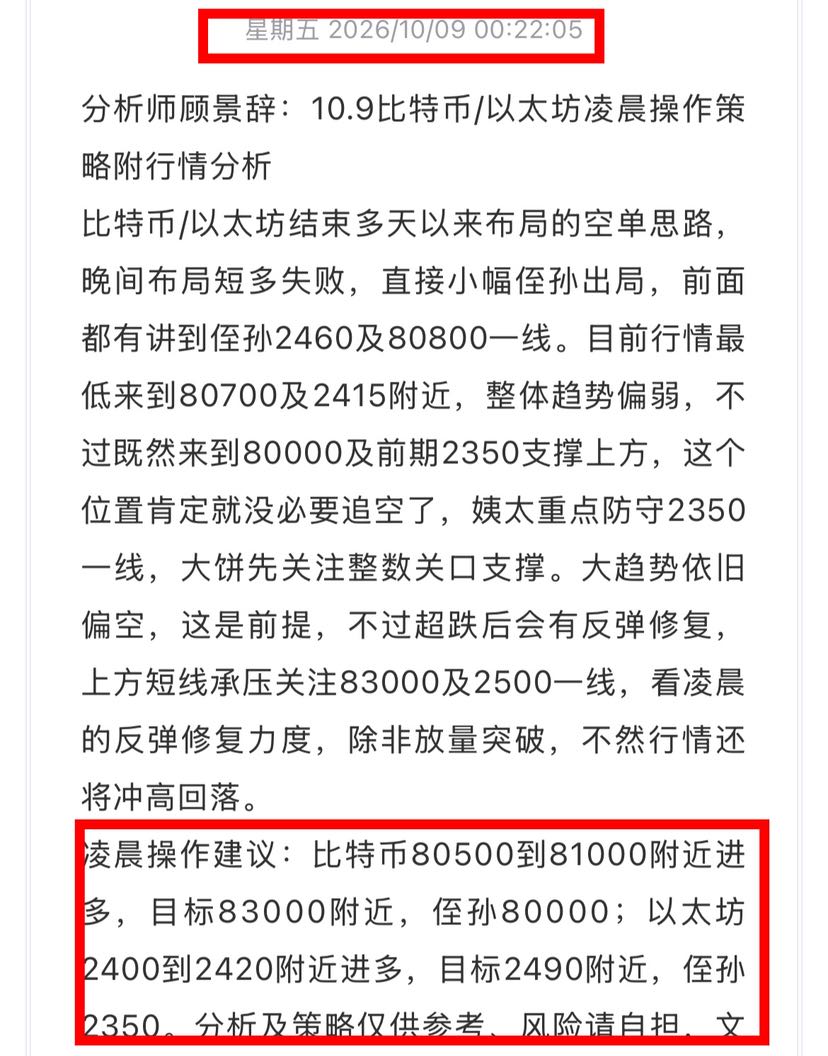


#USOpticalCommunicationStocksCloseLower $ALAB $LITE $COHR Good morning ☕ On October 7, the Nasdaq fell only 0.22%, but optical module stocks dropped 9% to 12%. When the index barely moves while one sector gets hit this hard, it is usually not market panic but a crowded trade being trimmed. I cannot prove what the reason is, and I would rather say that than invent one. What I can do is check which of these charts are still healthy. Here is my traffic light. 🟢 LITE: strongest trend, but farthest from safety Price is around 1,111, and the 14, 21, and 35 moving averages are in a bullish alignment and still rising, at 1,054, 1,013, and 971 RSI is around 67.6, MACD is still positive, and the histogram is expanding Resistance is 1,172.5, about 5.5% higher The issue is that the purple support has been down at 860.7, about 22% lower. That is not a level I can use for a tight stop My view: the trend is healthy, but this is the most expensive one to chase. It has already risen about 85% from a low near 600, so I would only enter on a pullback to the moving averages. 🟡 ALAB: strong chart, but a rejection pattern has appeared Price is around 381.8, and the most recent 4H candle rose about 2.2%, so the rebound has already started It pushed up to around 400 and then met strong selling, so that is a ceiling to respect Resistance is 386.4, only 1.2% above price. The moving averages are at 364 and 362.7, and support is 339.2 RSI is around 63.5, and MACD is flat My view: the rebound is real, but price is sitting just below resistance after a rejection wick. This is a spot for patience, not chasing. 🔴 COHR: weakest momentum of the three Price is around 333.2, right near its 14 moving average at 333.7. The 21 moving average is 331.3, and the 35 moving average is 315.2 MACD has crossed down, and the histogram is negative, so even though RSI is still around 61, momentum is weakening Resistance is 343.6, about 3% higher. Support is 320.3, about 4% lower My view: this is the one where the pullback has done the most damage to structure. It has not broken yet, but before relying on it, I want it to prove itself first. What they have in common All three are still above their 35 moving averages, and none has broken major support. So the trend is bent, but not broken. This drop looks like a shakeout of a crowded trade rather than a change in the underlying logic, which also matches what I saw in the same sector earlier this year: a sharp one-day drop, no company-specific bad news, and then an attempt to recover. Macro level admin question These are high-multiple growth stocks, and the Fed is in a rate hike cycle. Rate expectations hit this kind of stock first. With CPI on October 14 and the Fed decision on October 28, a hot print could push the sector down again, while a calm print would give support a chance to hold. Is the bad news already priced in? The rate path is priced in, but surprises are not. Another point worth noting: NVDA made a new high earlier this week while these stocks were sold off, which tells me money is rotating within the AI trade, not leaving it. This is my guess from the charts, not a fact. My plan 4H, my personal view, not advice COHR: Pullback long: 322 to 320.3 Stop: 4H close below 314.5, under the 35 moving average TP1: 331.3, about 1.6R TP2: 343.6, about 3.5R Breakout version: 4H close above 343.6 and hold, then look toward 350 If 314.5 breaks: stay out, or short after a failed retest, targeting 308, then 300 LITE: Pullback long: 1,055 to 1,045, the 14 moving average area Stop: 4H close below 1,005 TP1: 1,110, about 1.4R TP2: 1,172.5, about 2.7R TP3: 1,200 Breakout version: 4H close above 1,172.5, then I would trail the stop below the 14 moving average instead of guessing a target If 1,005 breaks: stay out, or short, targeting 971, then 900 ALAB: Pullback long: 364 to 362.7, the 14 and 21 moving averages Stop: 4H close below 355 TP1: 381.8, about 2.2R TP2: 386.4, about 2.7R TP3: 400, about 4.3R Breakout version: 4H close above 386.4 and hold, then look toward 400 If 355 breaks: stay out, or short, targeting 340 Keep position size smaller, use low leverage, and place orders at key levels. Stocks do not trade 24/7, so gaps can jump past stops, which is why my size here is smaller than when I trade crypto. My check result: stay calm, keep size light, spot position unchanged, intentionally hold cash. After a day like October 7, I would rather position early at a level than act one candle late. One-line ranking: LITE for trend, ALAB for rebound, COHR conservative. Which light do you trust most?
もっと見る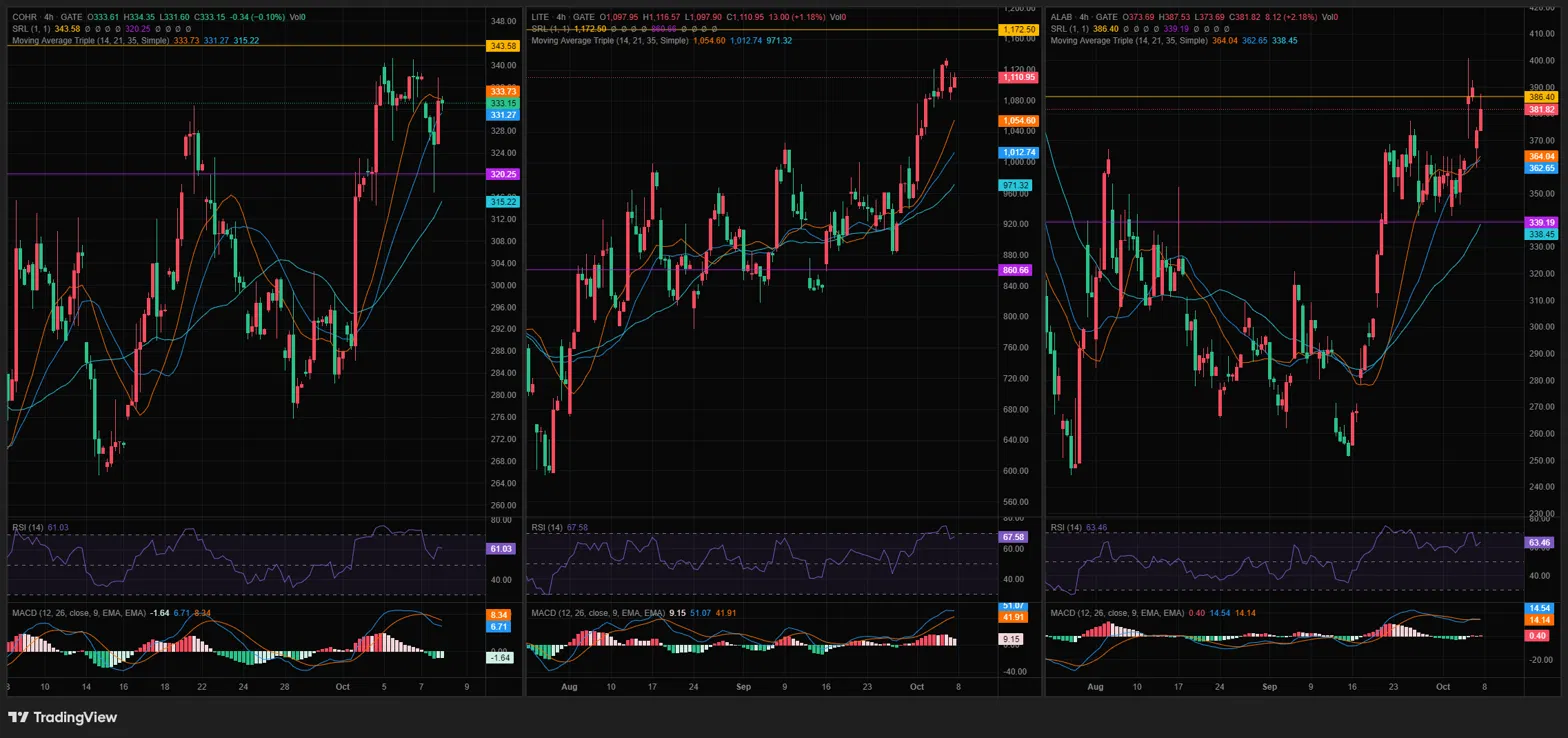
If it is not on your radar, it is time to start to anticipate the break higher in $ALAB and where your stop would go if it does not follow through. Daily chart with a 30-minute inset of consolidation. The 5sma is declining, but that could change in the next day or two. Now is the time to make your plan for your timeframe, risk tolerance, and so on.
もっと見る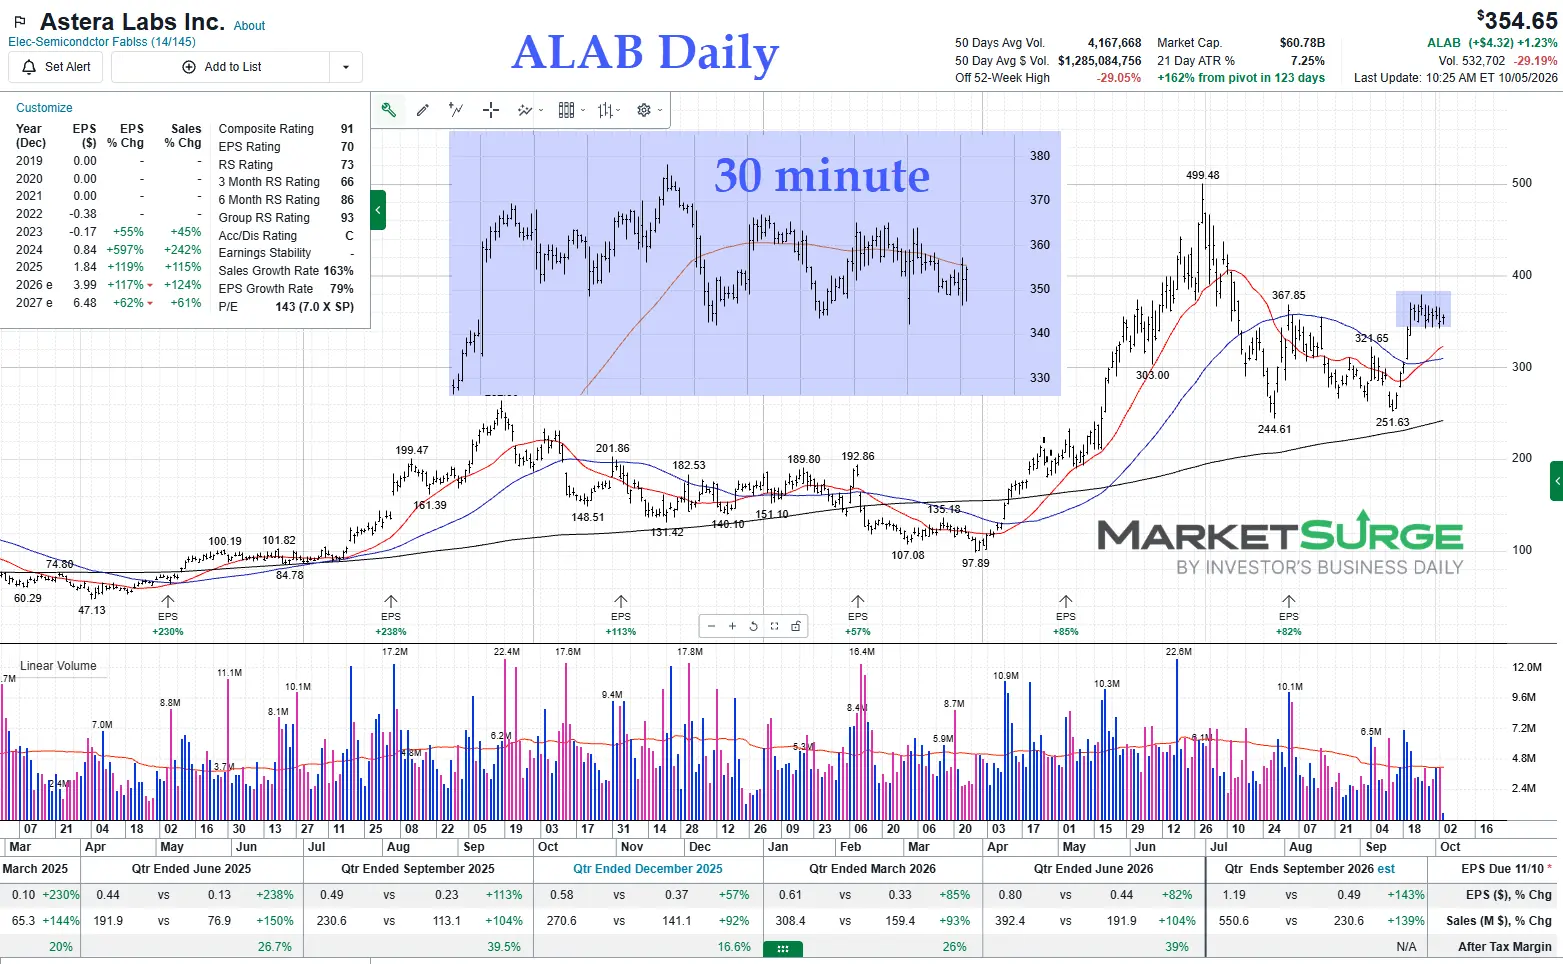
本ページは調査目的であり、投資助言ではありません。モデルは誤ることがあります。過去の実績は将来の成果を保証しません。