

$0.188
+0.016 (+8.41%)終値時点
Loading chart…
- 高値
- 0.189
- 始値
- 0.169
- 出来高加重平均価格
- 0.18
- 出来高
- 355.39K
- 時価総額
- 5.16M
- 安値
- 0.169
- 売買代金
- 64.60K
- EV/EBITDA(TTM)
- 0.00
The OLB Group, Inc. is a fintech company that focuses on a suite of products in the merchant services marketplace and seeks to provide integrated business solutions to merchants throughout the United States. It seeks to provide merchants with a range of products and services through its various online platforms, including financial and transaction processing services. Its business functions through three subsidiaries: eVance, Inc. (eVance), OmniSoft.io, Inc. (OmniSoft), and CrowdPay.Us, Inc. (CrowdPay). OmniSoft operates a cloud-based business management platform that provides turnkey solutions for merchants to enable them to build and manage their retail businesses. eVance provides competitive payment processing solutions to merchants, which enable merchants to process credit and debit card-based Internet payments for sales of their products. CrowdPay operates a white-label capital-raising platform that targets small and midsized businesses seeking to raise capital.
AI分析 of OLB Group Inc (OLB)
売りCurrently, OLB Group Inc is not a good buy. The stock is trading at $0.19, which is significantly down 71.06% year-to-date and 82.07% over the past year. The RSI is at 25.997, indicating that the stock is oversold, but this does not guarantee a price rebound. Additionally, the forward P/E ratio is 0, reflecting a lack of earnings expectations, and the gross margin has recently improved to 16.59%, but this is still low considering the company's historical performance. The major risk is the high volatility and recent 5-day change of -18.59%, indicating a downward trend.
バリュエーション指標
OLB Group Inc(OLB)の現在の予想PERは0.00で、5年平均は-3.66です。
イベントタイムライン
ニュース
 9.504-02seekingalpha
OLB Group FY 2025 Net Loss Narrows Significantly
 9.502-18Benzinga
Pitney Bowes Q4 Earnings Beat Expectations, Shares Surge
 4.502-18Benzinga
Major U.S. Indices Close Higher on Tuesday
 4.502-17Benzinga
U.S. Stocks Mostly Lower, Nasdaq Drops Over 50 Points
 7.502-17Benzinga
OLB Group Stock Soars on PayPal Partnership
OLB のよくある質問 — Alphio AI が回答
The OLB Group, Inc. is a fintech company that focuses on a suite of products in the merchant services marketplace and seeks to provide integrated business solutions to merchants throughout the United States. It seeks to provide merchants with a range of products and services through its various online platforms, including financial and transaction processing services. Its business functions through three subsidiaries: eVance, Inc. (eVance), OmniSoft.io, Inc. (OmniSoft), and CrowdPay.Us, Inc. (CrowdPay). OmniSoft operates a cloud-based business management platform that provides turnkey solutions for merchants to enable them to build and manage their retail businesses. eVance provides competitive payment processing solutions to merchants, which enable merchants to process credit and debit card-based Internet payments for sales of their products. CrowdPay operates a white-label capital-raising platform that targets small and midsized businesses seeking to raise capital. It operates in the Technology sector (SERVICES-BUSINESS SERVICES, NEC industry).
Currently, OLB Group Inc is not a good buy. The stock is trading at $0.19, which is significantly down 71.06% year-to-date and 82.07% over the past year. The RSI is at 25.997, indicating that the stock is oversold, but this does not guarantee a price rebound. Additionally, the forward P/E ratio is 0, reflecting a lack of earnings expectations, and the gross margin has recently improved to 16.59%, but this is still low considering the company's historical performance. The major risk is the high volatility and recent 5-day change of -18.59%, indicating a downward trend.
コミュニティ
もっと見る ↗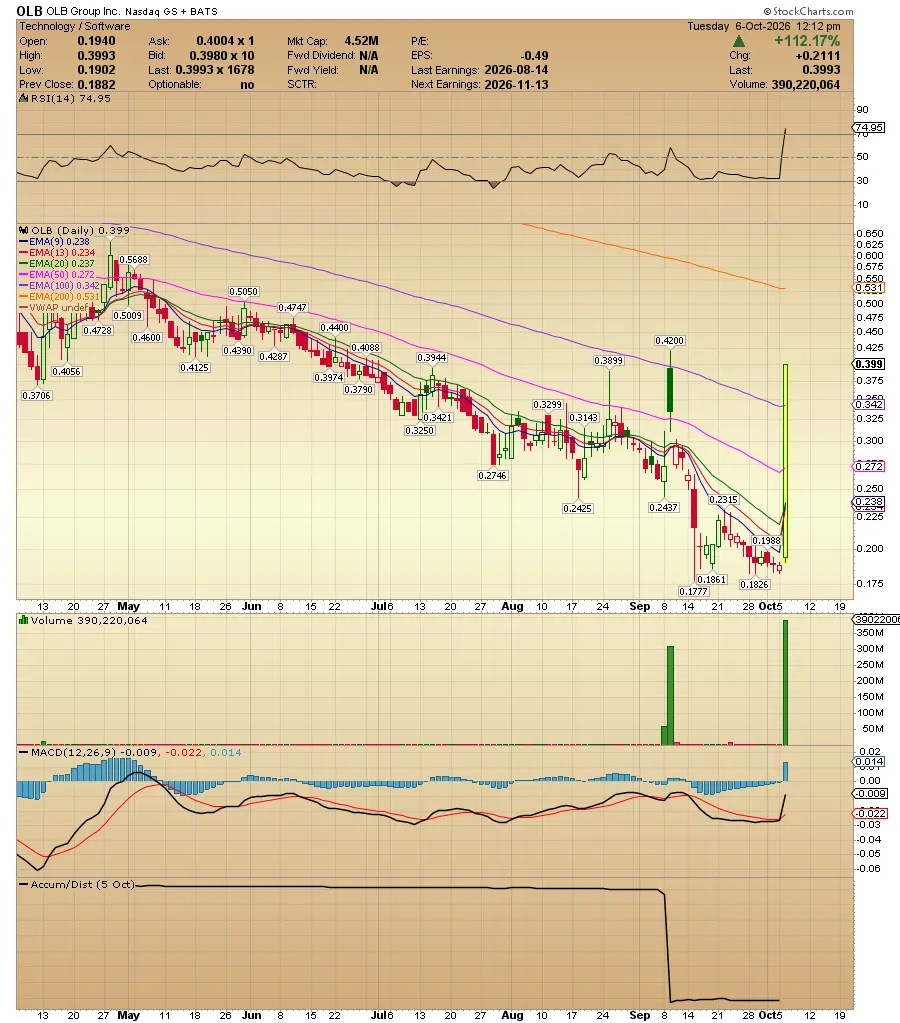
関連記事
- How to Rebalance a Concentrated Stock Portfolio in 2026: Mag7 Drift, Tax-Aware Trims, and Practical Rebalance a concentrated stock portfolio in 2026: Mag7 drift risk, 5pp bands, tax-aware trims, RSP/IWM diversifiers, and single-name caps.
- Small Cap Stocks Investing Guide 2026: Russell 2000, Fed Hikes, and the Financing TradeSmall-cap stocks investing guide 2026: Russell 2000 vs S&P, IWM rate sensitivity, floating-rate debt, Fed hikes, valuation discounts, and a practical checklist.
- Santa Claus Rally and the Year-End Stock Market: Investor Guide for Late 2026Santa Claus rally explained: 7-day window stats since 1950, Nov–Dec seasonality, post-midterm 2026 setup, and a risk-managed year-end investing playbook.
本ページは調査目的であり、投資助言ではありません。モデルは誤ることがあります。過去の実績は将来の成果を保証しません。