強
強気
強気 · 25%INTC
$18.42
シナリオ価格
$89.850
-5.202 (-5.79%)終値時点
Intel Corporation is a global designer and manufacturer of semiconductor products. The Company's segments include Intel Products, Intel Foundry, and All Other. Its Intel Products comprise Client Computing Group (CCG) and Data Center and AI (DCAI). CCG delivers platforms and processors that power PCs and edge devices, enabling enhanced performance, connectivity and user experience for consumer and commercial markets with capabilities that also support retail, industrial robotics and AI ecosystems at the edge. DCAI delivers workload-optimized solutions based upon its x86 architecture for data centers, including CPUs, AI accelerators, NICs, IPUs and custom ASICs, enabling performance and scalability for cloud, enterprise, telecommunication and HPC environments. The Intel Foundry segment comprises technology development, manufacturing and foundry services, developing new semiconductor process technologies and advanced packaging technologies. All Other segments include Mobileye and Other.
Intel Corp is currently a hold due to its recent price drop to $104.70, which is significantly below the analyst price target of $145 from Tigress Financial. The stock has seen a year-to-date increase of 165.87%, but the RSI is at a low 24.032, indicating potential oversold conditions. However, insider selling has increased by 308.41%, which raises concerns about the stock's short-term outlook. The main risk is the potential decline to the $85 to $89 range if revenue growth does not meet expectations, as indicated by market sentiment.
Mizuho
$114
2026-10-06
Mizuho
2026-10-06
目標株価
$114
Tigress Financial
$145
2026-09-15
Tigress Financial
2026-09-15
目標株価
$145
Piper Sandler
$110
2026-09-09
Piper Sandler
2026-09-09
目標株価
$110
Northland
$120
2026-09-08
Northland
2026-09-08
目標株価
$120
Mizuho
$92
2026-09-04
Mizuho
2026-09-04
目標株価
$92
シナリオ価格は本年の最終月次予想レンジです。確率はモデルの固定ウェイト(25 / 50 / 25)であり、保証ではありません。
Intel Corporation is a global designer and manufacturer of semiconductor products. The Company's segments include Intel Products, Intel Foundry, and All Other. Its Intel Products comprise Client Computing Group (CCG) and Data Center and AI (DCAI). CCG delivers platforms and processors that power PCs and edge devices, enabling enhanced performance, connectivity and user experience for consumer and commercial markets with capabilities that also support retail, industrial robotics and AI ecosystems at the edge. DCAI delivers workload-optimized solutions based upon its x86 architecture for data centers, including CPUs, AI accelerators, NICs, IPUs and custom ASICs, enabling performance and scalability for cloud, enterprise, telecommunication and HPC environments. The Intel Foundry segment comprises technology development, manufacturing and foundry services, developing new semiconductor process technologies and advanced packaging technologies. All Other segments include Mobileye and Other. It operates in the Technology sector (SEMICONDUCTORS & RELATED DEVICES industry).
Intel Corp is currently a hold due to its recent price drop to $104.70, which is significantly below the analyst price target of $145 from Tigress Financial. The stock has seen a year-to-date increase of 165.87%, but the RSI is at a low 24.032, indicating potential oversold conditions. However, insider selling has increased by 308.41%, which raises concerns about the stock's short-term outlook. The main risk is the potential decline to the $85 to $89 range if revenue growth does not meet expectations, as indicated by market sentiment.
41 analysts cover INTC: 23 rate it Buy, 13 Hold and 5 Sell. The average price target is 39.30.

Nasdaq 100 fell 5.5% this week, its worst week in a year and a half. Bitcoin, meanwhile, is down just over 1% on the week and now sits at 81.5k. A few days ago I said Bitcoin was being sold off alongside tech stocks. Looking at the longer stretch this week, it actually held up better than tech. The key question is what the US stock market is really afraid of here. It's not that AI is failing — it's that AI has borrowed too much money. A company called CoreWeave, which rents out compute capacity to AI companies, fell 25% this week, simply because it carries over 51 billion dollars in debt. AI data centers are extremely capital-intensive, and most of these companies are building them with borrowed money. Once rate-hike expectations pick up, borrowing gets more expensive, and people start calculating whether these debts can actually be repaid. The hardest-hit names are the ones burning the most cash — chips, memory, compute. Micron and Intel each fell more than 5% on Friday alone. Bitcoin doesn't have this problem — it has no debt to repay and doesn't file earnings reports. What the US stock market fears this time is excessive borrowing, and that doesn't land on Bitcoin. Last night the rate-hike probability dropped from 45% to 27%, which is only a breather for tech stocks — the debt is still sitting there. For Bitcoin, it just means one less headwind. One more point: Bitcoin already went through a washout on Wednesday. That day over 900 million dollars were liquidated across the market, 80% of them longs. Those who needed to exit have exited, and the remaining holders aren't too rattled by further drops this week. One risk worth mentioning. MSCI said this week it will change its index rules, and Strategy, the company holding the most Bitcoin, could be removed from its global index. If that happens, passive funds tracking the index would have to sell its stock, and Strategy has been one of Bitcoin's biggest buyers over the past two years. Nothing is finalized yet — just keep an eye on it. My current view: Bitcoin is stronger than US stocks in the short term, but decoupling is still far off. The 80k level has been bought back twice this week; if it holds, Bitcoin will bounce first once US stocks stabilize. If it breaks below 80k, this relative strength is fake. #Nasdaq100Fell5.5%ThisWeekLargestWeeklyDropIn18Months $BTC
もっと見る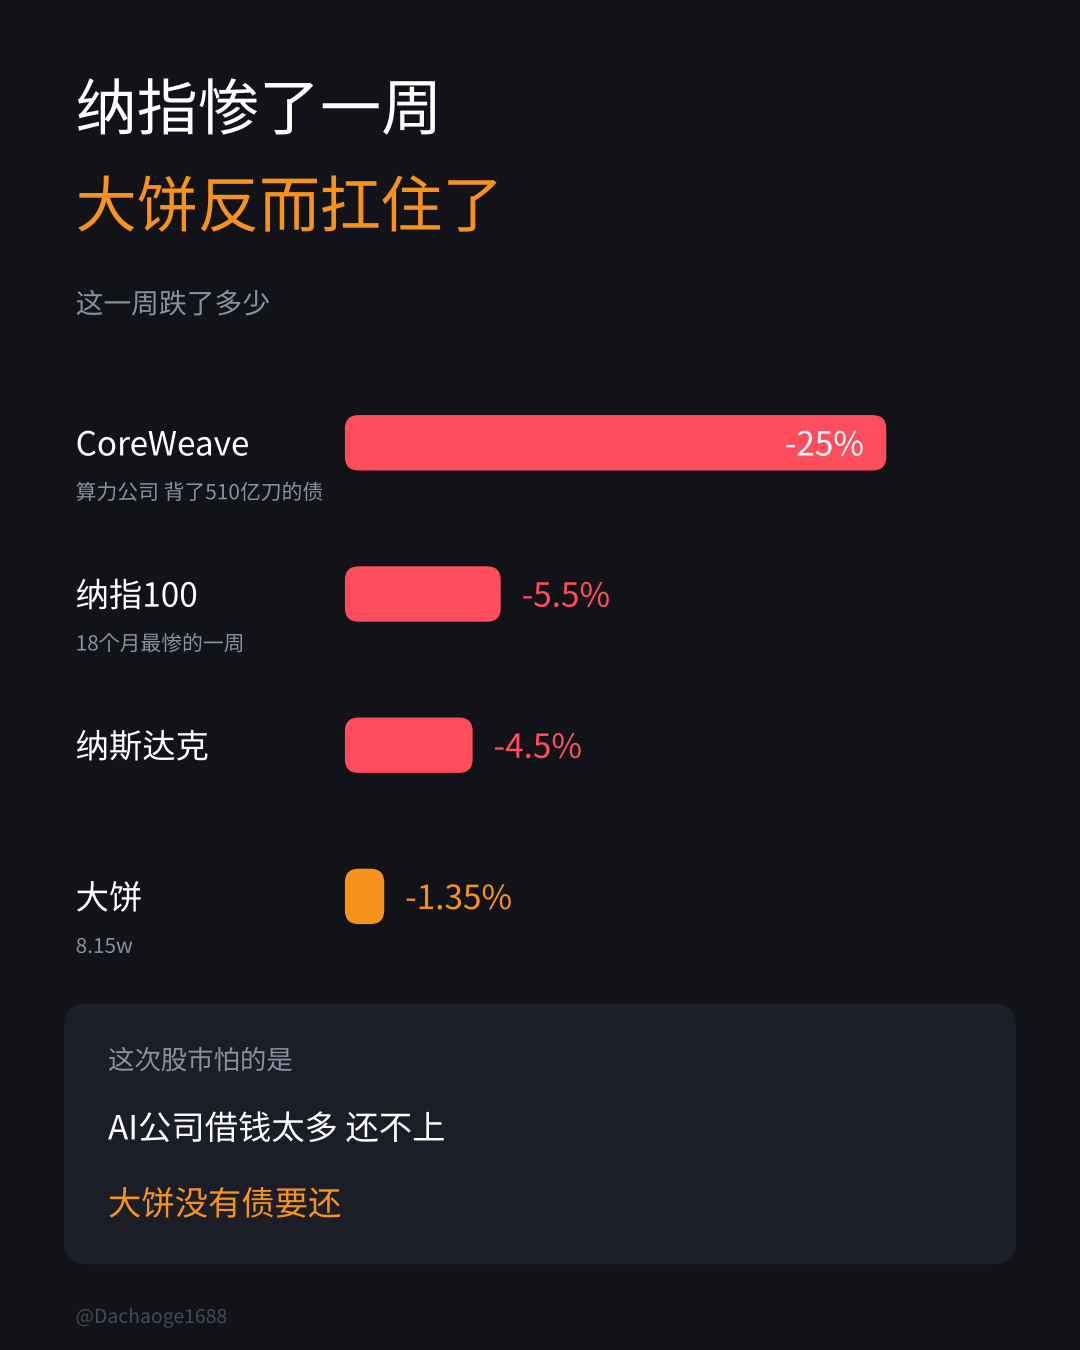
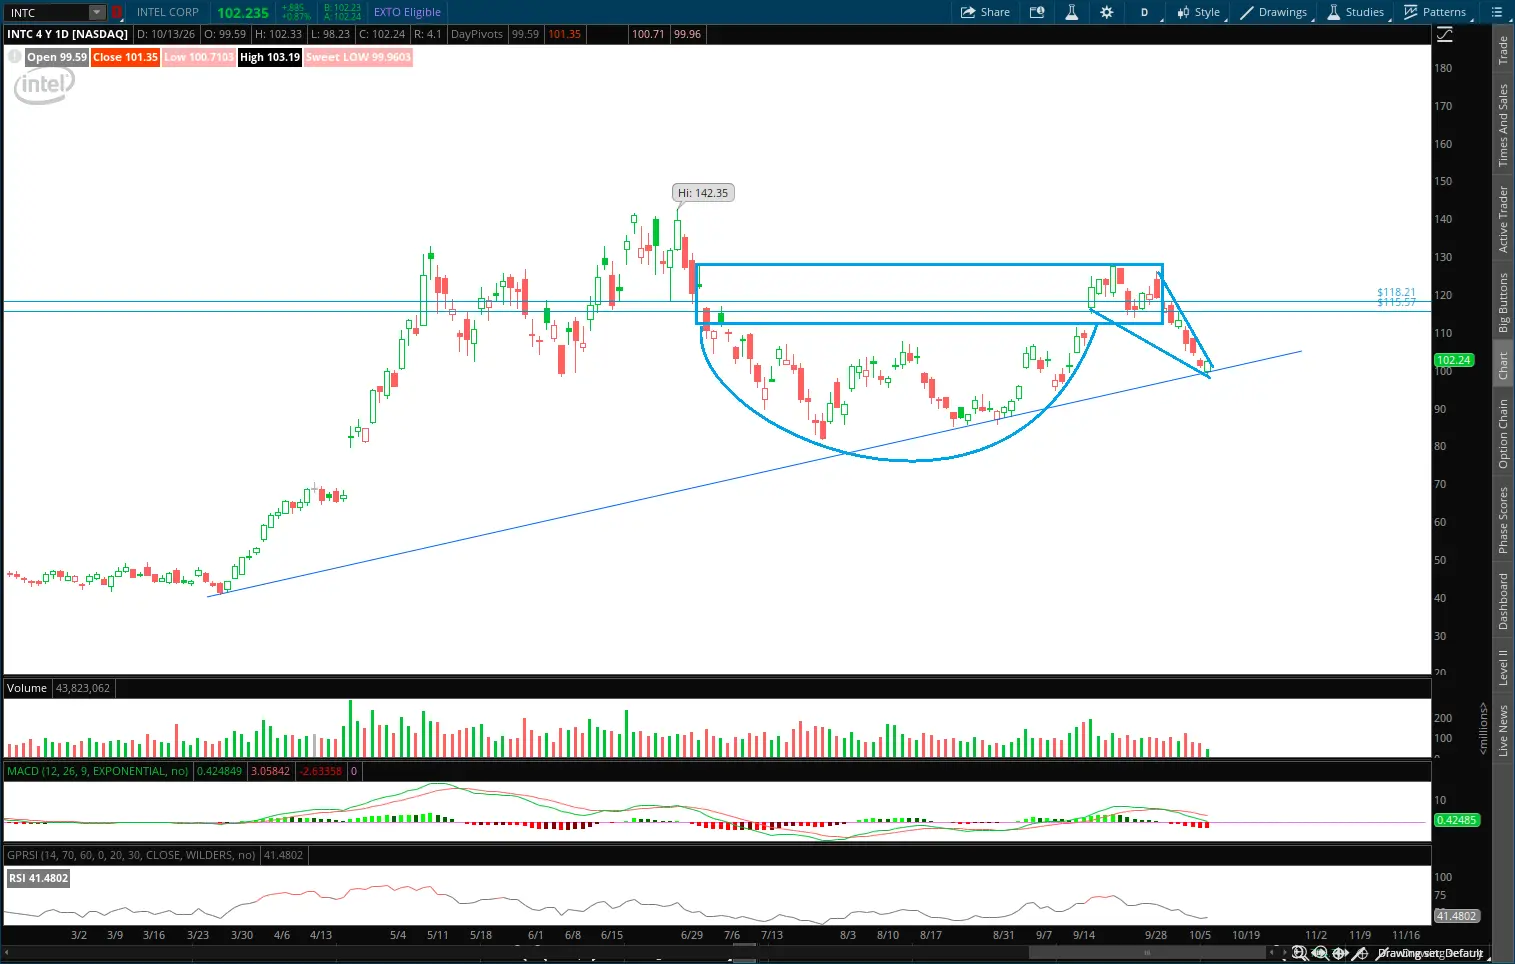
This $INTC selloff looks overdone at this point. I see a bounce off the 2-month uptrend support coming near-term.
もっと見る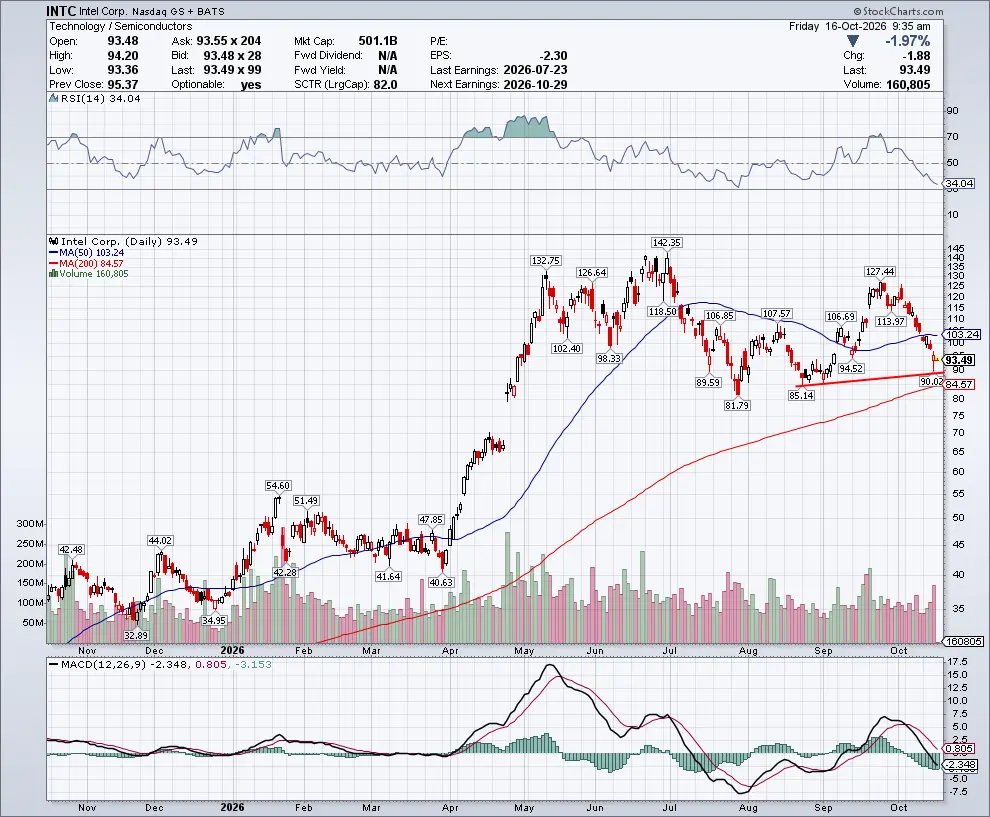

On the evening of October 15 Beijing time, Intel's stock opened with a gap down and fell more than 8% at one point during the session. As of 23:26, the decline narrowed to 4%, and its market capitalization fell below $500 billion, latest at $493.973 billion.
もっと見る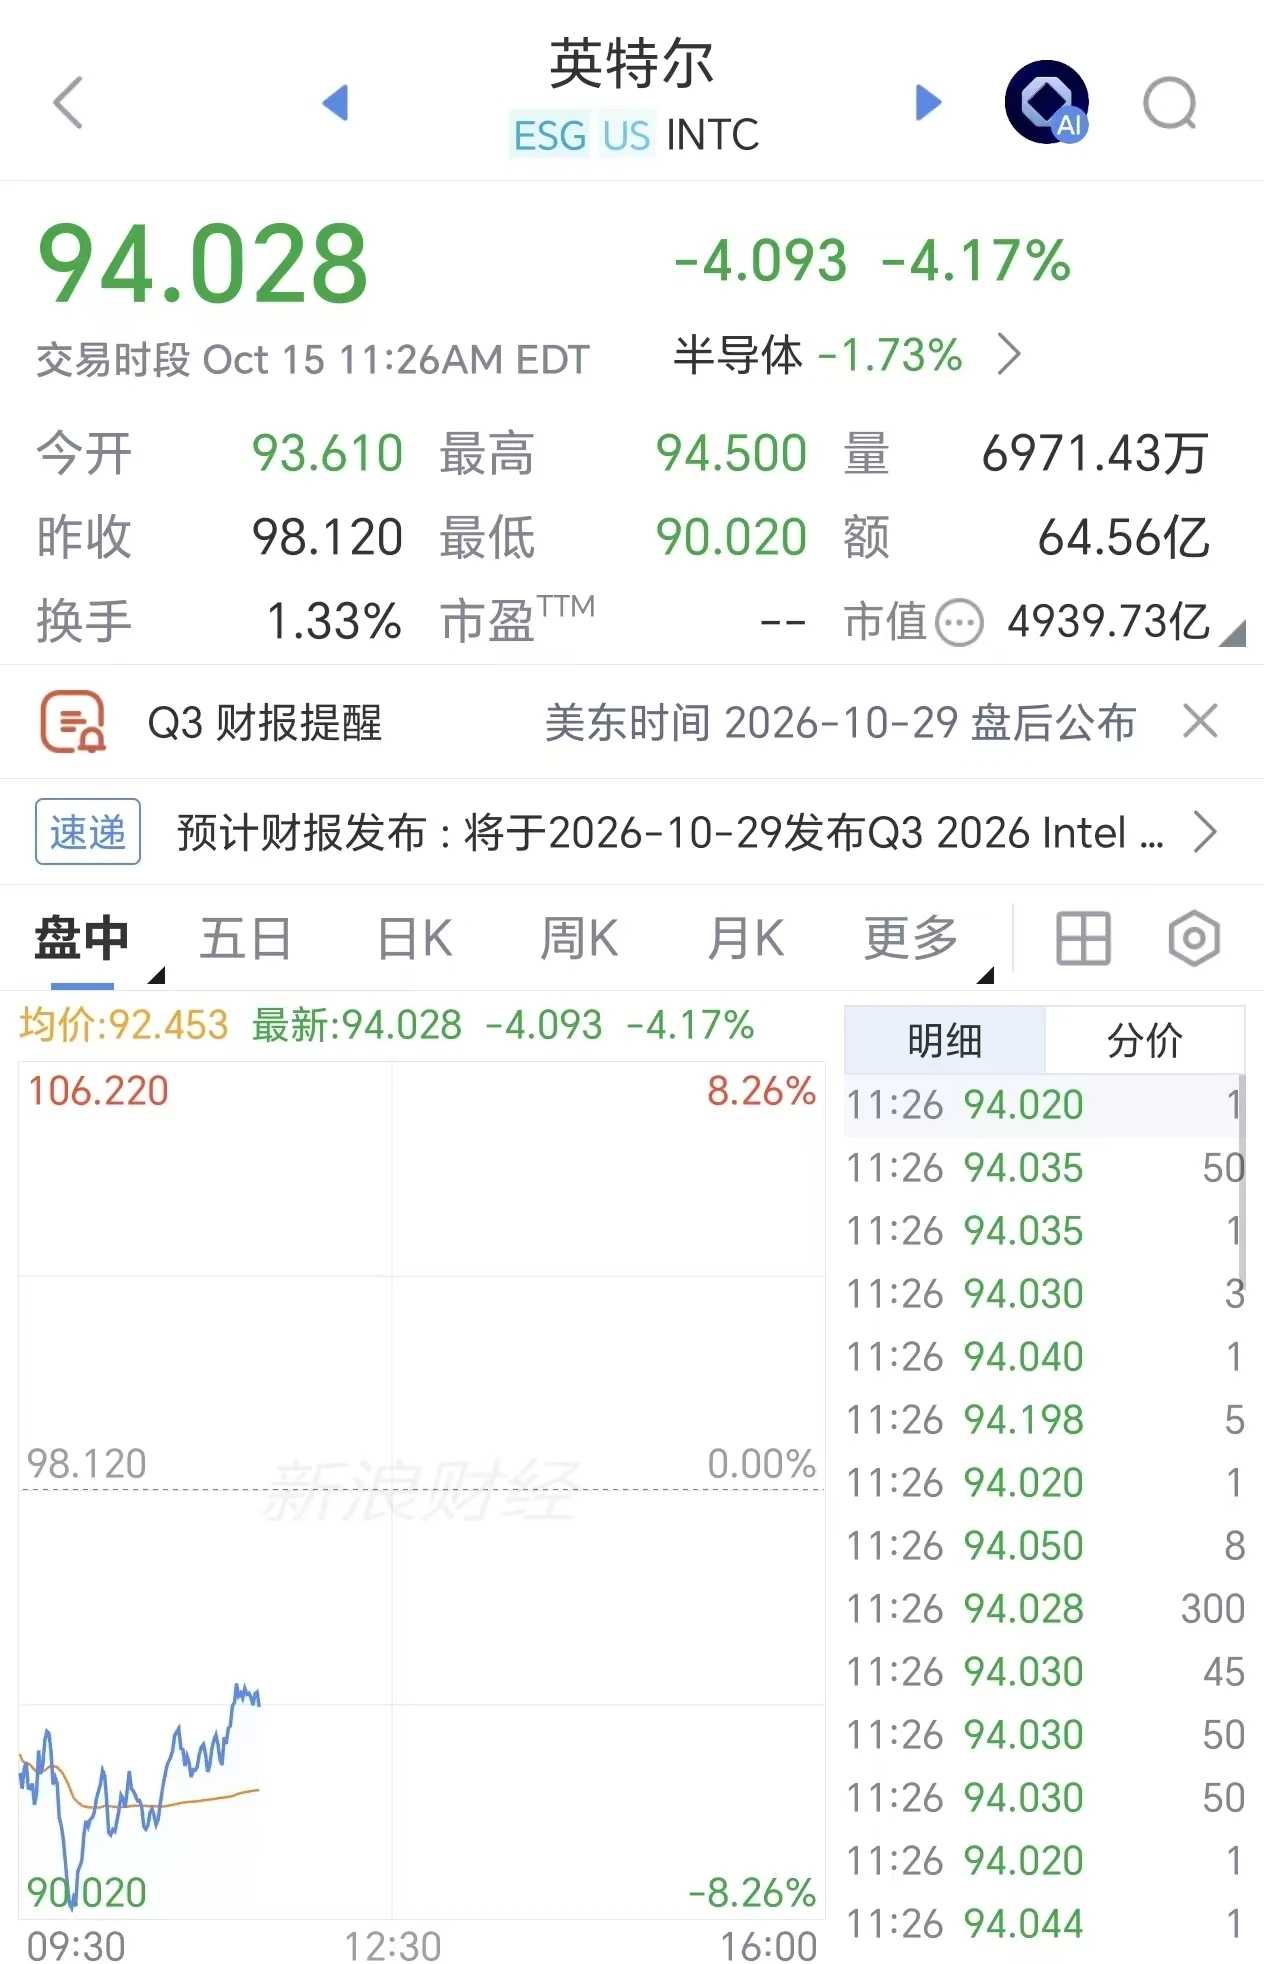


$rINTC Intel (INTC/USDT) on Bitget: Reading the Chop Between $105 and $110 If you've been watching the INTC/USDT chart on Bitget lately, you know it's been a bit of a rollercoaster. Currently sitting around 107.98, we're seeing a classic tug-of-war between the bears and the bulls. Let me break down the structure I'm seeing across the 4H, 1H, and 15m timeframes. To understand the complete market situation right now, we have to look at three distinct zones. First, we have the major support shelf at 105.24 — this is the line in the sand that bulls absolutely must defend; if this breaks, the structural floor falls out. Second, we have the immediate battleground zone between 107 and 108.50, where price is currently consolidating and fighting for directional clarity. Finally, we have the heavy resistance cluster up at 110.60 to 114.26, where the SuperTrend and upper Bollinger Bands are capping any upside momentum. So, how do we approach this? I'm looking at three specific scenarios based on price action and volume: Scenario 1: The Bullish Reclaim (Breakout) If we see a high-volume 1H or 4H candle close above 108.50, I'm looking for a momentum push toward the 110.60 resistance. If the bulls can flip that level into support, the next target is the 114.26 SuperTrend zone. In this case, I'd be looking for long setups on the retest of the breakout. Scenario 2: The Range Chop (Consolidation) Given the mixed signals on the 15m and 1H charts (with the SAR flipping and Bollinger Bands pinching), the most likely scenario is continued chop. If price stays trapped between 106.70 and 108.50, I'm sitting on my hands. This is where retail gets chopped up. I'd wait for a deviation — a fakeout above 108.50 or a sweep of 106.70 — before entering a scalp. Scenario 3: The Bearish Breakdown (Continuation) If the selling pressure resumes and we lose the 105.24 support on a closing basis, the bearish trend is confirmed. In this case, I'm looking for a retest of the breakdown zone to short, targeting lower lows. The lack of strong volume on the recent bounce attempts suggests the bears aren't done yet. My Verdict: Right now, the chart is objectively neutral-to-bearish until we reclaim 108.50. The 4H SuperTrend is still red, and the 1H Bollinger Bands are wide, suggesting volatility is still present. I'm waiting for a decisive close. Stay patient, manage your risk, and let the chart come to you. $INTC
もっと見る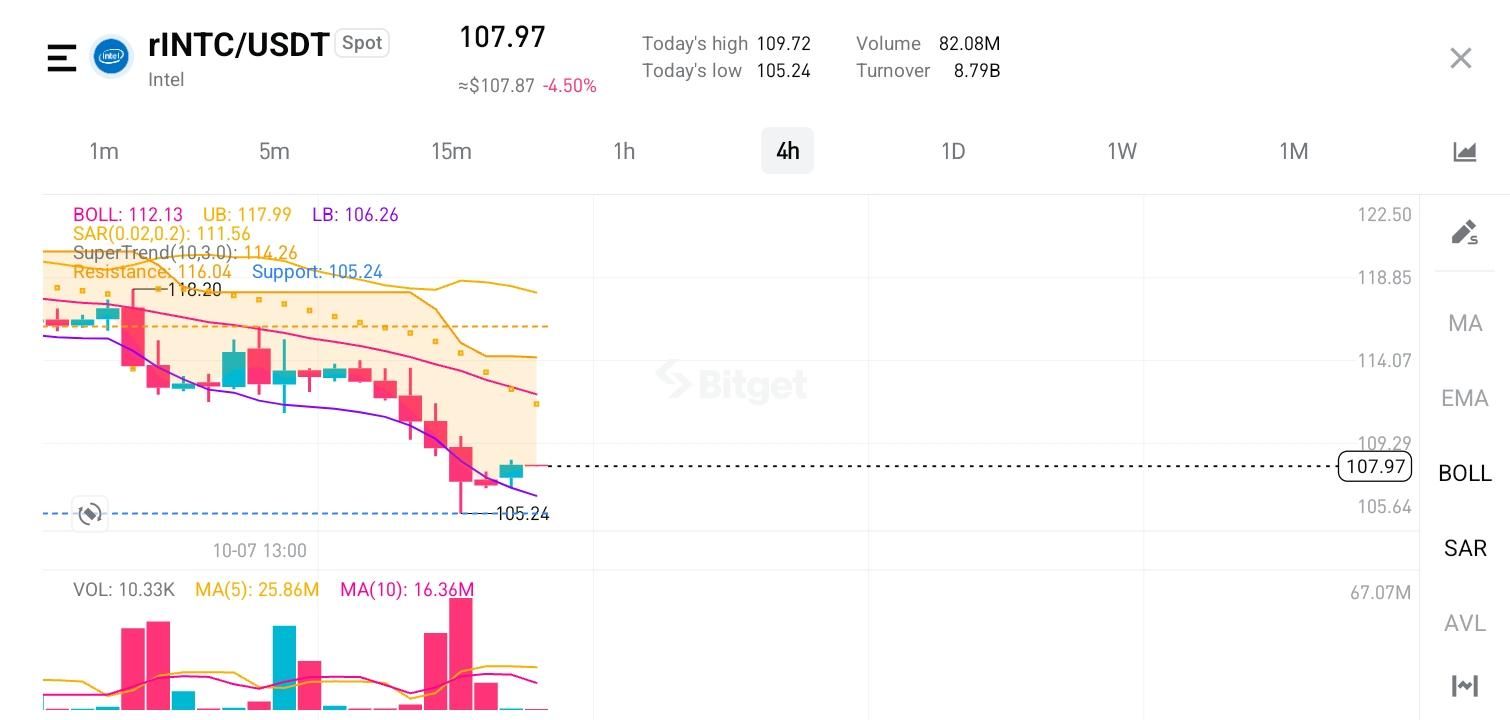
本ページは調査目的であり、投資助言ではありません。モデルは誤ることがあります。過去の実績は将来の成果を保証しません。