



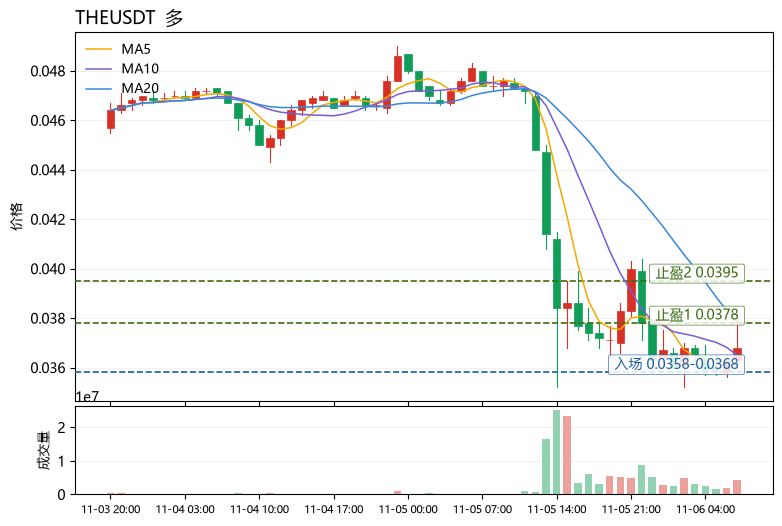
Chasing shorts after a sharp drop is one of the most common trading mistakes retail traders make—price has already fallen 22%, and RSI is often already in weak territory at this point, so continuing to short makes it easy to sell right where a rebound begins. $THE is currently in exactly this structure: price at 0.0368, MA5=0.03628 has been reclaimed, and although it remains below MA20=0.037795, the short-term moving average is starting to flatten; the MACD histogram is +0.0001454, with price making a new low while the histogram turns positive, suggesting an early stage of bullish divergence; RSI=35.9, close to the weak zone but not below 30, showing weakening downside momentum. The lower Bollinger Band at 0.0335777 is the extreme reference for this sharp drop, and price is currently trading between the lower band and the middle band, consistent with an oversold repair structure. The funding rate of +0.0050% shows longs are still paying, sentiment is not extreme, and the Fear & Greed Index at 50 is neutral, so conditions for a one-sided collapse are not in place. On the operational side, I lean toward viewing this as a rebound repair: entry reference 0.0358–0.0368 (near MA5 support and the current price congestion zone), take-profit 1 at 0.0378 (MA20 resistance, also near the Bollinger middle band), take-profit 2 at 0.0395 (the prior high-volume congestion zone above the Bollinger middle band), stop-loss at 0.0334 (below the Bollinger lower band at 0.0335777; a break below would invalidate the oversold logic). If price breaks below the lower band on heavy volume, exit and stay on the sidelines. Also worth watching during the same period: $SOXSB is leading strongly with RSI already at 73.8, in overbought territory, while $HUMA is weak and probing lower with RSI at only 24.3; the relative strength divergence between the two is clear and can serve as a sentiment reference. (Personal view for reference only; not investment advice. Futures risk is extremely high—please strictly control position size.) 【Data】 Pair: THEUSDT Direction: Long Entry: 0.0358-0.0368 Take-profit 1: 0.0378 Take-profit 2: 0.0395 Stop-loss: 0.0334
もっと見る$0.396
-0.048 (-12.11%)終値時点
- 高値
- 0.449
- 始値
- 0.440
- 出来高加重平均価格
- 0.41
- 出来高
- 6.01M
- 時価総額
- 559.70M
- 安値
- 0.387
- 売買代金
- 2.47M
- EV/EBITDA(TTM)
- -0.08
Humacyte, Inc. is a commercial-stage biotechnology platform company. The Company is engaged in developing a disruptive biotechnology platform to deliver universally implantable bioengineered human tissues, advanced tissue constructs, and organ systems designed to improve the lives of patients and transform the practice of medicine. The Company develops and manufactures acellular tissues to treat a range of diseases, injuries, and chronic conditions. It is using its proprietary, scientific technology platform to engineer and manufacture acellular tissue engineered vessels (ATEVs). The Company is also in late-stage clinical trials targeting other vascular applications, including arteriovenous (AV) access for hemodialysis and peripheral artery disease (PAD). The Company is also engaged in the preclinical development of coronary artery bypass grafts, pediatric heart surgery, treatment of type 1 diabetes, and multiple cell and tissue applications.
AI分析 of Humacyte Inc (HUMA)
中立Humacyte Inc (HUMA) is currently trading at $0.3981, which is significantly below its 52-week high of $1.56, indicating a potential undervaluation. However, the stock has a low RSI of 37.916, suggesting it is nearing oversold conditions. The forward P/E ratio stands at 35.8423, which is relatively high, indicating that investors are expecting growth, but this also implies a risk if the company fails to meet these expectations. The recent FDA approvals for its products could drive future growth, but the company has reported substantial net losses, with a net income of -36802000 in Q2 2026. The main risk is the high volatility in its earnings and the speculative nature of its current valuation, as evidenced by the recent downgrade of revenue estimates by Benchmark from $6.6M to $4.9M for 2026. Therefore, while there are positive catalysts, the risks associated with the company's financial performance suggest a cautious approach for long-term investors.
バリュエーション指標
イベントタイムライン
ニュース
2.010-12NewsfilterHumacyte Presents Interim Results of V012 Clinical Trial
9.009-09NewsfilterFDA Approves Extension of Symvess Expiration to 36 Months
8.508-24NewsfilterHumacyte Plans to File Supplemental BLA for ATEV in November 2026
5.008-18Yahoo FinanceHumacyte's Symvess First Implanted in Arizona by Dr. Jeromy Brink
9.007-27NASDAQ.COMHumacyte Receives FDA Approval for First-in-Human Clinical Trial
HUMA のよくある質問 — Alphio AI が回答
Humacyte, Inc. is a commercial-stage biotechnology platform company. The Company is engaged in developing a disruptive biotechnology platform to deliver universally implantable bioengineered human tissues, advanced tissue constructs, and organ systems designed to improve the lives of patients and transform the practice of medicine. The Company develops and manufactures acellular tissues to treat a range of diseases, injuries, and chronic conditions. It is using its proprietary, scientific technology platform to engineer and manufacture acellular tissue engineered vessels (ATEVs). The Company is also in late-stage clinical trials targeting other vascular applications, including arteriovenous (AV) access for hemodialysis and peripheral artery disease (PAD). The Company is also engaged in the preclinical development of coronary artery bypass grafts, pediatric heart surgery, treatment of type 1 diabetes, and multiple cell and tissue applications. It operates in the Healthcare sector (BIOLOGICAL PRODUCTS, (NO DISGNOSTIC SUBSTANCES) industry).
Humacyte Inc (HUMA) is currently trading at $0.3981, which is significantly below its 52-week high of $1.56, indicating a potential undervaluation. However, the stock has a low RSI of 37.916, suggesting it is nearing oversold conditions. The forward P/E ratio stands at 35.8423, which is relatively high, indicating that investors are expecting growth, but this also implies a risk if the company fails to meet these expectations. The recent FDA approvals for its products could drive future growth, but the company has reported substantial net losses, with a net income of -36802000 in Q2 2026. The main risk is the high volatility in its earnings and the speculative nature of its current valuation, as evidenced by the recent downgrade of revenue estimates by Benchmark from $6.6M to $4.9M for 2026. Therefore, while there are positive catalysts, the risks associated with the company's financial performance suggest a cautious approach for long-term investors.
コミュニティ
もっと見る ↗
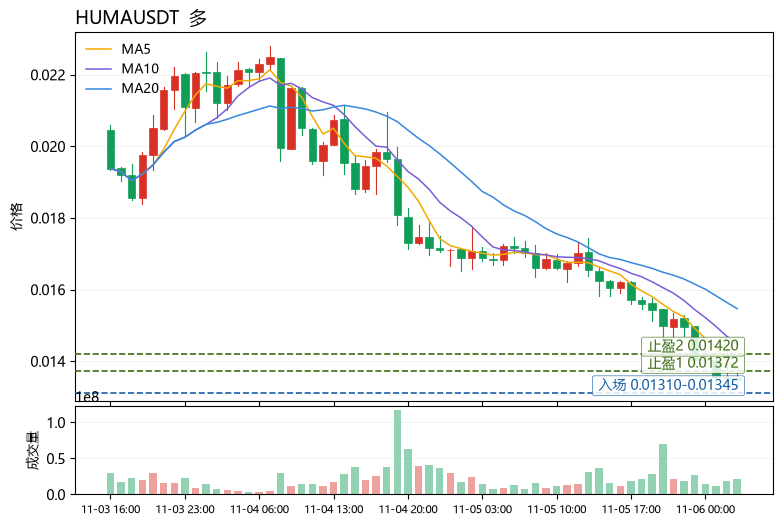
Oversold does not mean a bottom—this is one of the most common pitfalls in technical trading. $HUMA dropped over 20% in 24 hours, but the moving average structure remains bearish, with MA5=0.01372 below MA20=0.01547. Price is hugging the lower Bollinger Band at 0.01313, RSI at just 21.1 has entered oversold territory, and the MACD histogram at -0.0001223 remains negative but convergence signs need monitoring. The funding rate of -0.2801% indicates crowded shorts, leaving room for a squeeze rebound, but it is not advisable to bottom-fish heavily before the trend reverses. For execution, consider a light long position: entry reference 0.01310–0.01345, near the lower Bollinger Band, as this level combines oversold support with negative funding rate squeeze expectations; take-profit 1 at 0.01372 (MA5 resistance, first target for RSI recovery); take-profit 2 at 0.01420 (prior congestion zone, near MA10 recovery area); stop-loss at 0.01285 (if price breaks below the lower Bollinger Band and RSI continues to flatten, the rebound thesis is invalidated). Fear and Greed Index at 50 is neutral, market sentiment is not extreme, and rebound strength needs volume confirmation. Also watch: $TRX with amplitude of only 1.57% and RSI 42.5 showing relative resilience; $MUB RSI 29.1 is similarly oversold but the decline has not stopped, weaker than HUMA in trading value. (Personal views only, for reference, not investment advice. Futures risk is extremely high, please strictly control position size.) [Data] Pair: HUMAUSDT Direction: Long Entry: 0.01310-0.01345 Take-profit 1: 0.01372 Take-profit 2: 0.01420 Stop-loss: 0.01285
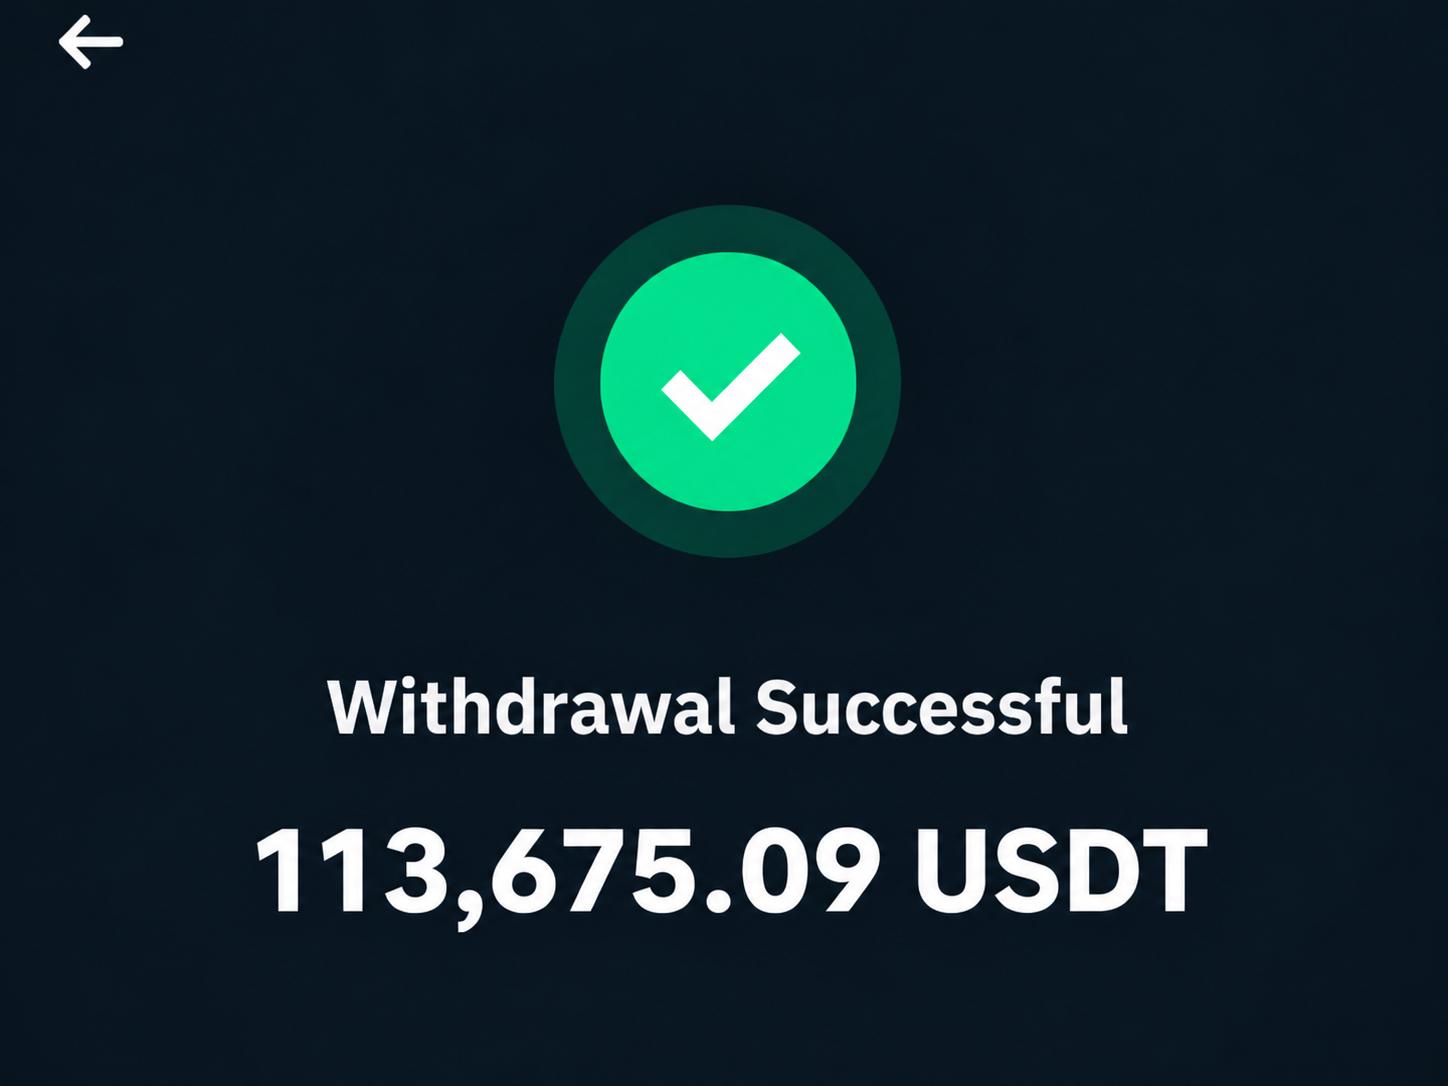
もっと見る$HUMA $PWT $AIAV For a long time, I kept wondering if there was a real opportunity that could genuinely change my financial situation. Then I found Ãlyssa Tan, and everything started to change. With her guidance and signals, I made over $113,000, and that alone changed my life for good. Ãlyssa taught me discipline, confidence, and how to approach the crypto market with a better mindset. The results I've achieved have completely changed my life. I'm truly grateful I took that first step. If you're still sitting on the sidelines, don't let fear stop you from exploring new opportunities. Thank you, Ãlyssa Tan, for making such a positive impact on my journey.
もっと見る
$HUMA dropped 24% in 24 hours. I entered at 0.021, now it's 0.0171, and my account took a hit. At the time, I saw volume surge to 54M and thought there was money stepping in, but 0.0226 turned out to be the top, and it only paused at 0.0164. While holding, my mindset was betting on a bounce, and the more it fell, the less I wanted to cut losses — classic stubborn holding. One lesson: don't guess the bottom during a high-volume decline; wait for a stabilization signal. At this level, those without a position shouldn't rush to buy; consider waiting for a reclaim of 0.018. If you're holding, 0.0164 is the last line — if it breaks, reduce, don't hold stubbornly like I did. Set stop loss at 0.016, take profit first at 0.019, position size no more than 20%. Did you catch this wave? #WeeklyCheckIn
もっと見る$HUMA $BEAM $APR I made $700,000 in profit yesterday, trading with the help of Craig's signals. It was an incredible milestone, and I cannot talk about the experience without acknowledging the guidance and market insights I have received from Craig One thing that makes Craig's approach stand out to me is the importance of timing, patience, and strategy. His signals have helped me pay closer attention to potential entry and exit points while understanding why proper risk management should never be ignored. Yesterday's $700K result was particularly exciting, but I understand that every trade carries risk and that past results cannot guarantee future performance. I would always encourage anyone exploring trading signals to understand the strategy, verify the analysis, and manage their capital responsibly.
もっと見る関連記事
- How to Rebalance a Concentrated Stock Portfolio in 2026: Mag7 Drift, Tax-Aware Trims, and Practical Rebalance a concentrated stock portfolio in 2026: Mag7 drift risk, 5pp bands, tax-aware trims, RSP/IWM diversifiers, and single-name caps.
- Small Cap Stocks Investing Guide 2026: Russell 2000, Fed Hikes, and the Financing TradeSmall-cap stocks investing guide 2026: Russell 2000 vs S&P, IWM rate sensitivity, floating-rate debt, Fed hikes, valuation discounts, and a practical checklist.
- Santa Claus Rally and the Year-End Stock Market: Investor Guide for Late 2026Santa Claus rally explained: 7-day window stats since 1950, Nov–Dec seasonality, post-midterm 2026 setup, and a risk-managed year-end investing playbook.
本ページは調査目的であり、投資助言ではありません。モデルは誤ることがあります。過去の実績は将来の成果を保証しません。