
B
Bull
Bull · 25%HLLY
$1.98
シナリオ価格
$2.920
-0.049 (-1.68%)終値時点
Holley, Inc. designs, manufactures, and distributes high-performance automotive aftermarket products to car and truck enthusiasts in the United States, Canada and Europe. It owns and manages a portfolio of brands, catering to a diverse community of enthusiasts passionate about the customization and performance of their vehicles. It is a manufacturer of a diversified line of performance automotive products, including carburetors, fuel pumps, fuel injection systems, nitrous oxide injection systems, superchargers, exhaust headers, mufflers, engine tuners and automotive performance plumbing products. It also manufactures exhaust products as well as shifters, converters, transmission kits, transmissions, tuners and automotive software. Its products are designed to enhance street, off-road, recreational and competitive vehicle performance through increased horsepower, torque and drivability. Its brands include Holley, Holley EFI, MSD, Simpson, Flowmaster, EDGE, and Accel, among others.
Holley Inc is currently a hold due to mixed signals in its financial performance and analyst ratings. The current price is $2.92, with a forward P/E of 6.22 indicating potential undervaluation. However, the RSI is at 42.46, suggesting it is nearing oversold territory but not yet a strong buy signal. The recent 5-day change is -5.50%, indicating short-term weakness, while the year-to-date change is -29.47%, reflecting broader market challenges. The main risk is the missed revenue expectations in Q2, which was only $172 million, slightly below forecasts, raising concerns about future growth.
Scenario prices are the last monthly forecast band of the current year. Probabilities are fixed model weights (25 / 50 / 25), not guarantees.

Holley (HLLY) Q2 2026 Earnings Call Insights and Outlook
Holleypress Q2 Earnings Beat Expectations with $0.20 EPS
Holley Performance Brands Reports Strong Q2 Results with Core Growth
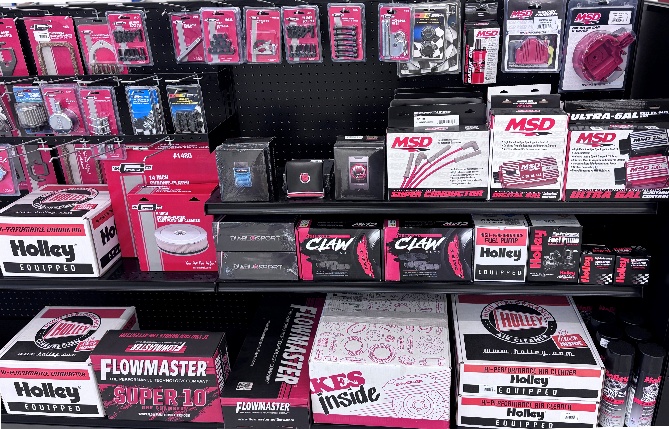
Holley Expands Retail Partnership for Enhanced Product Access

Holley Expands Retail Partnership to Enhance Product Access
Holley, Inc. designs, manufactures, and distributes high-performance automotive aftermarket products to car and truck enthusiasts in the United States, Canada and Europe. It owns and manages a portfolio of brands, catering to a diverse community of enthusiasts passionate about the customization and performance of their vehicles. It is a manufacturer of a diversified line of performance automotive products, including carburetors, fuel pumps, fuel injection systems, nitrous oxide injection systems, superchargers, exhaust headers, mufflers, engine tuners and automotive performance plumbing products. It also manufactures exhaust products as well as shifters, converters, transmission kits, transmissions, tuners and automotive software. Its products are designed to enhance street, off-road, recreational and competitive vehicle performance through increased horsepower, torque and drivability. Its brands include Holley, Holley EFI, MSD, Simpson, Flowmaster, EDGE, and Accel, among others. It operates in the Consumer Cyclicals sector (MOTOR VEHICLE PARTS & ACCESSORIES industry).
Holley Inc is currently a hold due to mixed signals in its financial performance and analyst ratings. The current price is $2.92, with a forward P/E of 6.22 indicating potential undervaluation. However, the RSI is at 42.46, suggesting it is nearing oversold territory but not yet a strong buy signal. The recent 5-day change is -5.50%, indicating short-term weakness, while the year-to-date change is -29.47%, reflecting broader market challenges. The main risk is the missed revenue expectations in Q2, which was only $172 million, slightly below forecasts, raising concerns about future growth.
本ページは調査目的であり、投資助言ではありません。モデルは誤ることがあります。過去の実績は将来の成果を保証しません。