
A
Alcista
Alcista · 25%AAL
$11.94
Precio del escenario
$11.790
-0.670 (-5.68%)Al cierre
American Airlines Group Inc. is a holding company. Its primary business activity is the operation of a major network air carrier, providing scheduled air transportation for passengers and cargo through its hubs in Charlotte, Chicago, Dallas/Fort Worth, Los Angeles, Miami, New York, Philadelphia, Phoenix and Washington, D.C. and partner gateways, including in London, Doha, Madrid, Seattle/Tacoma, Sydney and Tokyo, among others. Together with its regional airline subsidiaries and third-party regional carriers operating as American Eagle. Its cargo division provides a wide range of freight and mail services, with facilities and interline connections available across the globe. It operates approximately 1,013 mainline aircraft supported by its regional airline subsidiaries and third-party regional carriers, which together operate an additional 567 regional aircraft. Its subsidiaries include American Airlines, Inc., Envoy Aviation Group Inc., PSA Airlines, Inc. and Piedmont Airlines, Inc.
American Airlines Group Inc is currently priced at $12.76, which is below the average analyst price target of $14.75. However, the stock has a low RSI of 32.291, indicating it is oversold, but it also has a high forward P/E ratio of 5.3191, suggesting potential undervaluation. The main risk is the ongoing high fuel prices, which have impacted profit forecasts significantly, with analysts noting that fuel costs are near $4.30-$4.50 per gallon.
Wells Fargo
$14
2026-10-06
Wells Fargo
2026-10-06
Precio objetivo
$14
BofA
$15
2026-10-05
BofA
2026-10-05
Precio objetivo
$15
TD Cowen
$15
2026-10-02
TD Cowen
2026-10-02
Precio objetivo
$15
Goldman Sachs
$11
2026-10-02
Goldman Sachs
2026-10-02
Precio objetivo
$11
BMO Capital
$19
2026-09-28
BMO Capital
2026-09-28
Precio objetivo
$19
Los precios por escenario son la última banda de previsión mensual del año en curso. Las probabilidades son pesos fijos del modelo (25 / 50 / 25), no garantías.
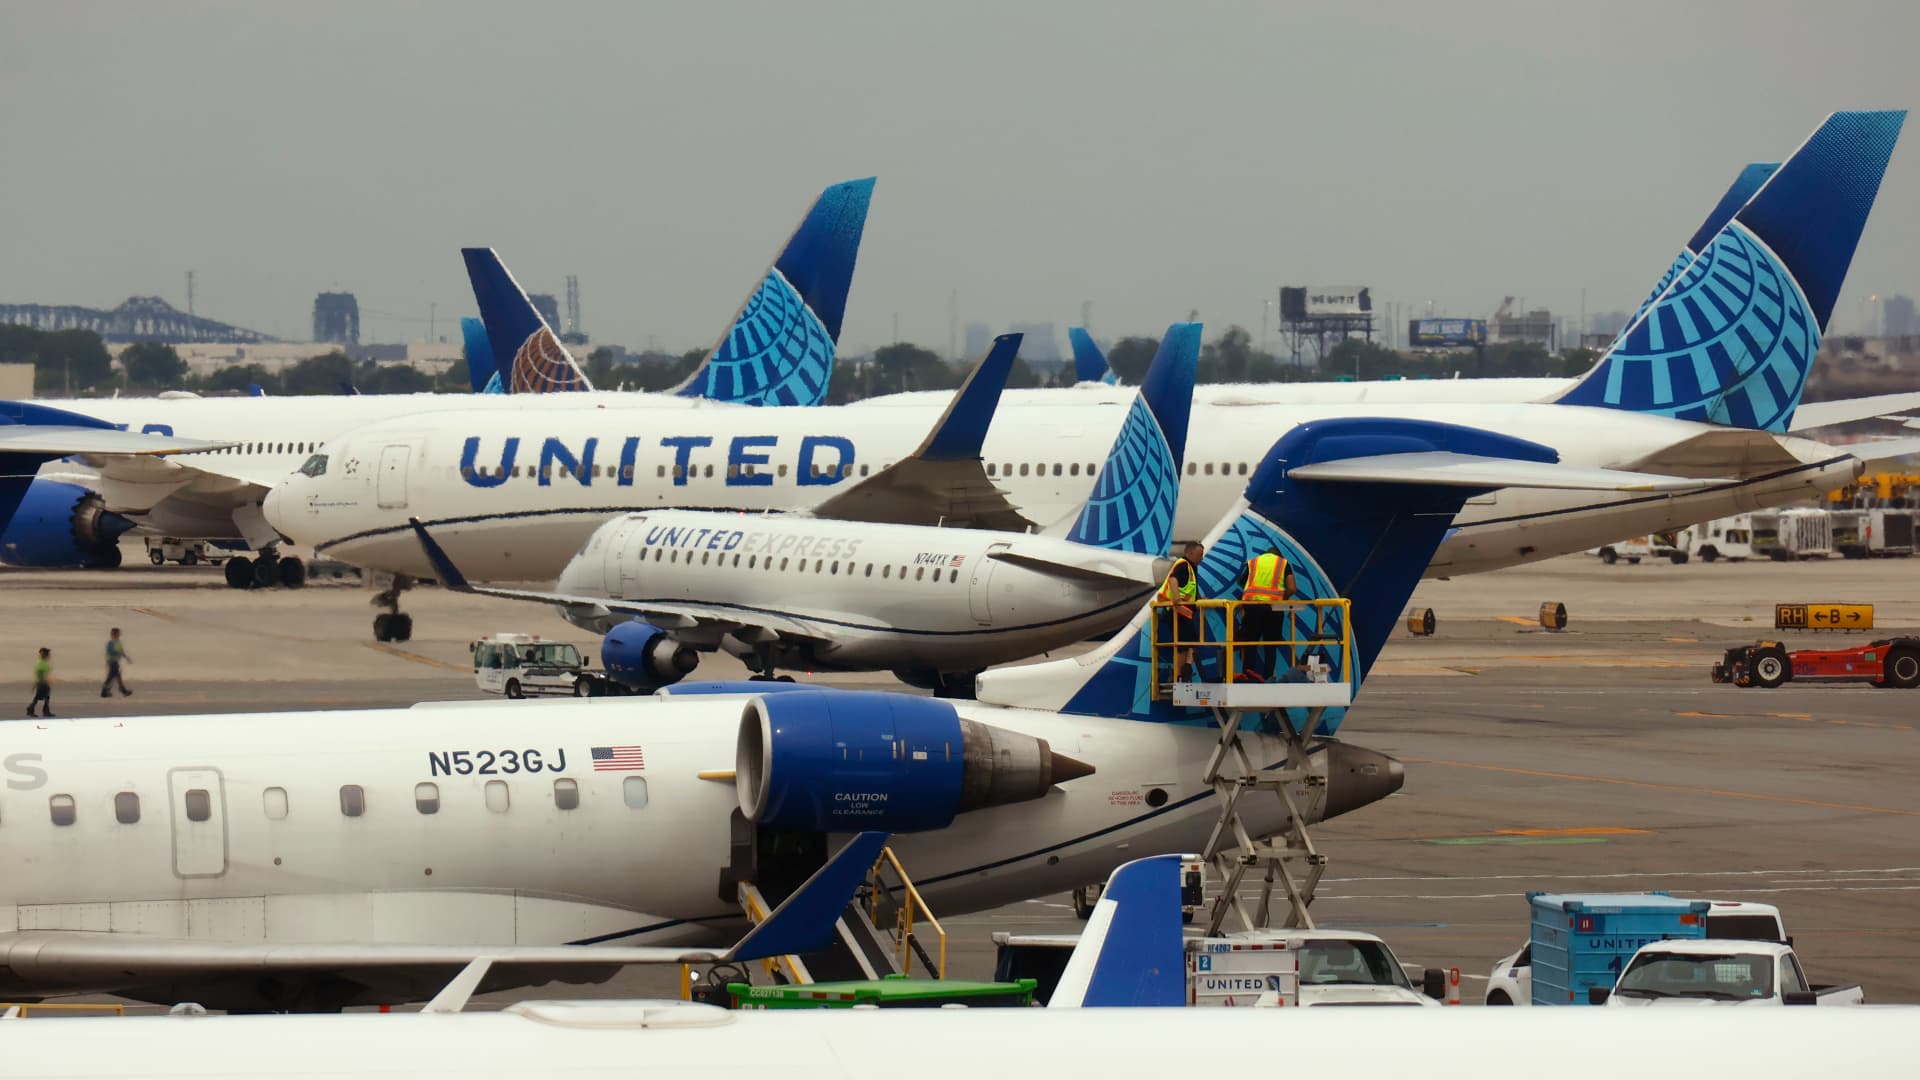
United Airlines Alters Elite Status Criteria for 2027

United Airlines Revises Elite Membership Criteria

Cathie Wood Reduces SpaceX Holdings: Implications for Investors

Trump Promises No Attack on Iran Before Elections

American Airlines to Fully Deploy Starlink Across Fleet
American Airlines Group Inc. is a holding company. Its primary business activity is the operation of a major network air carrier, providing scheduled air transportation for passengers and cargo through its hubs in Charlotte, Chicago, Dallas/Fort Worth, Los Angeles, Miami, New York, Philadelphia, Phoenix and Washington, D.C. and partner gateways, including in London, Doha, Madrid, Seattle/Tacoma, Sydney and Tokyo, among others. Together with its regional airline subsidiaries and third-party regional carriers operating as American Eagle. Its cargo division provides a wide range of freight and mail services, with facilities and interline connections available across the globe. It operates approximately 1,013 mainline aircraft supported by its regional airline subsidiaries and third-party regional carriers, which together operate an additional 567 regional aircraft. Its subsidiaries include American Airlines, Inc., Envoy Aviation Group Inc., PSA Airlines, Inc. and Piedmont Airlines, Inc. It operates in the Industrials sector (AIR TRANSPORTATION, SCHEDULED industry).
American Airlines Group Inc is currently priced at $12.76, which is below the average analyst price target of $14.75. However, the stock has a low RSI of 32.291, indicating it is oversold, but it also has a high forward P/E ratio of 5.3191, suggesting potential undervaluation. The main risk is the ongoing high fuel prices, which have impacted profit forecasts significantly, with analysts noting that fuel costs are near $4.30-$4.50 per gallon.
18 analysts cover AAL: 9 rate it Buy, 7 Hold and 2 Sell. The average price target is 17.93.

American Airlines, United Airlines, Delta Air Lines, and JetBlue Airways said customers can change their flights for a host of airports in the New York City area, Boston and smaller New England airports, without paying a change fee or difference in fare if they can fly anytime before the middle of next week. The potential weekend disruptions come after an equipment outage on Monday forced carriers to cancel hundreds of flights bound for the New York area and Philadelphia $AAL $UAL $DAL
Mostrar másEsta página es solo para investigación y no constituye asesoramiento de inversión. Los modelos pueden equivocarse. El rendimiento pasado no garantiza resultados futuros.