

Amazon Q3 2026 Deep Dive: AWS Hits a $184B Run Rate While TTM FCF Bleeds $42.4B—Why the Tape Sold a
Amazon Q3 2026 sell-side deep dive: AWS +39% to $46B ($184B run rate), record 13.9% op margin, TTM FCF -$42.4B after AI CapEx, and why AMZN fell ~6–7% after hou

Amazon Q3 2026 Deep Dive: AWS Hits a $184B Run Rate While TTM FCF Bleeds $42.4B—Why the Tape Sold a Record-Margin Print
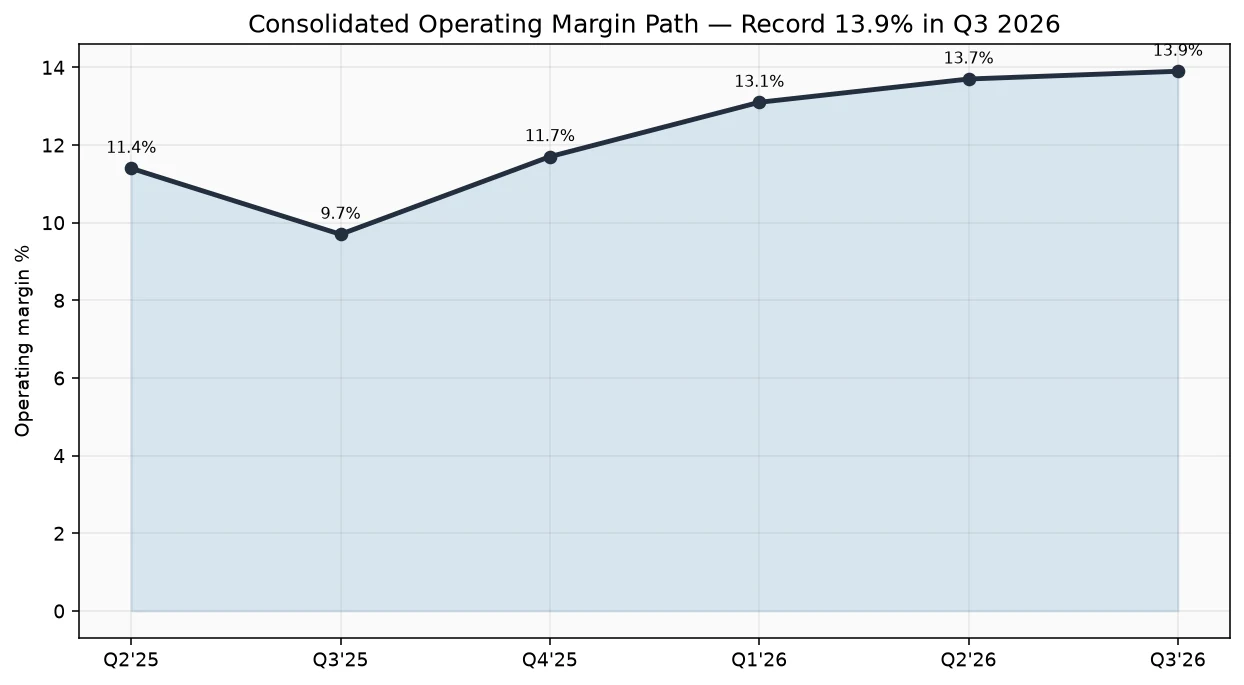
After the close on October 29, 2026, Amazon (NASDAQ: AMZN) handed Wall Street a print that should have felt like a victory lap on any other hyperscaler tape: operating income $28.1B, a 13.9% operating margin the company called its highest ever, and AWS +39.3% to $46.0B—a $184B annualized revenue run rate and the segment's fastest growth in nearly five years. Instead, shares slid roughly 6%–7% in extended trading (CNBC cited more than 6%; AP News about 7%). The market did not argue that AWS is broken. It argued with the cash ledger, the modest top-line miss, and a CEO who calmly said 2027 CapEx will be "meaningfully more" than this year's already-reaffirmed ~$220B.
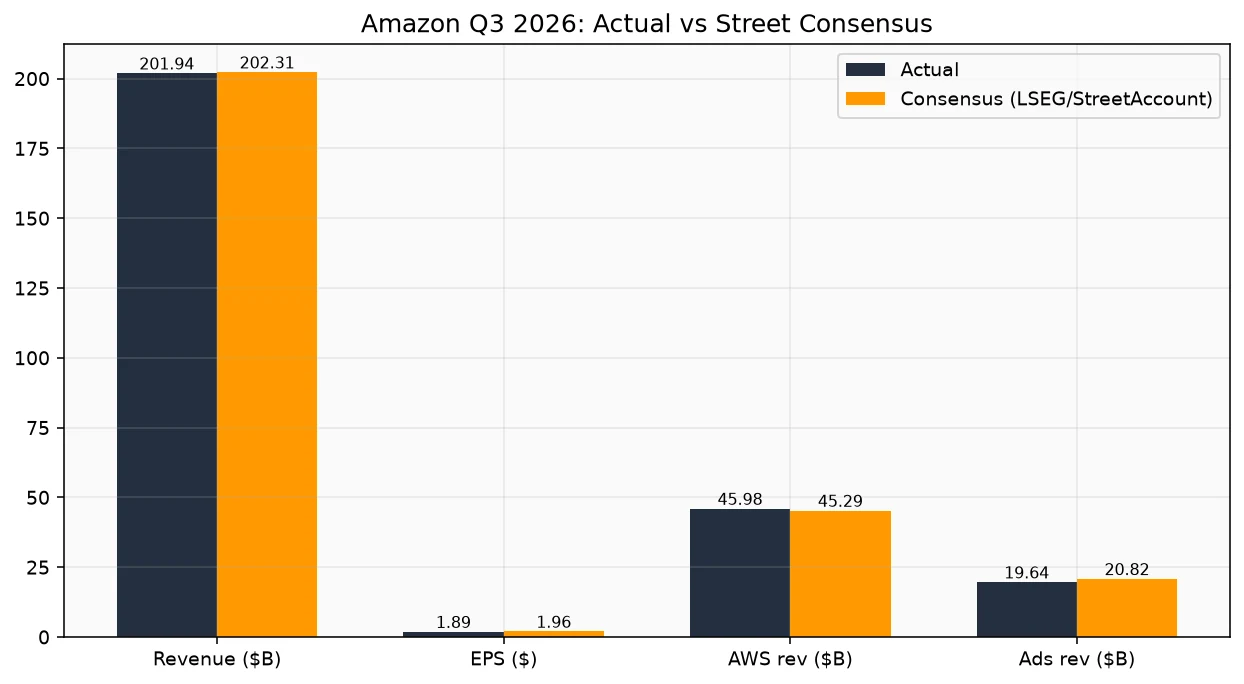
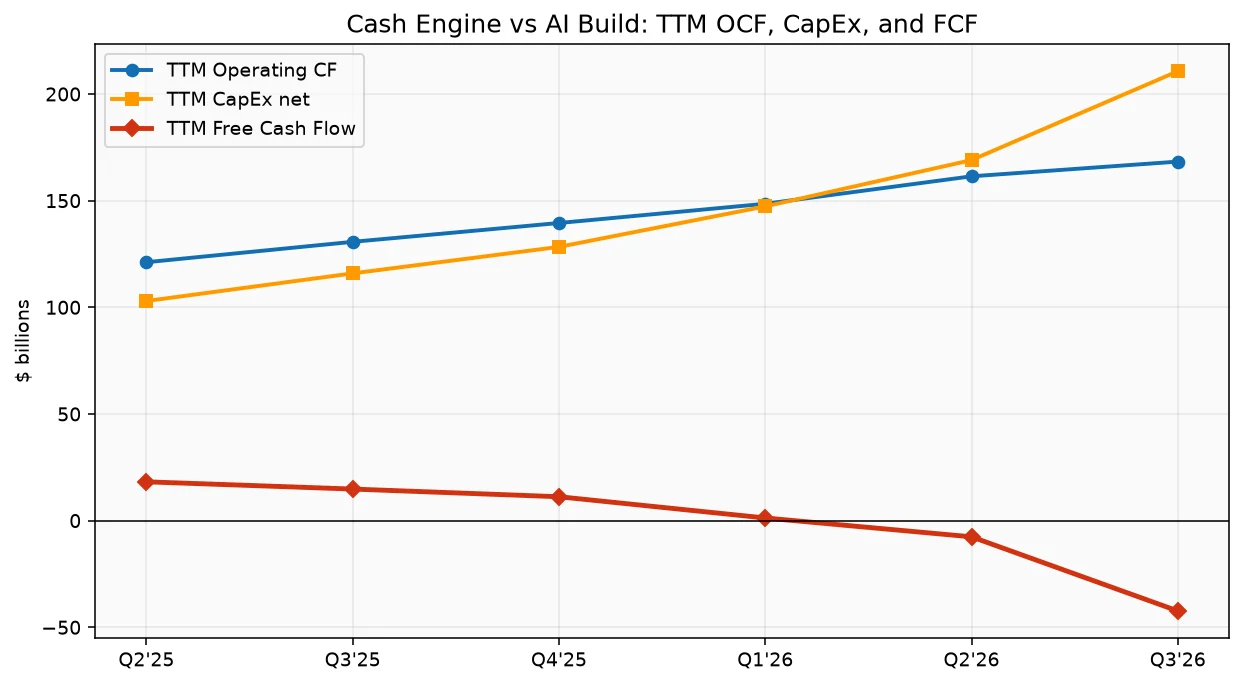
Three numbers framed the emotion. Diluted EPS printed $1.89 versus LSEG's ~$1.96. Net sales landed at $201.94B versus LSEG's ~$202.31B—a rounding-error miss that still counts as a miss on a mega-cap night. And trailing-twelve-month free cash flow swung to an outflow of $42.4B, versus a +$14.8B inflow a year earlier, after net CapEx jumped by $94.8B YoY, primarily for AI. Same week, Alphabet had already suffered its worst trading day ever on negative FCF and Search soft spots. Amazon's after-hours gap said the AI-capex purge was not finished—it had simply found a bigger cash sink with a better Cloud story attached.
This note reads the print the way the tape did—as a conflict story—then rebuilds the mechanism from Amazon's October 29, 2026 IR release, the consolidated statements published with that release, and the Q3 2026 earnings call / secondary transcripts (Jassy remarks via CNBC, Business Insider, stockanalysis). Consensus anchors are LSEG and StreetAccount as cited by CNBC. Numbers below are from the primary IR release unless attributed to a secondary source.
1. What the Market Was Afraid Of
Heading into the print—on a tape that had just watched Alphabet wipe out roughly $500B of market value—the fear was not "does Amazon still grow?" It was a braid of four anxieties:
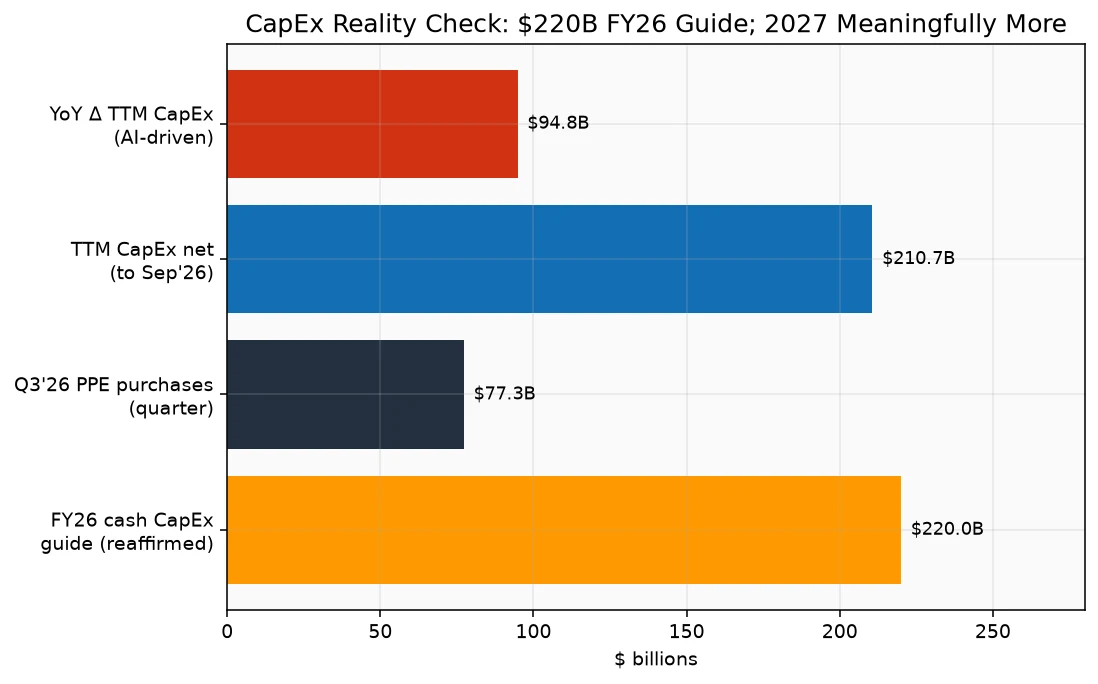
- AI CapEx without a clean FCF floor — FY26 cash CapEx already sat at ~$220B; any hint that 2027 steps higher without a matching FCF path invites multiple compression across the hyperscaler complex.
- Retail and ads timing optics — Prime Day shifted into Q2 for most large countries in 2026 (vs entirely in Q3 in 2025), creating a known ~400 bps growth headwind in Q3 that still left online stores and advertising looking soft versus StreetAccount.
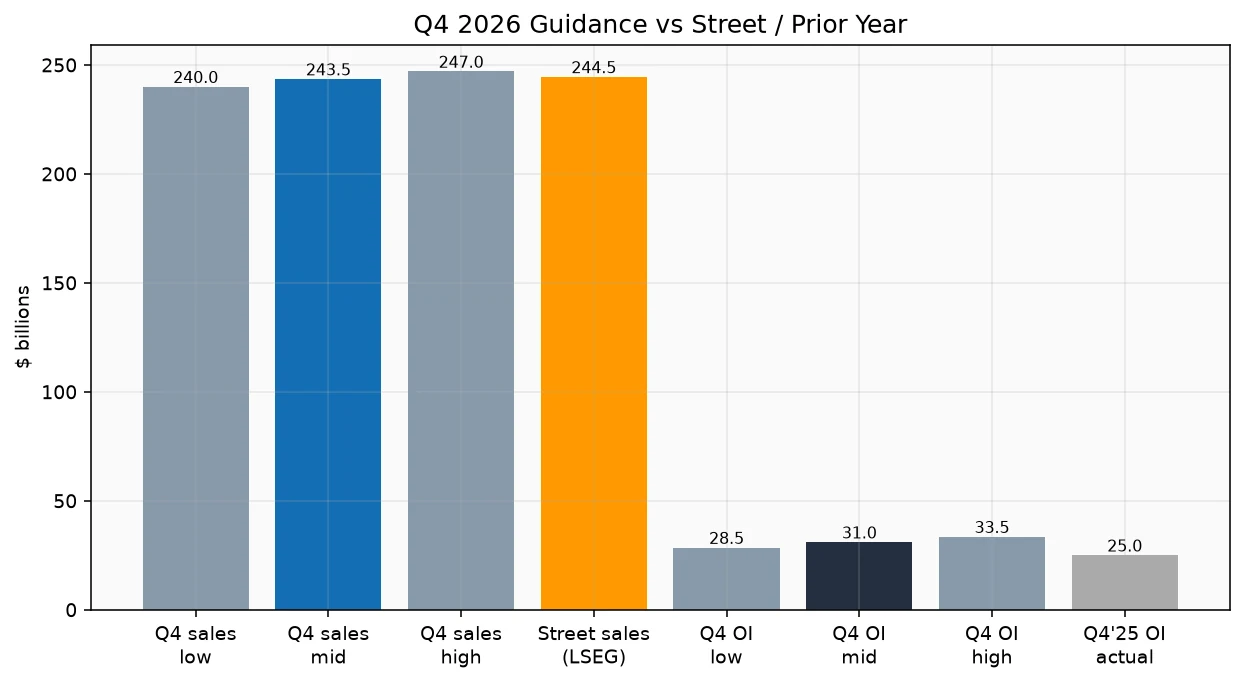
- Guidance that refuses to clear the emotional bar — Q4 sales guide $240–$247B (midpoint below LSEG's ~$244.5B per CNBC) after a quarter that already missed by a hair.
- Balance-sheet industrialism — long-term debt rose to $173.1B from $65.6B at year-end 2025; PPE net jumped to $508.9B from $357.0B—the AI build no longer looks optional.
Pre-print constructive frames (Investing.com / Ali Merchant, Oct 29) still had Mizuho Outperform $330, UBS Buy $348, BMO Outperform $380, and Truist highlighting Bedrock / AgentCore momentum. The after-hours gap said those price targets can coexist with a tape that refuses to pay for CapEx until FCF stops screaming.
2. Scorecard: Record Margin, Street Misses Where It Hurt
| Metric | Q3 2026 actual | Benchmark / prior year | Read-through |
|---|---|---|---|
| Net sales | $201.944B | LSEG ~$202.31B; PY $180.169B | Slight miss; +12% (+13% ex-FX); ~+400 bps higher ex Prime Day shift |
| Diluted EPS | $1.89 | LSEG ~$1.96; PY $1.95 | Miss; NI $20.685B vs PY $21.187B (Anthropic gain in PY) |
| Operating income | $28.076B | PY $17.422B | +61%; margin 13.9% (record) |
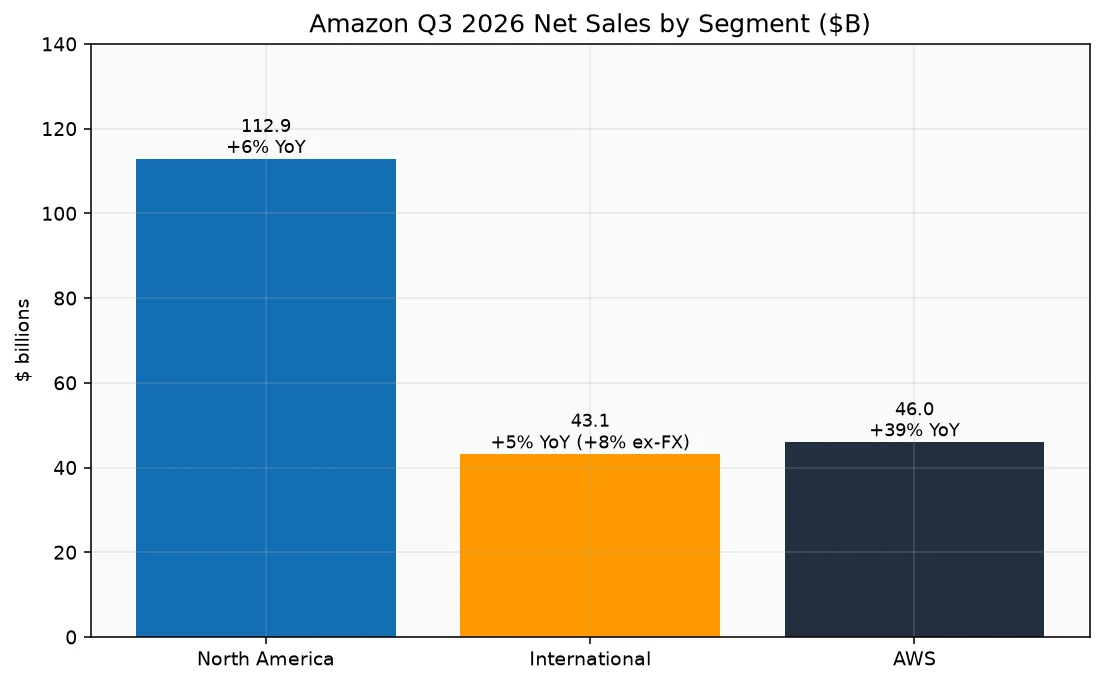
| North America sales | $112.852B | PY $106.267B | +6% YoY |
| International sales | $43.108B | PY $40.896B | +5% (+8% ex-FX) |
| AWS sales | $45.984B | StreetAccount ~$45.29B; PY $33.006B | Beat; +39%; $184B ARR |
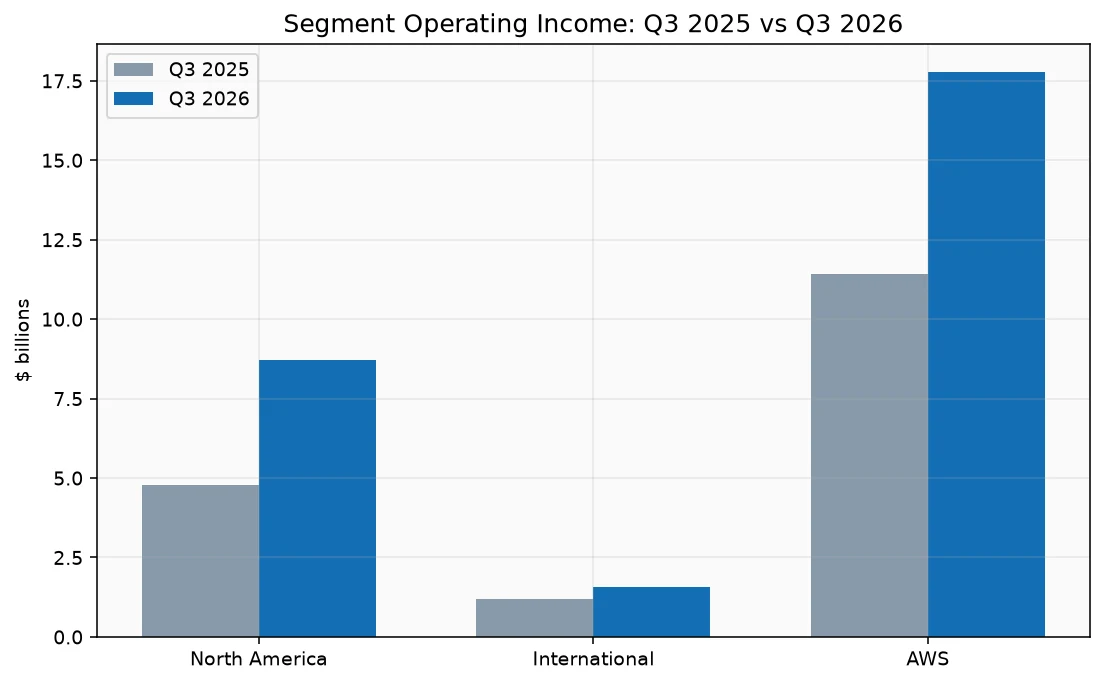
| NA operating income | $8.723B | PY $4.789B | Margin repair story |
| Intl operating income | $1.580B | PY $1.199B | Still thin vs scale |
| AWS operating income | $17.773B | PY $11.434B | Margin ~38.7% of AWS sales |
| Advertising services | $19.637B | StreetAccount ~$20.82B; PY $17.703B | Miss; +11% (+12% ex-FX) |
| Online stores | $68.470B | StreetAccount ~$69.68B | Soft; +2% YoY |
| TTM operating cash flow | $168.3B | PY TTM $130.7B | +29% — engine intact |
| TTM CapEx (net) | $210.657B | PY TTM $115.903B | +82% |
| TTM free cash flow | -$42.357B | PY TTM +$14.788B | The kill shot (−386% YoY) |
| Q3 PPE purchases | $77.259B | FactSet ~$58.7B (CNBC); PY $35.095B | Well above Street spend |
| FY26 cash CapEx guide | ~$220B | Reaffirmed | And 2027 "meaningfully more" (Jassy) |
| Q4 sales guide | $240–$247B | LSEG ~$244.5B midpoint context | Midpoint soft vs Street |
| Q4 OI guide | $28.5–$33.5B | PY Q4 $24.977B | Still up YoY at midpoint |
| Long-term debt | $173.125B | YE25 $65.648B | Leverage up with AI funding |
| Employees | 1,638,000 | PY 1,578,000 | About +4% YoY |
Trap 1: Celebrating record op margin without noticing FCF went deeply negative on the same CapEx that is funding the AWS beat. Trap 2: Reading EPS $1.89 as earnings deterioration without separating the $9.5B pre-tax Anthropic gain that inflated Q3 2025 non-operating income. Trap 3: Treating the revenue miss as demand collapse when Prime Day calendar math and FX (~$0.9B unfavorable) explain a large part of the optics—and still leave ads and online stores short of StreetAccount.
3. Retail and Ads: Share Gains With Ugly Comps
North America sales grew only 6% to $112.9B, International 5% to $43.1B (+8% ex-FX). That looks sleepy until you put Prime Day back on the table: management said excluding the Q2-vs-Q3 event shift, Q3 YoY growth would have been about 400 basis points higher. Online stores +2% to $68.5B missed StreetAccount's ~$69.7B. Third-party seller services held at $46.5B. Advertising +11% to $19.6B (+12% ex-FX) missed StreetAccount's ~$20.8B—and management explicitly blamed timing anomalies tied primarily to Prime Day, while guiding Q4 advertising growth to the high teens.
The bull mechanism is operational, not top-line glamorous: North America operating income nearly doubled to $8.7B from $4.8B; International OI rose to $1.6B from $1.2B. Same-day / overnight Prime deliveries topped 1.5B items in the quarter; Amazon Now is in 450+ towns and cities with items ordered up 10x YoY; Grocery / everyday essentials grew about 3x faster than the rest of the store and were about half of units. Jassy's line—broader selection and speedier delivery capturing retail share with improving margins—is the retail thesis in one sentence. The bear reply: share gains that print a Street miss on ads and online stores still get sold when CapEx is the overnight story.
4. AWS: Fastest Growth in Nearly Five Years—and the Only Story That Almost Saved the Night
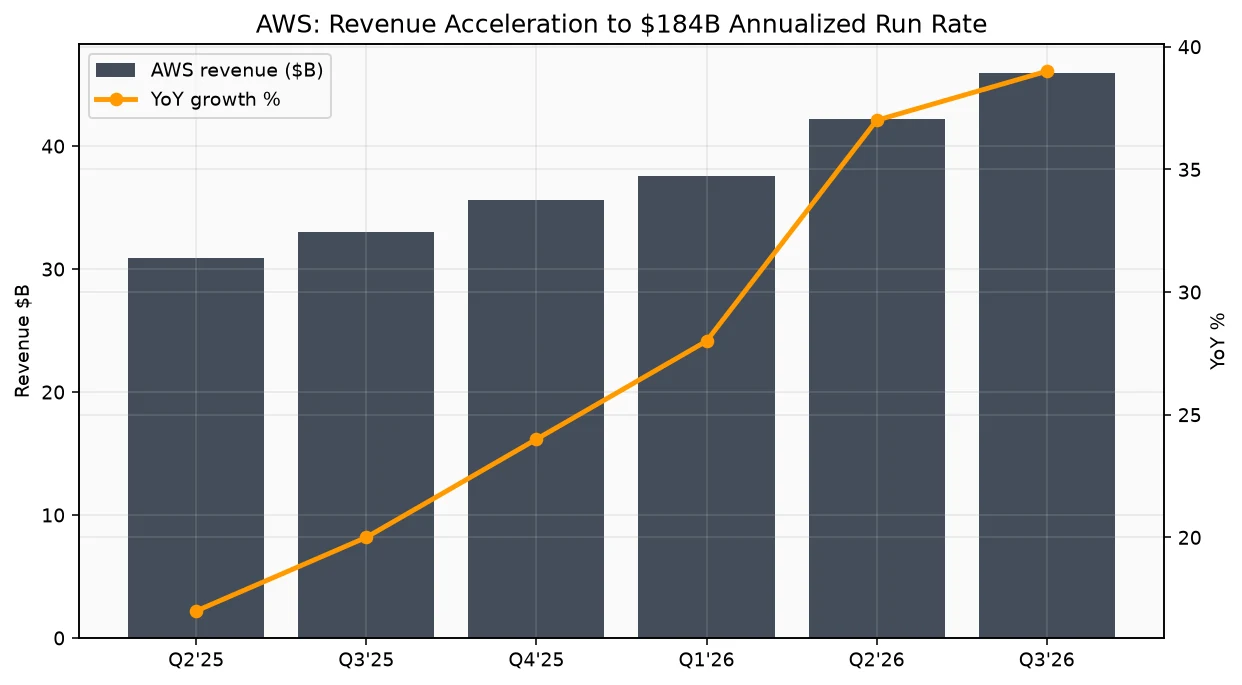
AWS is the other pole. Revenue $45.984B (+39%), annualized run rate $184B, operating income $17.773B (margin roughly 38.7% of AWS sales). Six consecutive quarters of acceleration on the ex-FX growth path (from the mid-teens in mid-2025 to 39% now) is the chart the bulls will screenshot. Jassy in the release: projected AWS revenue growth rates of over 40% in both 2027 and 2028, and the longer-horizon claim that Amazon may have two trillion-dollar revenue businesses in the next 5–10 years (retail complex + AWS).
Call / secondary texture that matters:
- Bedrock: Fortune 500 spend nearly 7x YoY; total token volume nearly 17x YoY; framed as AWS's fastest-growing multi-billion-dollar service ever. OpenAI models added; Kimi, GLM, SpaceXAI (Grok) managed versions on Bedrock.
- AgentCore: tens of thousands of customers; agents deployed in Q3 were 2x the prior three quarters combined.
- Trainium / chips: Jassy (CNBC): chips business continues to grow triple-digit percentages YoY; Trainium external availability planned late 2027.
- Platform flywheel (Jassy call framing via transcript excerpts): leading functionality leads customers to run apps/data on AWS; production inference wants to sit near that data; AI demand drives core AWS demand (RL, post-training, tool use); reinvestment follows. Explicit contrast with primarily hosting GPUs or renting short-term data center capacity.
Mechanism: This is why AWS can beat StreetAccount and still not save the stock. The Street is not debating whether AWS is growing. It is debating whether a $220B (and rising) CapEx program is priced like a platform annuity or like a cash incinerator until TTM FCF turns.
5. The Risk Ledger: CapEx, FCF, Debt, and Guidance
| Risk | What we know | Why it matters |
|---|---|---|
| TTM FCF crater | -$42.4B vs +$14.8B PY; second consecutive negative TTM print (Q2 was -$7.6B) | Multiple compression across AI spenders |
| CapEx trajectory | FY26 ~$220B reaffirmed; Q3 PPE $77.3B vs FactSet ~$58.7B; 2027 "meaningfully more" | Open-ended industrial program |
| Memory / input-cost inflation | Pre-print commentary flagged higher memory costs lifting CapEx plans | CapEx can rise without proportional near-term revenue |
| Q4 guide optics | Sales $240–$247B; midpoint soft vs LSEG ~$244.5B; FX -60 bps | Holiday quarter must clear a skeptical bar |
| Ads / online stores Street misses | Ads $19.6B vs ~$20.8B; online $68.5B vs ~$69.7B | If Q4 ads high teens disappoints, retail narrative breaks |
| Leverage and PPE | LT debt $173B; PPE net $509B | Financing the build is no longer free-option CapEx |
| Non-op / investment marks | Q3'25 had $9.5B Anthropic pre-tax gain; Q3'26 other income (expense) net -$0.7B | EPS comps are noisy |
| Leo / Zoox / devices execution | Leo initial service still this year; Zoox paid rides in Las Vegas; 34 new devices | Side-option narrative; not Q4 P&L salvation |
The ledger's center of gravity is CapEx to FCF to multiple, not AWS growth. That is the same zip code as Alphabet's week—and the reason a record operating margin could not buy a bid after hours.
6. Long vs Short Debate (Named Sources)
The short / skeptic case (tape + CapEx hawks): After Alphabet's historic drawdown, Amazon's -$42.4B TTM FCF and Jassy's "meaningfully more" 2027 spend are one continuous story: hyperscalers are asking equity holders to fund an industrial AI build whose payback is multi-year while quarterly FCF goes the wrong way. The slight revenue/EPS miss and soft Q4 midpoint are permission for the tape to sell first. AP's framing—misses, cautious Q4 outlook, shares down about 7% after hours—captures that mood without needing a complicated short thesis.
The long / platform case (Jassy + pre-print bulls): AWS at 39% growth on a $184B run rate with >40% growth projected for 2027–28 is exactly the proof point CapEx bulls wanted. Truist's pre-print focus on Bedrock and AgentCore (Investing.com) maps onto the release's 7x / 17x Bedrock metrics. Mizuho $330, UBS $348, BMO $380 Outperform/Buy frames say the stock was already being debated as cheap if AWS works. Jassy's flywheel language—and the claim of clear line of sight to attractive financial returns (CNBC)—is the management rebuttal: this is not GPU rental cosplay; it is a 10–20 year on-prem-to-cloud conversion plus inference attach.
Synthesis: Bears are not arguing AWS is fake. They are arguing the equity duration of CapEx is being forced onto shareholders faster than FCF can metabolize it. Bulls are arguing the same CapEx is buying AWS share and Trainium optionality that will show up as >40% AWS growth into 2028—and that record 13.9% company margins prove retail is not being sacrificed to fund the cloud.
7. Side Plots: Anthropic Marks, Leo, Zoox, Ads Agent, Hiring
Anthropic comp noise. Net income fell to $20.7B from $21.2B primarily because Q3 2025 included $9.5B pre-tax gains on Anthropic investments in non-operating income. Operating income tells the real operating story ($28.1B vs $17.4B).
Amazon Leo. Remains on track for initial service later in 2026; strategic agreement with AT&T as first major U.S. telecom to offer Leo connectivity to enterprise and public-sector customers.
Zoox. Paid robotaxi rides in Las Vegas; testing in San Diego and Houston; operating footprint cited across 12 U.S. cities.
Ads Agent / full-funnel campaigns. AI plans, executes, and optimizes sponsored plus display, video, and streaming TV from advertiser inputs. If Q4 ads really hit high-teens growth, this is part of the mechanism.
Labor and community optics. Plans to hire 300,000+ seasonal/part-time/full-time U.S. operations workers for the holidays; $1.5B+ to raise U.S. full-time ops minimum starting pay to $20/hour; $1B Built Together community investment around data-center regions.
8. Braid Into One Thesis
Amazon's Q3 2026 is a platform acceleration wrapped in a cash-flow indictment.
The acceleration is real: AWS +39%, $184B run rate, Bedrock and agents compounding, retail margins expanding to a company-record 13.9% operating margin, Q4 OI guided above last year's holiday quarter. The indictment is also real: TTM FCF -$42.4B, Q3 CapEx far above Street, FY26 $220B held, and 2027 guided higher in plain English.
The right interpretive frame is not that Amazon missed in a demand-collapse sense (Prime Day math and FX do real work; AWS beat). It is also not that Amazon guided poorly in an absolute sense (OI still up YoY). The right frame is:
October 29 asked whether equity holders will keep underwriting an AI industrial build that is already working in AWS revenue—but has not yet worked in free cash flow—on the same week Alphabet taught the tape what negative FCF feels like in a mega-cap multiple.
If AWS delivers the promised >40% growth into 2027–28 while TTM FCF troughs and turns, the after-hours -6% to -7% is noise. If CapEx keeps stepping up while ads and online stores stay soft versus Street and FCF stays deeply negative, the multiple compresses for fundamental reasons—not vibes.
9. Falsifiable Watchpoints
- TTM FCF path. Does -$42.4B mark a trough, or does another step-down arrive with 2027 CapEx?
- AWS growth vs guide narrative. Hold >40% for 2027–28 in subsequent language—or walk it back.
- Q4 advertising high teens. Cleanest near-term test that Prime Day timing was optics, not demand.
- Q4 sales vs $240–$247B and Street ~$244.5B. Holiday execution under a skeptical multiple.
- Trainium external timeline (late 2027) and chips triple-digit growth claims.
- Bedrock / AgentCore dollarization. Leading indicators must keep showing up as AWS mix and margin.
- Net leverage / debt issuance. Further large raises without FCF repair keep the industrial-program framing alive.
- Hyperscaler tape contagion. Amazon needs to look more like returns visibility than open-ended spend.
Sources
- Amazon.com IR Q3 2026 results (Oct 29, 2026): https://ir.aboutamazon.com/news-release/news-release-details/2026/Amazon-com-Announces-Third-Quarter-Results/
- Amazon Press Center Q3 2026 release
- CNBC Amazon Q3 2026 earnings coverage (LSEG/StreetAccount consensus; after-hours move; CapEx vs FactSet; Jassy comments)
- CNBC after-hours movers Oct 29, 2026
- AP News Amazon Q3 2026 miss / outlook coverage
- Investing.com pre-print analyst target notes (Mizuho/UBS/BMO; Truist Bedrock notes)
- Q3 2026 earnings call transcript excerpts (stockanalysis / company webcast)
This article is for informational and educational purposes only and is not investment advice. Figures are sourced from company primary disclosures and reputable wires as of the report date; consensus figures can differ by aggregator.
FAQs
Did Amazon miss revenue and EPS in Q3 2026?
Yes. Net sales were $201.94B versus LSEG ~$202.31B and diluted EPS $1.89 versus LSEG ~$1.96, per CNBC/LSEG framing, while operating income rose 61% to a record 13.9% margin.
How fast did AWS grow in Q3 2026?
AWS revenue rose 39.3% to $45.984B, a $184B annualized run rate and the segment's fastest growth in nearly five years, with operating income of $17.773B.
Why did AMZN fall after hours on October 29, 2026?
Shares dropped roughly 6%–7% after a slight sales/EPS miss, TTM free cash flow of -$42.4B, CapEx well above Street, and Jassy saying 2027 CapEx will be meaningfully more than the ~$220B FY26 guide.
What is Amazon’s FY2026 CapEx guidance?
Management reaffirmed cash CapEx of about $220B for 2026 and said 2027 CapEx will be meaningfully more, while Q3 PPE purchases were $77.3B.
Was free cash flow negative?
Yes. Trailing-twelve-month free cash flow was -$42.357B versus +$14.788B a year earlier, after net CapEx jumped by about $94.8B year over year, primarily for AI.
Related articles
- Stock Market Surges After 2026 Midterms: What the Democratic Sweep Means for Your PortfolioThe stock market rallied after Democrats won the 2026 midterms. Discover what the election means for investors, tech stocks, and the S&P 500 outlook.
- Stock Market Surges After 2026 Midterms: What the Democratic Sweep Means for Your PortfolioThe stock market rallied after Democrats won the 2026 midterms. Discover what the election means for investors, tech stocks, and the S&P 500 outlook.
- Oil Prices Surge Above $105 Amid US-Iran Conflict: Energy Investment Opportunities in November 2026Oil prices climb past $105 as US strikes Iran's Qeshm Island. Discover energy investment opportunities, top oil stocks, and market outlook for November 2026.
- Moderna Stock Skyrockets 177% on Landmark Cancer Vaccine Breakthrough: Investment AnalysisModerna (MRNA) stock jumped 177% after Phase 3 melanoma vaccine success with Merck. Analysis of the breakthrough, market impact, and investment outlook for 2026.
- NVIDIA Earnings August 2026: AI Chip Leader's Q2 Preview & Investment OutlookNVIDIA reports Q2 FY27 earnings on August 26, 2026. Wall Street expects $93-95B revenue driven by AI accelerator demand and Blackwell chip ramp. Stock analysis.
- Nvidia Earnings August 2026: AI Chip Leader's Q2 Preview & Investment OutlookNvidia's Q2 FY27 earnings preview: Expect $93-95B revenue driven by AI accelerator demand. Analysis of Blackwell ramp, data center growth, and price targets reaching $238.