
樂
樂觀
樂觀 · 25%WHG
$22.85
情境價格
$19.200
-0.040 (-0.21%)收盤時
Westwood Holdings Group, Inc. manages investment assets and provides services for its clients through its subsidiaries, Westwood Management Corp., Westwood Advisors, L.L.C., Broadmark Asset Management LLC, and Salient Capital L.P. The Company's segments include Advisory and Trust. The Advisory segment provides investment advisory services to corporate pension and profit-sharing plans, public employee retirement funds, Taft-Hartley plans, endowments, foundations and individuals; sub-advisory; pooled investment vehicles, including collective investment trusts. The Trust segment provides trust and custodial services and participation in common trust funds that it sponsors for institutions and high-net-worth individuals. Its advisory business encompasses six distinct investment capabilities, including United States (U.S.) Value Equity, Multi-Asset, Energy and Real Assets, Tactical Absolute Return, Income Alternatives and Managed Investment Solutions.
Westwood Holdings Group Inc (WHG) is currently priced at $18.71, which is below its 52-week high of $20.97, indicating potential for recovery. However, the RSI is at 38.06, suggesting the stock is nearing oversold conditions, which could lead to a rebound. The forward P/E ratio is 24.88, indicating that the stock may be overvalued compared to its earnings growth prospects. The main risk is the recent decline in AUM growth and revenues, which fell from $27.1 million to $25 million in Q1 2026, reflecting market volatility. Therefore, while there are signs of potential upside, the current market conditions suggest a cautious approach.
情境價格取自當年最後一個月度預測區間。機率為固定的模型權重(25 / 50 / 25),不構成保證。
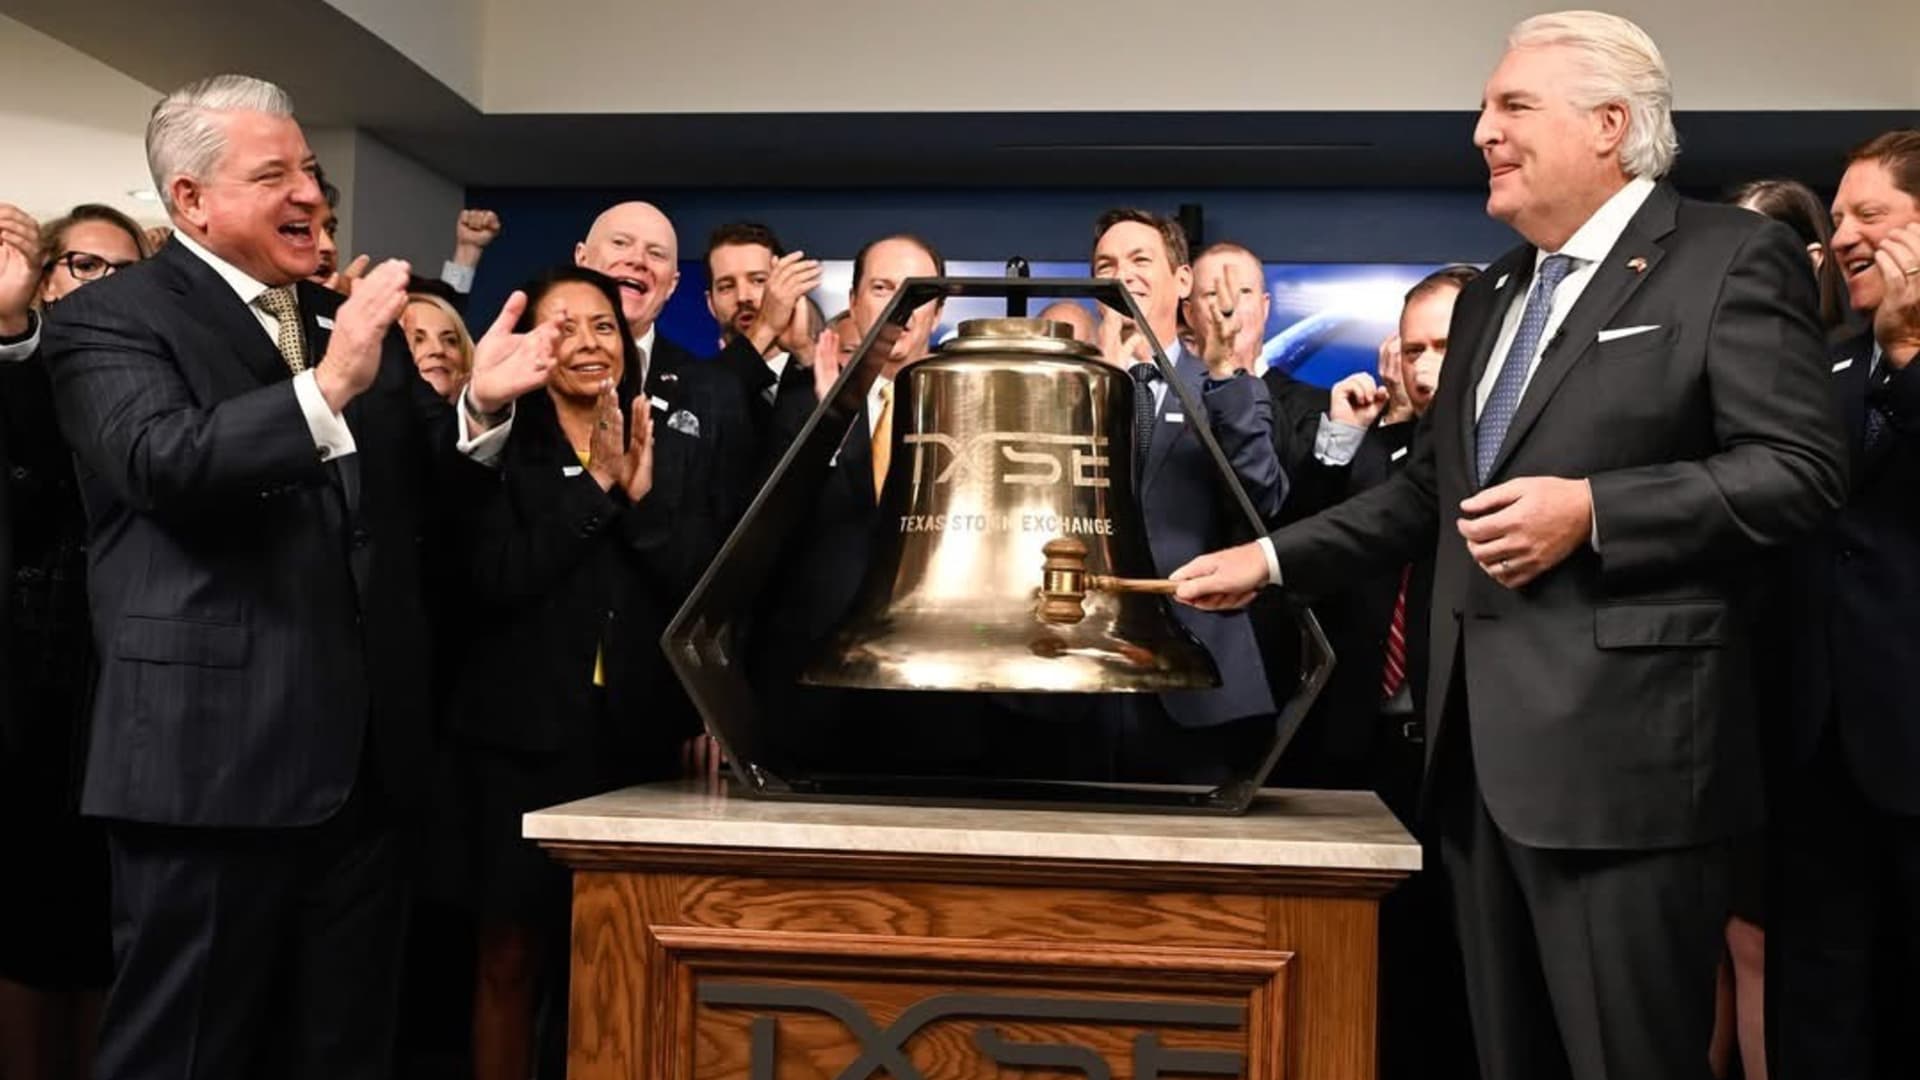
Texas Financial Services Sector Thrives Amid New Exchange Launch

WEBs Investments Launches Defined Volatility ETFs Amid Market Volatility

Westwood Holdings Group Reports Q1 2026 Earnings Insights

Westwood (WHG) Q1 2026 Earnings Transcript
Westwood Holdings Reports Q1 Earnings Highlights
Westwood Holdings Group, Inc. manages investment assets and provides services for its clients through its subsidiaries, Westwood Management Corp., Westwood Advisors, L.L.C., Broadmark Asset Management LLC, and Salient Capital L.P. The Company's segments include Advisory and Trust. The Advisory segment provides investment advisory services to corporate pension and profit-sharing plans, public employee retirement funds, Taft-Hartley plans, endowments, foundations and individuals; sub-advisory; pooled investment vehicles, including collective investment trusts. The Trust segment provides trust and custodial services and participation in common trust funds that it sponsors for institutions and high-net-worth individuals. Its advisory business encompasses six distinct investment capabilities, including United States (U.S.) Value Equity, Multi-Asset, Energy and Real Assets, Tactical Absolute Return, Income Alternatives and Managed Investment Solutions. It operates in the Financials sector (INVESTMENT ADVICE industry).
Westwood Holdings Group Inc (WHG) is currently priced at $18.71, which is below its 52-week high of $20.97, indicating potential for recovery. However, the RSI is at 38.06, suggesting the stock is nearing oversold conditions, which could lead to a rebound. The forward P/E ratio is 24.88, indicating that the stock may be overvalued compared to its earnings growth prospects. The main risk is the recent decline in AUM growth and revenues, which fell from $27.1 million to $25 million in Q1 2026, reflecting market volatility. Therefore, while there are signs of potential upside, the current market conditions suggest a cautious approach.
暫無貼文
註冊或登入後參與討論本頁僅供研究參考,不構成投資建議。模型可能出錯。過往表現不代表未來結果。