
樂
樂觀
樂觀 · 25%SNTG
$2.39
情境價格
$1.630
+0.052 (+3.16%)收盤時
Sentage Holdings Inc is a holding company mainly engaged in prepaid payment network services. The Company also provides payment-related technical consulting and support and prepaid card payment services. The Company primarily provides payment solutions through its prepaid card network, offering secure and convenient payment options for consumers and businesses. The Company mainly operates its businesses in the domestic market.
Sentage Holdings Inc is not a good buy right now due to its negative financial performance and bearish technical indicators. The current price is $1.63, which is close to its 52-week low of $1.55. Additionally, the RSI is at 45.707, indicating that the stock is neither overbought nor oversold, but the recent trend shows a decline of 20.49% over the past year, suggesting ongoing weakness.
情境價格取自當年最後一個月度預測區間。機率為固定的模型權重(25 / 50 / 25),不構成保證。
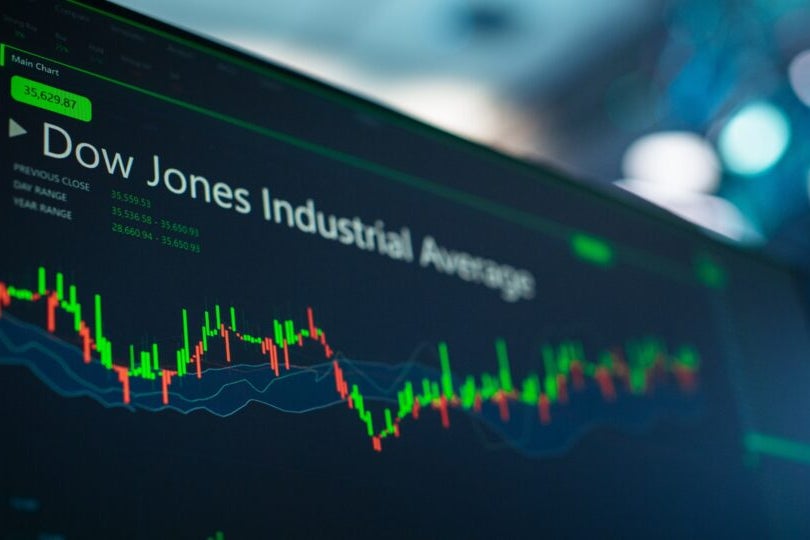
Dow Rises 1% as US Inflation Rate Increases

US Stocks Rise as Designer Brands Reports Positive Earnings
Nebius Group Shares Surge Nearly 50%; Check Out 20 Stocks Making Moves in Premarket Trading

Alphabet Shares Rise Approximately 6%; Check Out 20 Stocks Making Moves in Premarket Trading

Autodesk Shares Rise 10%; Check Out 20 Stocks Making Moves in Premarket Trading
Sentage Holdings Inc is a holding company mainly engaged in prepaid payment network services. The Company also provides payment-related technical consulting and support and prepaid card payment services. The Company primarily provides payment solutions through its prepaid card network, offering secure and convenient payment options for consumers and businesses. The Company mainly operates its businesses in the domestic market. It operates in the Financials sector.
Sentage Holdings Inc is not a good buy right now due to its negative financial performance and bearish technical indicators. The current price is $1.63, which is close to its 52-week low of $1.55. Additionally, the RSI is at 45.707, indicating that the stock is neither overbought nor oversold, but the recent trend shows a decline of 20.49% over the past year, suggesting ongoing weakness.
暫無貼文
註冊或登入後參與討論本頁僅供研究參考,不構成投資建議。模型可能出錯。過往表現不代表未來結果。