


Espey MFG & Electronics Corp

Espey MFG & Electronics Corp(ESP)股票分析

$45.900

-3.989 (-8.69%)收盤時

Loading chart…
最高
50.170
開盤
50.170
成交量加權均價
47.18
成交量
61.70K
市值
54.79M
最低
45.457
成交金額
2.91M
企業價值/稅息折舊攤銷前利潤(TTM)
9.03

Espey Mfg. & Electronics Corp. is a power electronics design and original equipment manufacturing (OEM) company. The Company is a manufacturer of power conversion, advanced magnetics and build to specifications provided by the customer build to print products for the rugged industrial and military marketplace. The Company's primary products are power supplies, power converters, filters, power transformers, magnetic components, power distribution equipment, uninterruptible power supply (UPS) systems, and antennas. The applications of these products include alternating current (AC) and direct current (DC) locomotives, shipboard power, shipboard radar, airborne power, ground-based radar, and ground mobile power. The Company's services include design and development to specification, build to specifications provided by the customer, design services, design studies, environmental testing services, metal fabrication, painting services, and development of automatic testing equipment.

AI 分析 of Espey MFG & Electronics Corp (ESP)

持有

Espey MFG & Electronics Corp is currently a hold. The stock is trading at $51.99, significantly below its 52-week high of $74.77, indicating potential upside. However, the RSI is at 31.54, suggesting it is oversold, and the forward P/E ratio is 11.38, which is attractive compared to the market average. The main risk is the insider selling activity, which has increased by 732.32% over the last month, indicating potential lack of confidence among insiders.

分析師評級(1)

上檔空間 +74.29%
持有
0 買進
1 持有
0 賣出
目前: 45.90
最低
80.00
平均
80.00
最高
80.00

Freedom Broker

2026-09-24

目標價

$70

持有

Freedom Broker

2026-05-18

目標價

$65

持有

估值指標

Espey MFG & Electronics Corp(ESP)目前預期本益比為 11.38,5 年平均預期本益比為 13.92。

預期本益比

合理
5 年均值 P/E
13.92
目前P/E
11.38
高估
19.48
低估
8.35

預期 EV/EBITDA

合理
5 年均值 EV/EBITDA
8.29
目前EV/EBITDA
9.03
高估
11.91
低估
4.67

預期股價營收比

高估
5 年均值 P/S
1.73
目前P/S
2.76
高估
2.68
低估
0.79

事件時間軸

2026-09-23 (ET)

16:30:00

Major Averages Close Lower as 10-Year Treasury Yield Hits 5.13%

12:00:00

Major Averages Broadly Lower as Oil Rises Over 1%

06:30:00

Company Reports Q4 Revenue of $13.47M

2026-05-12 (ET)

16:50:00

Company Reports Q3 Revenue of $11.42M

2026-02-10 (ET)

17:00:00

Company Reports Q2 Revenue of $12.14M

資訊

ESP 常見問題 —— 由 Alphio AI 解答

Espey Mfg. & Electronics Corp. is a power electronics design and original equipment manufacturing (OEM) company. The Company is a manufacturer of power conversion, advanced magnetics and build to specifications provided by the customer build to print products for the rugged industrial and military marketplace. The Company's primary products are power supplies, power converters, filters, power transformers, magnetic components, power distribution equipment, uninterruptible power supply (UPS) systems, and antennas. The applications of these products include alternating current (AC) and direct current (DC) locomotives, shipboard power, shipboard radar, airborne power, ground-based radar, and ground mobile power. The Company's services include design and development to specification, build to specifications provided by the customer, design services, design studies, environmental testing services, metal fabrication, painting services, and development of automatic testing equipment. It operates in the Industrials sector (ELECTRONIC COMPONENTS, NEC industry).

Espey MFG & Electronics Corp is currently a hold. The stock is trading at $51.99, significantly below its 52-week high of $74.77, indicating potential upside. However, the RSI is at 31.54, suggesting it is oversold, and the forward P/E ratio is 11.38, which is attractive compared to the market average. The main risk is the insider selling activity, which has increased by 732.32% over the last month, indicating potential lack of confidence among insiders.

1 analysts cover ESP: 0 rate it Buy, 1 Hold and 0 Sell. The average price target is 80.00.

chromerelay612026/9/19

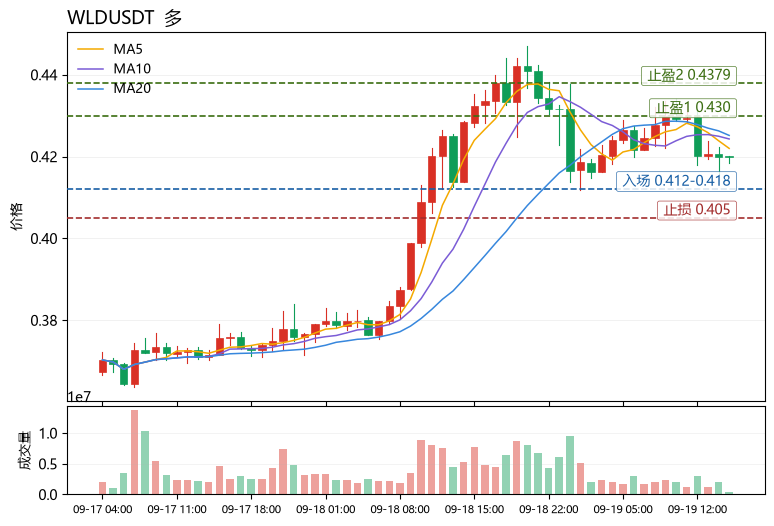
$WLD is at 0.42, down 2.75% over 24h, with 41.2M USDT in volume; MA5=0.422 has crossed below MA20=0.42517, the MACD histogram at -0.002265 remains bearish, RSI is neutral at 50.0, Bollinger Bands are [0.412418, 0.437922], the 30-candle range is 11.67%, and the funding rate is +0.0053%, meaning longs are paying a small fee. Cross-sectional comparison within the same sector: $FET is at 0.1778, down 1.93% over 24h, with MA5<MA20, RSI 42, bearish MACD, and 18.1M in volume, weaker than WLD in liquidity but with a shallower decline; $ESP is at 0.0988, up 15.03% over 24h, with RSI 89.1 in severely overbought territory and a funding rate of -0.2697%, meaning shorts are paying, which looks like a sentiment-driven move that has run ahead of itself. Compared with the other two, WLD sits in the position of “middle decline, strongest liquidity, most neutral indicators” — not the weakest, and not the hottest, which is exactly why it is worth watching: in an environment with a greed index of 71, funds are more willing to repair positions in names with good liquidity, and WLD’s RSI of 50 means there is room in both directions, and once MA5 crosses back above MA20, its upside elasticity should be better than overbought ESP and weak FET. The bias is long, but this is a pullback-confirmation long, not chasing highs. Entry reference is 0.412–0.418, the area where the lower Bollinger Band at 0.412418 overlaps with the round-number support and also sits near the lower edge of the 30-candle range; take-profit 1 is 0.430, corresponding to above the middle Bollinger Band and the MA20 resistance zone; take-profit 2 is 0.4379, the upper Bollinger Band at 0.437922; stop-loss is 0.405, with a break below the lower Bollinger Band and a deviation of more than 4% from MA20 viewed as structural damage. The basis is that RSI 50 has not entered overbought territory, the bearish MACD histogram is not continuing to expand, and the funding rate at only +0.0053% shows longs are not crowded, so the risk-reward of buying on a pullback is better than chasing strength. Also watch over the same period: $FET and $ESP, the former weak and the latter overbought, both inferior in relative strength to WLD’s neutral structure. (Personal view only, for reference only, and not any investment advice. Contract risk is extremely high, please strictly control position size.) [Data] Coin: WLDUSDT Direction: Long Entry: 0.412-0.418 Take-profit 1: 0.430 Take-profit 2: 0.4379 Stop-loss: 0.405

展開

velvetswell2026/9/15

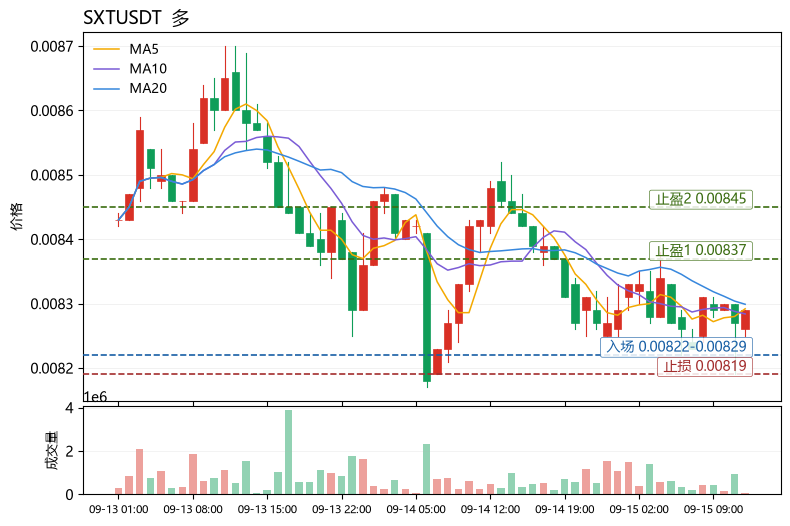
$SXT is at 0.00829 now, short-term bullish. Entry 0.00822-0.00829, TP1 0.00837, TP2 0.00845, SL 0.00819. Reason: MA5 is slightly below MA20 but the gap is very small, RSI 46.9 is not overbought, MACD histogram has turned positive, the lower Bollinger Band at 0.00822 acts as support, and the Fear & Greed Index at 69 still leans greedy. Compared with SHELL and ESP, all three have similar 24h declines, but SXT's MACD has turned bullish while ESP remains bearish, making SXT relatively more resilient among peers. Also watching: $B and $CHR are relatively weaker than SXT. (Personal view only, for reference only, not any investment advice. Futures risk is extremely high, please strictly control position size.) [Data] Pair: SXTUSDT Direction: Long Entry: 0.00822-0.00829 TP1: 0.00837 TP2: 0.00845 SL: 0.00819

展開
註冊或登入後參與討論

相關文章

本頁僅供研究參考,不構成投資建議。模型可能出錯。過往表現不代表未來結果。

開始交易