
B
Bull
Bull · 25%ATHR
$12.51
情境價格
$2.880
-0.020 (-0.69%)收盤時
Aether Holdings, Inc. is a financial technology holding company focused on advancing the manner in which investors access, analyze, and act upon market information. By combining advanced analytics, data science, and user-centric design, the Company provides solutions that enable both individual and institutional investors to make informed decisions. Through its market intelligence platforms and curated financial newsletters, it delivers real-time insights and comprehensive trend analysis, converting complex financial data into clear, practical guidance. These tools support investors in identifying opportunities, managing risk, and maintaining a strategic advantage in evolving markets. It offers capabilities such as AI-driven sentiment analysis (SentimenTrader), thousands of market indicators and charts, a code-free strategy backtesting engine, and machine-learning scanners for equities and ETFs. Its product categories include data & technology, research reports and actionable strategy.
Aether Holdings, Inc. is not a good buy right now due to significant recent losses and negative performance indicators. The current price is $2.88, which is down 21.18% over the last 5 days and down 53.40% year-to-date. The RSI is at a low 20.234, indicating oversold conditions, but this also suggests a lack of buying momentum. Furthermore, the forward P/E is 0, indicating no expected earnings growth in the near term, while the gross margin is relatively high at 80.40%. However, the risks are substantial, including a net income loss of $1,342,740 in Q3 2026, which raises concerns about the company's financial health.
Scenario prices are the last monthly forecast band of the current year. Probabilities are fixed model weights (25 / 50 / 25), not guarantees.

Aether Catalyst Solutions Appoints New Director

Aether Catalyst Solutions Announces Board Changes
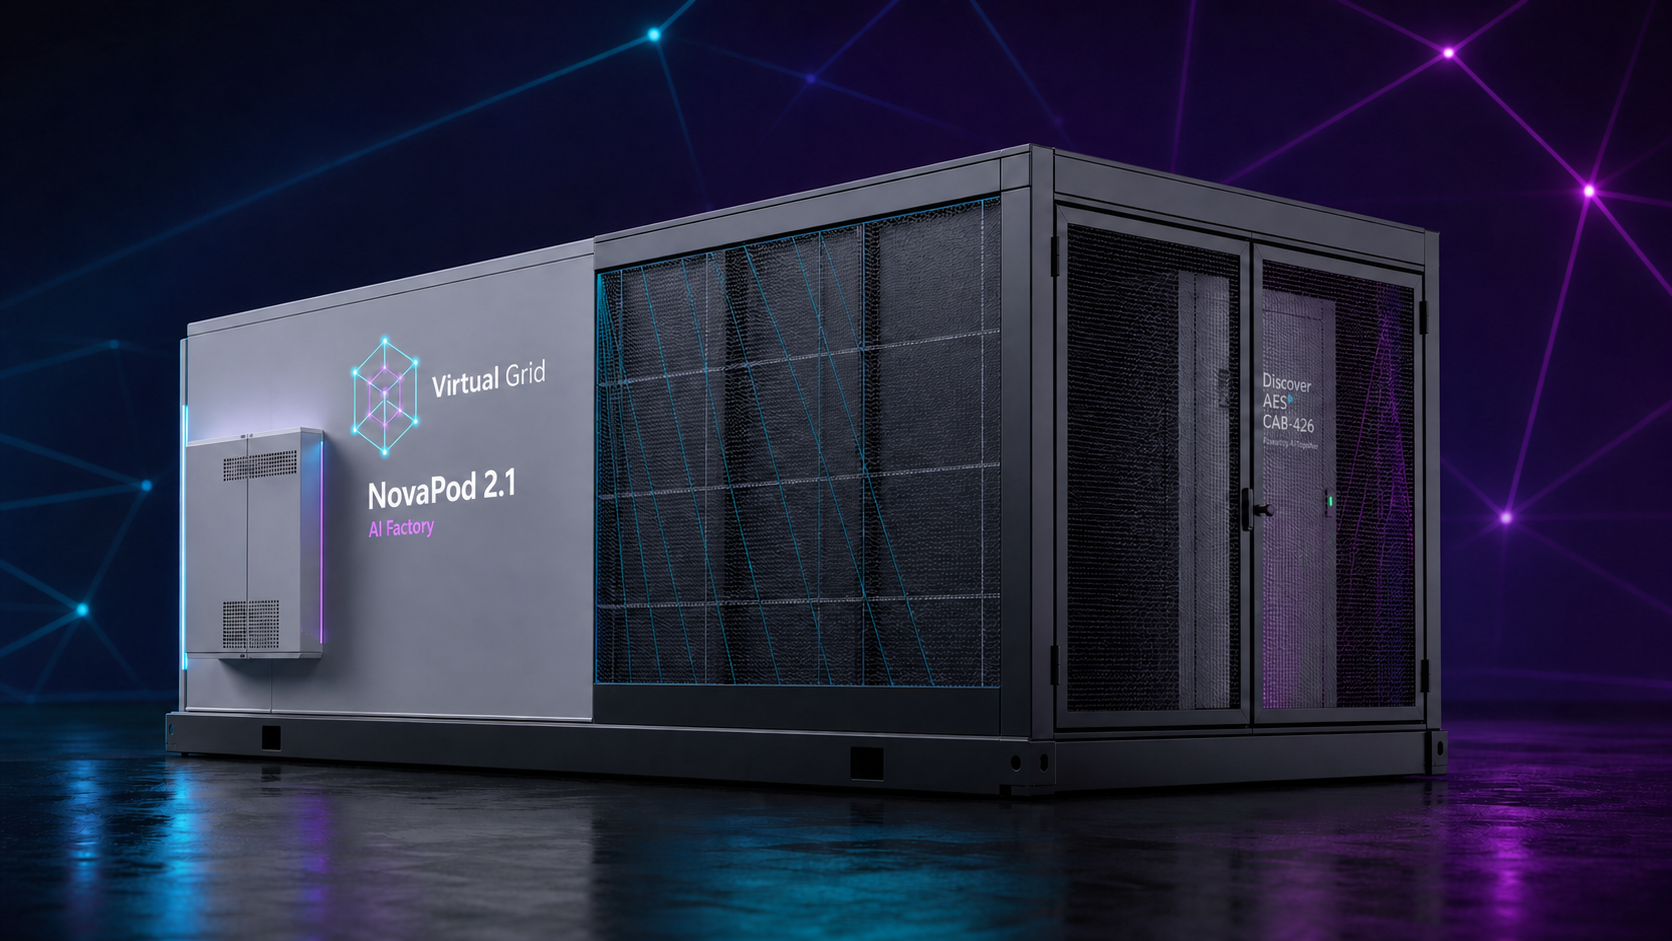
Virtual Grid Completes Strategic Investment with Aether Holdings

Virtual Grid Completes Strategic Investment with Aether Holdings

Johnson Fistel Investigates Aether Holdings for Investor Losses
Aether Holdings, Inc. is a financial technology holding company focused on advancing the manner in which investors access, analyze, and act upon market information. By combining advanced analytics, data science, and user-centric design, the Company provides solutions that enable both individual and institutional investors to make informed decisions. Through its market intelligence platforms and curated financial newsletters, it delivers real-time insights and comprehensive trend analysis, converting complex financial data into clear, practical guidance. These tools support investors in identifying opportunities, managing risk, and maintaining a strategic advantage in evolving markets. It offers capabilities such as AI-driven sentiment analysis (SentimenTrader), thousands of market indicators and charts, a code-free strategy backtesting engine, and machine-learning scanners for equities and ETFs. Its product categories include data & technology, research reports and actionable strategy. It operates in the Technology sector.
Aether Holdings, Inc. is not a good buy right now due to significant recent losses and negative performance indicators. The current price is $2.88, which is down 21.18% over the last 5 days and down 53.40% year-to-date. The RSI is at a low 20.234, indicating oversold conditions, but this also suggests a lack of buying momentum. Furthermore, the forward P/E is 0, indicating no expected earnings growth in the near term, while the gross margin is relatively high at 80.40%. However, the risks are substantial, including a net income loss of $1,342,740 in Q3 2026, which raises concerns about the company's financial health.
本頁僅供研究參考,不構成投資建議。模型可能出錯。過往表現不代表未來結果。