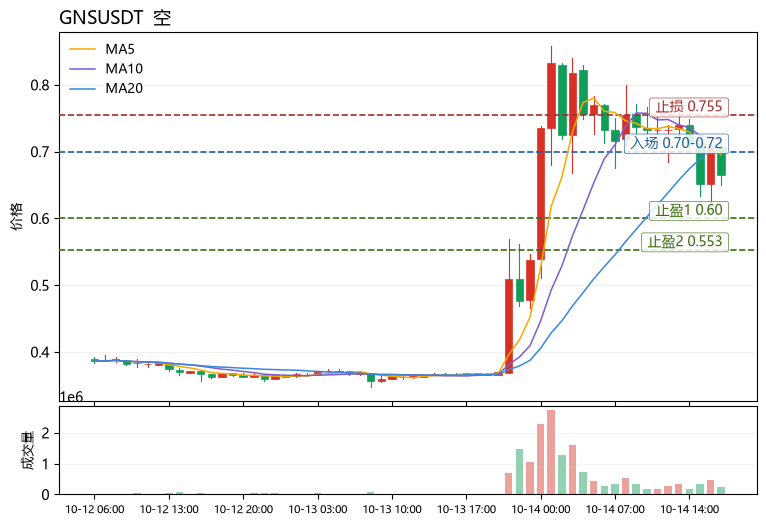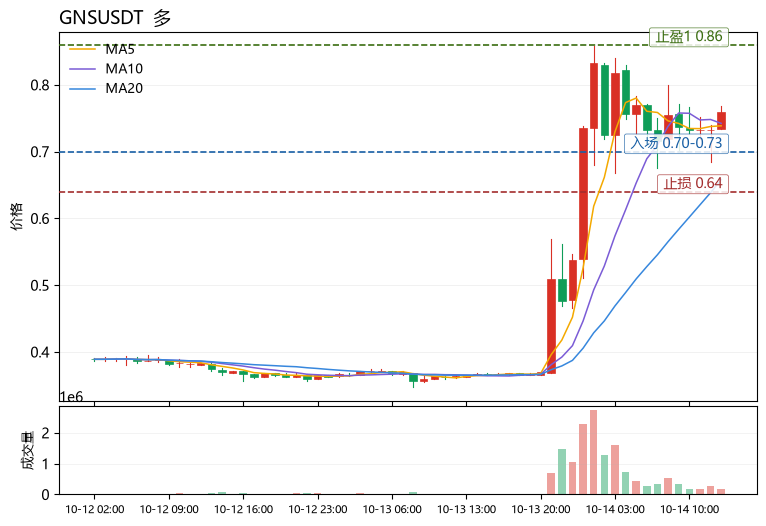





$GNS Conclusion first: the funding rate is severely diverging from price. Longs are crowded but there is little spot demand to absorb them, so the short-term bias is bearish, mainly selling into rebounds. $GNS is at 0.665, up 80.71% in 24h, but the contract funding side is already flashing red. The funding rate remains positive (longs pay), which shows long-chasing sentiment is overheated, while price is still below MA5=0.695 and MA20=0.713, and the bearish moving-average alignment is unchanged; the MACD histogram at -0.019 is still negative, RSI 53.1 is neutral-to-weak, and the volume-price divergence is obvious. 24h turnover is only 11.1M USDT, and under thin liquidity the 30-candle range is as high as 74.74%, making sharp wicks up and down and cascading liquidations very easy. The greed index is 62, market sentiment is hot, and this is often a window where longs get harvested. The Bollinger Bands [0.553, 0.873] are extremely wide, price is near the lower side of the middle band, and a rebound into the 0.70-0.72 area is an ideal short entry zone: that area is also capped by MA5/MA20 and is an earlier dense trading trapped zone. Take-profit 1 is 0.60 (above the lower Bollinger Band plus short-term support), take-profit 2 is 0.553 (lower Bollinger Band), and stop-loss is 0.755 (if price breaks above MA20 and holds, the short thesis is invalidated). Also watch during the same period: weakness, RSI 34 near oversold, $ZK in a narrow range with unclear direction, and neither has the same intensity of capital battle as GNS. [Data] Pair: GNSUSDT Direction: Short Entry: 0.70-0.72 Take-profit 1: 0.60 Take-profit 2: 0.553 Stop-loss: 0.755 (Personal view only, for reference only, and not any investment advice. Contract risk is extremely high, please strictly control position size.)
展开