Alpha Pro Tech Ltd

Alpha Pro Tech Ltd(APT)股票分析

$5.420

-0.059 (-1.09%)收盘时

Loading chart…
最高
5.530
开盘
5.410
成交量加权均价
5.44
成交量
29.75K
市值
64.29M
最低
5.380
成交额
161.94K
企业价值/息税折旧摊销前利润(TTM)
0.00

Alpha Pro Tech, Ltd. is engaged in developing, manufacturing and marketing a line of disposable protective apparel and infection-control products for the cleanroom, industrial, pharmaceutical, medical and dental markets through its wholly owned subsidiary, Alpha Pro Tech, Inc. It also manufactures a line of building supply construction weatherization products through its wholly owned subsidiary, Alpha ProTech Engineered Products, Inc. Its products are sold under the Alpha Pro Tech brand and private labels. Its products are grouped into two business segments: the Building Supply segment, consisting of construction weatherization products, such as housewrap, housewrap accessories, synthetic roof underlayment and synthetic roof underlayment accessories, as well as other woven materials; and the Disposable Protective Apparel segment, consisting of disposable protective garments (including shoecovers, bouffant caps, coveralls, gowns, frocks and lab coats), face masks and face shields.

AI 分析 of Alpha Pro Tech Ltd (APT)

持有

Alpha Pro Tech Ltd is currently trading at $5.52, with a forward P/E ratio of 5.98, indicating it may be undervalued relative to its earnings potential. However, insider selling has increased by 346.57% recently, which raises concerns about the stock's short-term outlook. The RSI is at 51.37, suggesting the stock is neither overbought nor oversold, which supports a hold position for now.

估值指标

Alpha Pro Tech Ltd(APT)当前预期市盈率为 5.98,5 年平均预期市盈率为 4.45。

预期市盈率

高估
5 年均值 P/E
4.45
当前P/E
5.98
高估
5.42
低估
3.48

预期 EV/EBITDA

严重低估
5 年均值 EV/EBITDA
1.97
当前EV/EBITDA
0.00
高估
2.31
低估
1.64

预期市销率

严重低估
5 年均值 P/S
0.63
当前P/S
0.00
高估
0.71
低估
0.54

事件时间线

2025-11-05 (ET)

09:03:00

Alpha Pro Tech Announces Q3 EPS of 9 Cents, Up from 8 Cents Last Year

2025-08-07 (ET)

09:02:23

Alpha Pro Tech reports Q2 EPS 12c vs 15c last year

2025-06-27 (ET)

09:06:16

Alpha Pro Tech announces $2M expansion of share repurchase program

2025-05-08 (ET)

09:02:06

Alpha Pro Tech reports Q1 EPS 6c vs 5c last year

2025-03-12 (ET)

09:04:27

Alpha Pro Tech reports Q4 EPS 8c vs 9c last year

资讯

APT 常见问题 —— 由 Alphio AI 解答

Alpha Pro Tech, Ltd. is engaged in developing, manufacturing and marketing a line of disposable protective apparel and infection-control products for the cleanroom, industrial, pharmaceutical, medical and dental markets through its wholly owned subsidiary, Alpha Pro Tech, Inc. It also manufactures a line of building supply construction weatherization products through its wholly owned subsidiary, Alpha ProTech Engineered Products, Inc. Its products are sold under the Alpha Pro Tech brand and private labels. Its products are grouped into two business segments: the Building Supply segment, consisting of construction weatherization products, such as housewrap, housewrap accessories, synthetic roof underlayment and synthetic roof underlayment accessories, as well as other woven materials; and the Disposable Protective Apparel segment, consisting of disposable protective garments (including shoecovers, bouffant caps, coveralls, gowns, frocks and lab coats), face masks and face shields. It operates in the Healthcare sector (ORTHOPEDIC, PROSTHETIC & SURGICAL APPLIANCES & SUP industry).

Alpha Pro Tech Ltd is currently trading at $5.52, with a forward P/E ratio of 5.98, indicating it may be undervalued relative to its earnings potential. However, insider selling has increased by 346.57% recently, which raises concerns about the stock's short-term outlook. The RSI is at 51.37, suggesting the stock is neither overbought nor oversold, which supports a hold position for now.

0xMoonwatcher16小时前

Latest update: We are actively working to restore withdrawal services for HYPE, INJ, APT, PLASMA, NEAR, and LTC by the end of next weekend. At the same time, we plan to restore withdrawal services for all tokens on all networks that have already resumed operation (including BSC, ETH, MATIC, ARB, POL, OP, etc.) before then. Thank you for your patience and understanding.

展开

XRP and Pi Network are linked to payment infrastructure and ecosystem adoption. Aptos and Sui compete for developers and activity across layer-1 blockchain networks. Hyperliquid's outlook is closely connected to decentralized derivatives trading and liquidity. It could be a turning point for the cryptocurrency market as investors keep a close eye on indications of sentiment shifts and brace for more volatility in the coming days. While there hasn't been a consistent trend of altcoins being priced higher, a greater number of projects are now gaining traction due to their use case, active development, and established ecosystem. These types of setups can present prospects for choosing positions selectively, prior to a stronger market range. But when, where, and what will happen next is still unclear, as liquidity and investor confidence play a role in cryptocurrency valuations. There are five market segments: XRP, Aptos, Pi Network, Hyperliquid, and Sui. They may perform in a different manner in case of a market swell, which may be influenced by adoption, network activity, liquidity, and investor appetite. XRP (XRP): Payment Activity Remains Central to Its Market Outlook XRP is still linked to its payment and international transfer uses on the blockchain. The influence of cryptocurrency development such as payment infrastructure, institutional involvement, and network activity is a major factor that shapes its place in the cryptocurrency market. If the broader altcoin recovery takes place, there is the potential that payment-related cryptocurrencies will have an impact on the demand for XRP. But continued price action will probably need increased involvement from the markets and the continued growth of its ecosystem. Other factors are also relevant, such as regulatory changes and competition in the payments landscape. Aptos (APT): Blockchain Development Could Influence Demand Aptos is part of the layer-1 blockchain segment where efficiency, application development, and activity are all crucial metrics of competitiveness in the blockchain industry. It may be affected by both developer involvement and the number of applications that users will get drawn to in the long run. Additional attention may be given to APT if capital starts to flow towards alternate blockchain ecosystems. However, the competition from the existing networks and other new layer-1 projects is still a challenge. Pi Network (PI): Adoption Remains an Important Factor Among the five cryptocurrencies, Pi Network finds itself in a unique market position, where the market sentiment is tied to the growth of its ecosystem and practical application. Mobile applications, payment options, and services that are readily available may affect its network's assessment. But, for a more robust long-term demand, the adoption has to manifest itself in measurable economic activities. Other factors that influence the performance of the PIs are liquidity of the market and distribution of tokens. Hyperliquid (HYPE): Decentralized Trading Remains Its Main Focus Hyperliquid's business is in the decentralized trading market, specifically perpetual futures trading. It seamlessly bridges the gap between HYPE's market perspective and trading activity, liquidity, and engagement in the realm of decentralized financial services. In the event that the volatility of cryptocurrencies rises, trading volumes may matter more significantly for platforms that engage in trading derivatives. But the more volatile isn't automatically the more demanded HYPE. The factors of competition, platform activity, and overall market conditions will continue to be relevant. Sui (SUI): Network Activity Could Shape Its Next Move Sui is also a layer-1 blockchain that is rivaling other layer-1s in terms of developers, applications, and users in the decentralized finance and other blockchain services space. Market prospects may be affected by the growth of the ecosystem, the volume of transactions, and liquidity. Investors can also look into SUI during an altcoin rally, when they are also analyzing alternative networks. Further development and real use by customers will be critical for its market position to strengthen. What Could Happen as Crypto Volatility Returns? The performance of these 5 cryptocurrencies is influenced by a number of independent factors as these are different market segments. If the market recovers wider, it will create more interest in the specific altcoins but it will not ensure simultaneous recovery. Investors are going to be paying close attention to the liquidity, network activity, adoption and market sentiment before deciding if the accumulation phase has come to a close. Tags:AltcoinAptosCrypto marketcryptocurrencyHYPEPISUIXRP

展开
dusk_circuit2026/10/27

Aptos is expanding its role in cross-border payments, with stablecoin transfer volume exceeding $15.7b over the past 30 days and more than 738k stablecoin holders. Native USDT and USDC, sub-second finality, and new payment corridors across Asia, Africa, and the Middle East and North Africa are driving increasing adoption. $APT $USDT #GATE

展开
deltalantern2026/10/23

BlackRock, with $15.5 trillion in assets, generated $543,532 in yield on Aptos over the past 30 days through its BUIDL fund, only $13,041 less than Decibel, the chain's top-ranked application. That is 3.85 times the $141,203 in gas fees collected by the Aptos chain itself. @Aptos

展开
velvetswell2026/10/23

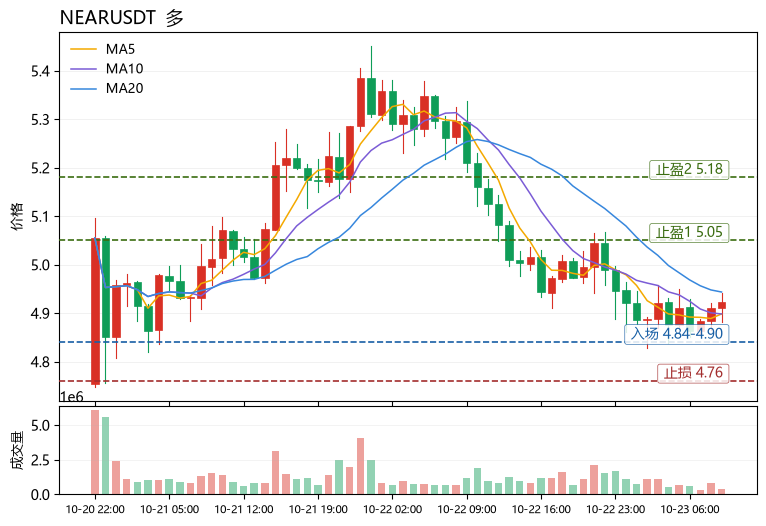
$NEAR is at 4.923, down 6.85% over 24h, with 129.8M USDT in volume; MA5=4.8984 is below MA20=4.94365, RSI 43.7, MACD histogram +0.001932 remains bullish, Bollinger Bands [4.8398, 5.0475], funding rate +0.0051%, Fear & Greed Index 50 neutral. Sector comparison: SUI is down 5.24% over 24h with RSI 36.6, APT is down 9.12% with RSI 33.4 and a negative funding rate. NEAR has the smallest decline, its RSI is closest to the midline, and its 129.8M volume is clearly above SUI's 38.5M and APT's 6.6M, giving it the strongest relative strength in the sector. Although price is below MA20, MACD has turned bullish and the funding rate remains positive, suggesting a structural repair after an oversold move, with potential support near the lower Bollinger Band at 4.84. Also watch: $SUI and $APT, both with weaker RSI, APT with a negative funding rate, and relative strength below NEAR. Directional bias is long, with an entry reference of 4.84–4.90 (the support zone where the lower Bollinger Band and MA5 converge); take-profit 1 at 5.05 (near the upper Bollinger Band resistance at 5.0475); take-profit 2 at 5.18 (extension target after a breakout above the upper band); stop-loss at 4.76 (about 1.6% below the lower band at 4.8398, confirming invalidation of the repair thesis). (Personal view for reference only, not investment advice. Futures risk is extremely high; please strictly control position size.) [Data] Pair: NEARUSDT Direction: Long Entry: 4.84-4.90 Take-profit 1: 5.05 Take-profit 2: 5.18 Stop-loss: 4.76

展开
注册或登录后参与讨论

相关文章

本页仅供研究参考,不构成投资建议。模型可能出错。过往表现不代表未来结果。

开始交易