B
Bull
Bull · 25%VRA
$2.08
Scenario price
$7.530
+0.570 (+7.57%)At close
Vera Bradley, Inc. is a designer of women’s handbags, luggage and other travel items, fashion and home accessories, and gifts. The Company operates through two segments: Vera Bradley Direct (VB Direct) and Vera Bradley Indirect (VB Indirect). The VB Direct business consists of sales of Vera Bradley products through Vera Bradley Full-Line and Outlet stores in the United States; Vera Bradley’s websites, www.verabradley.com, outlet.verabradley.com, and international.verabradley.com; and the Vera Bradley annual outlet sale in Fort Wayne, Indiana. The VB Indirect business consists of sales of Vera Bradley products to approximately 1,200 specialty retail locations throughout the United States, as well as select department stores, national accounts, third party e-commerce sites, and third-party inventory liquidators, and royalties recognized through licensing agreements related to the Vera Bradley brand.
Vera Bradley Inc is a good buy right now due to its recent revenue growth of 13.4% year-over-year in Q1 FY2027, surpassing expectations, and a strong gross margin improvement to 59.8% in Q2. The current price of $6.62 is only 4.1% below its 52-week high of $6.92, indicating strong upward momentum. However, the main risk is the forward P/E ratio of 60.24, which suggests high expectations for future earnings that may not materialize.
Small Cap Consumer Research
$4
2025-04-22
Small Cap Consumer Research
2025-04-22
Price Target
$4
Small Cap Consumer Research
$4
2025-03-24
Small Cap Consumer Research
2025-03-24
Price Target
$4
Small Cap Consumer Research
$4
2025-03-12
Small Cap Consumer Research
2025-03-12
Price Target
$4
Small Cap Consumer Research
$5.5
2025-03-06
Small Cap Consumer Research
2025-03-06
Price Target
$5.5
Small Cap Consumer Research
$5.5
2025-02-24
Small Cap Consumer Research
2025-02-24
Price Target
$5.5
Scenario prices are the last monthly forecast band of the current year. Probabilities are fixed model weights (25 / 50 / 25), not guarantees.

Vera Bradley Reports 1.1% Revenue Growth in Q2
Tilly's Achieves Sales Growth Through Store Optimization

Vera Bradley Reports First Revenue Growth Since 2022, Signals Turnaround
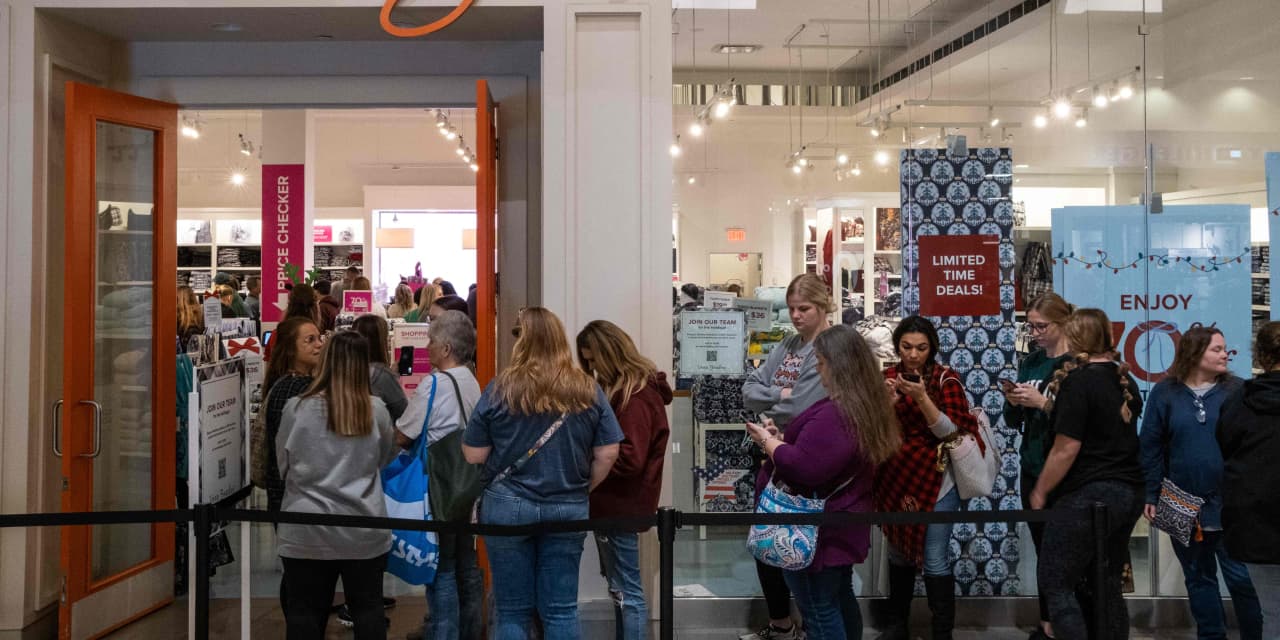
Vera Bradley Reports First Quarter Earnings Highlights
Vera Bradley Reports Positive Q1 Growth Amid Strategic Changes
Vera Bradley, Inc. is a designer of women’s handbags, luggage and other travel items, fashion and home accessories, and gifts. The Company operates through two segments: Vera Bradley Direct (VB Direct) and Vera Bradley Indirect (VB Indirect). The VB Direct business consists of sales of Vera Bradley products through Vera Bradley Full-Line and Outlet stores in the United States; Vera Bradley’s websites, www.verabradley.com, outlet.verabradley.com, and international.verabradley.com; and the Vera Bradley annual outlet sale in Fort Wayne, Indiana. The VB Indirect business consists of sales of Vera Bradley products to approximately 1,200 specialty retail locations throughout the United States, as well as select department stores, national accounts, third party e-commerce sites, and third-party inventory liquidators, and royalties recognized through licensing agreements related to the Vera Bradley brand. It operates in the Consumer Cyclicals sector (LEATHER & LEATHER PRODUCTS industry).
Vera Bradley Inc is a good buy right now due to its recent revenue growth of 13.4% year-over-year in Q1 FY2027, surpassing expectations, and a strong gross margin improvement to 59.8% in Q2. The current price of $6.62 is only 4.1% below its 52-week high of $6.92, indicating strong upward momentum. However, the main risk is the forward P/E ratio of 60.24, which suggests high expectations for future earnings that may not materialize.
6 analysts cover VRA: 0 rate it Buy, 6 Hold and 0 Sell.

Create a treasure chest of coins with 100x potential! 💎💸 Share your #CRYPTO picks for the next major market wave! 🌊 #DROVER #HYDRACHAIN $CKOM $BOND $RET $BETA $DINO $VRA $ALCX $PEPE $GORK $Bonk $HOLD ethereum: #Dogecoin #Pepe2 $WEB $HOT $GEO $WSM $WTC $DEXO $CAT And others 👇👇
Show more
This page is for research only and is not investment advice. Models can be wrong. Past performance does not guarantee future results.