
B
Bull
Bull · 25%CHR
$1.45
Scenario price
$1.205
+0.026 (+2.12%)At close
Cheer Holding Inc is a holding company principally engaged in the provision of the advertisement and content production services and the operations of mobile and online advertising, media and entertainment business. The Company operates through two segments. The CHEERS Application (APP) Internet Business segment is engaged in operations of the CHEERS APP, including broadcasting intellectual property (IP) short videos, live streaming, app-based advertising, and providing services via the Cheers E-mall marketplace. The Traditional Media Businesses segment includes purchasing and producing TV-series, providing copyrights services, creating customized content and other activities.
Cheer Holding Inc is currently trading at $1.21, which is significantly below its 52-week high of $9.49, indicating a potential for recovery. The stock has a low forward P/E of 0, suggesting it may be undervalued. Additionally, the gross margin has improved to 76.67% in the latest quarter, reflecting strong profitability. However, the main risk is the current RSI of 32.162, indicating the stock is oversold, which could lead to further declines in the short term.
Scenario prices are the last monthly forecast band of the current year. Probabilities are fixed model weights (25 / 50 / 25), not guarantees.

Jazz Aviation Reaches Tentative Labor Agreement

Cheer Holding Reports Strong H1 2026 Financial Results

Cheer Holding Reports Strong H1 2026 Financial Results

Cheer Holding Announces Results of 2026 AGM

Cheer Holding Implements Share Consolidation to Maintain Nasdaq Listing
Cheer Holding Inc is a holding company principally engaged in the provision of the advertisement and content production services and the operations of mobile and online advertising, media and entertainment business. The Company operates through two segments. The CHEERS Application (APP) Internet Business segment is engaged in operations of the CHEERS APP, including broadcasting intellectual property (IP) short videos, live streaming, app-based advertising, and providing services via the Cheers E-mall marketplace. The Traditional Media Businesses segment includes purchasing and producing TV-series, providing copyrights services, creating customized content and other activities. It operates in the Consumer Cyclicals sector (COMPUTER PROCESSING AND DATA PREPARATION AND PROCE industry).
Cheer Holding Inc is currently trading at $1.21, which is significantly below its 52-week high of $9.49, indicating a potential for recovery. The stock has a low forward P/E of 0, suggesting it may be undervalued. Additionally, the gross margin has improved to 76.67% in the latest quarter, reflecting strong profitability. However, the main risk is the current RSI of 32.162, indicating the stock is oversold, which could lead to further declines in the short term.

$MUBARAK $2U2 $CHR Sometimes the biggest breakthrough comes from taking the time to understand what you’re actually doing, and that’s what my experience with CY WATSON has taught me. I started by observing his market insights and gradually became more confident with understanding momentum, entry points, and when to stay patient. Since applying that approach, I’ve seen substantial progress in my own account and reached profit levels I once considered out of reach. For me, working with CY WATSON has brought more structure and consistency to my crypto journey, and I’m genuinely impressed by how far the experience has taken me. His username is in the comments below for anyone who wants to take a look.
Show more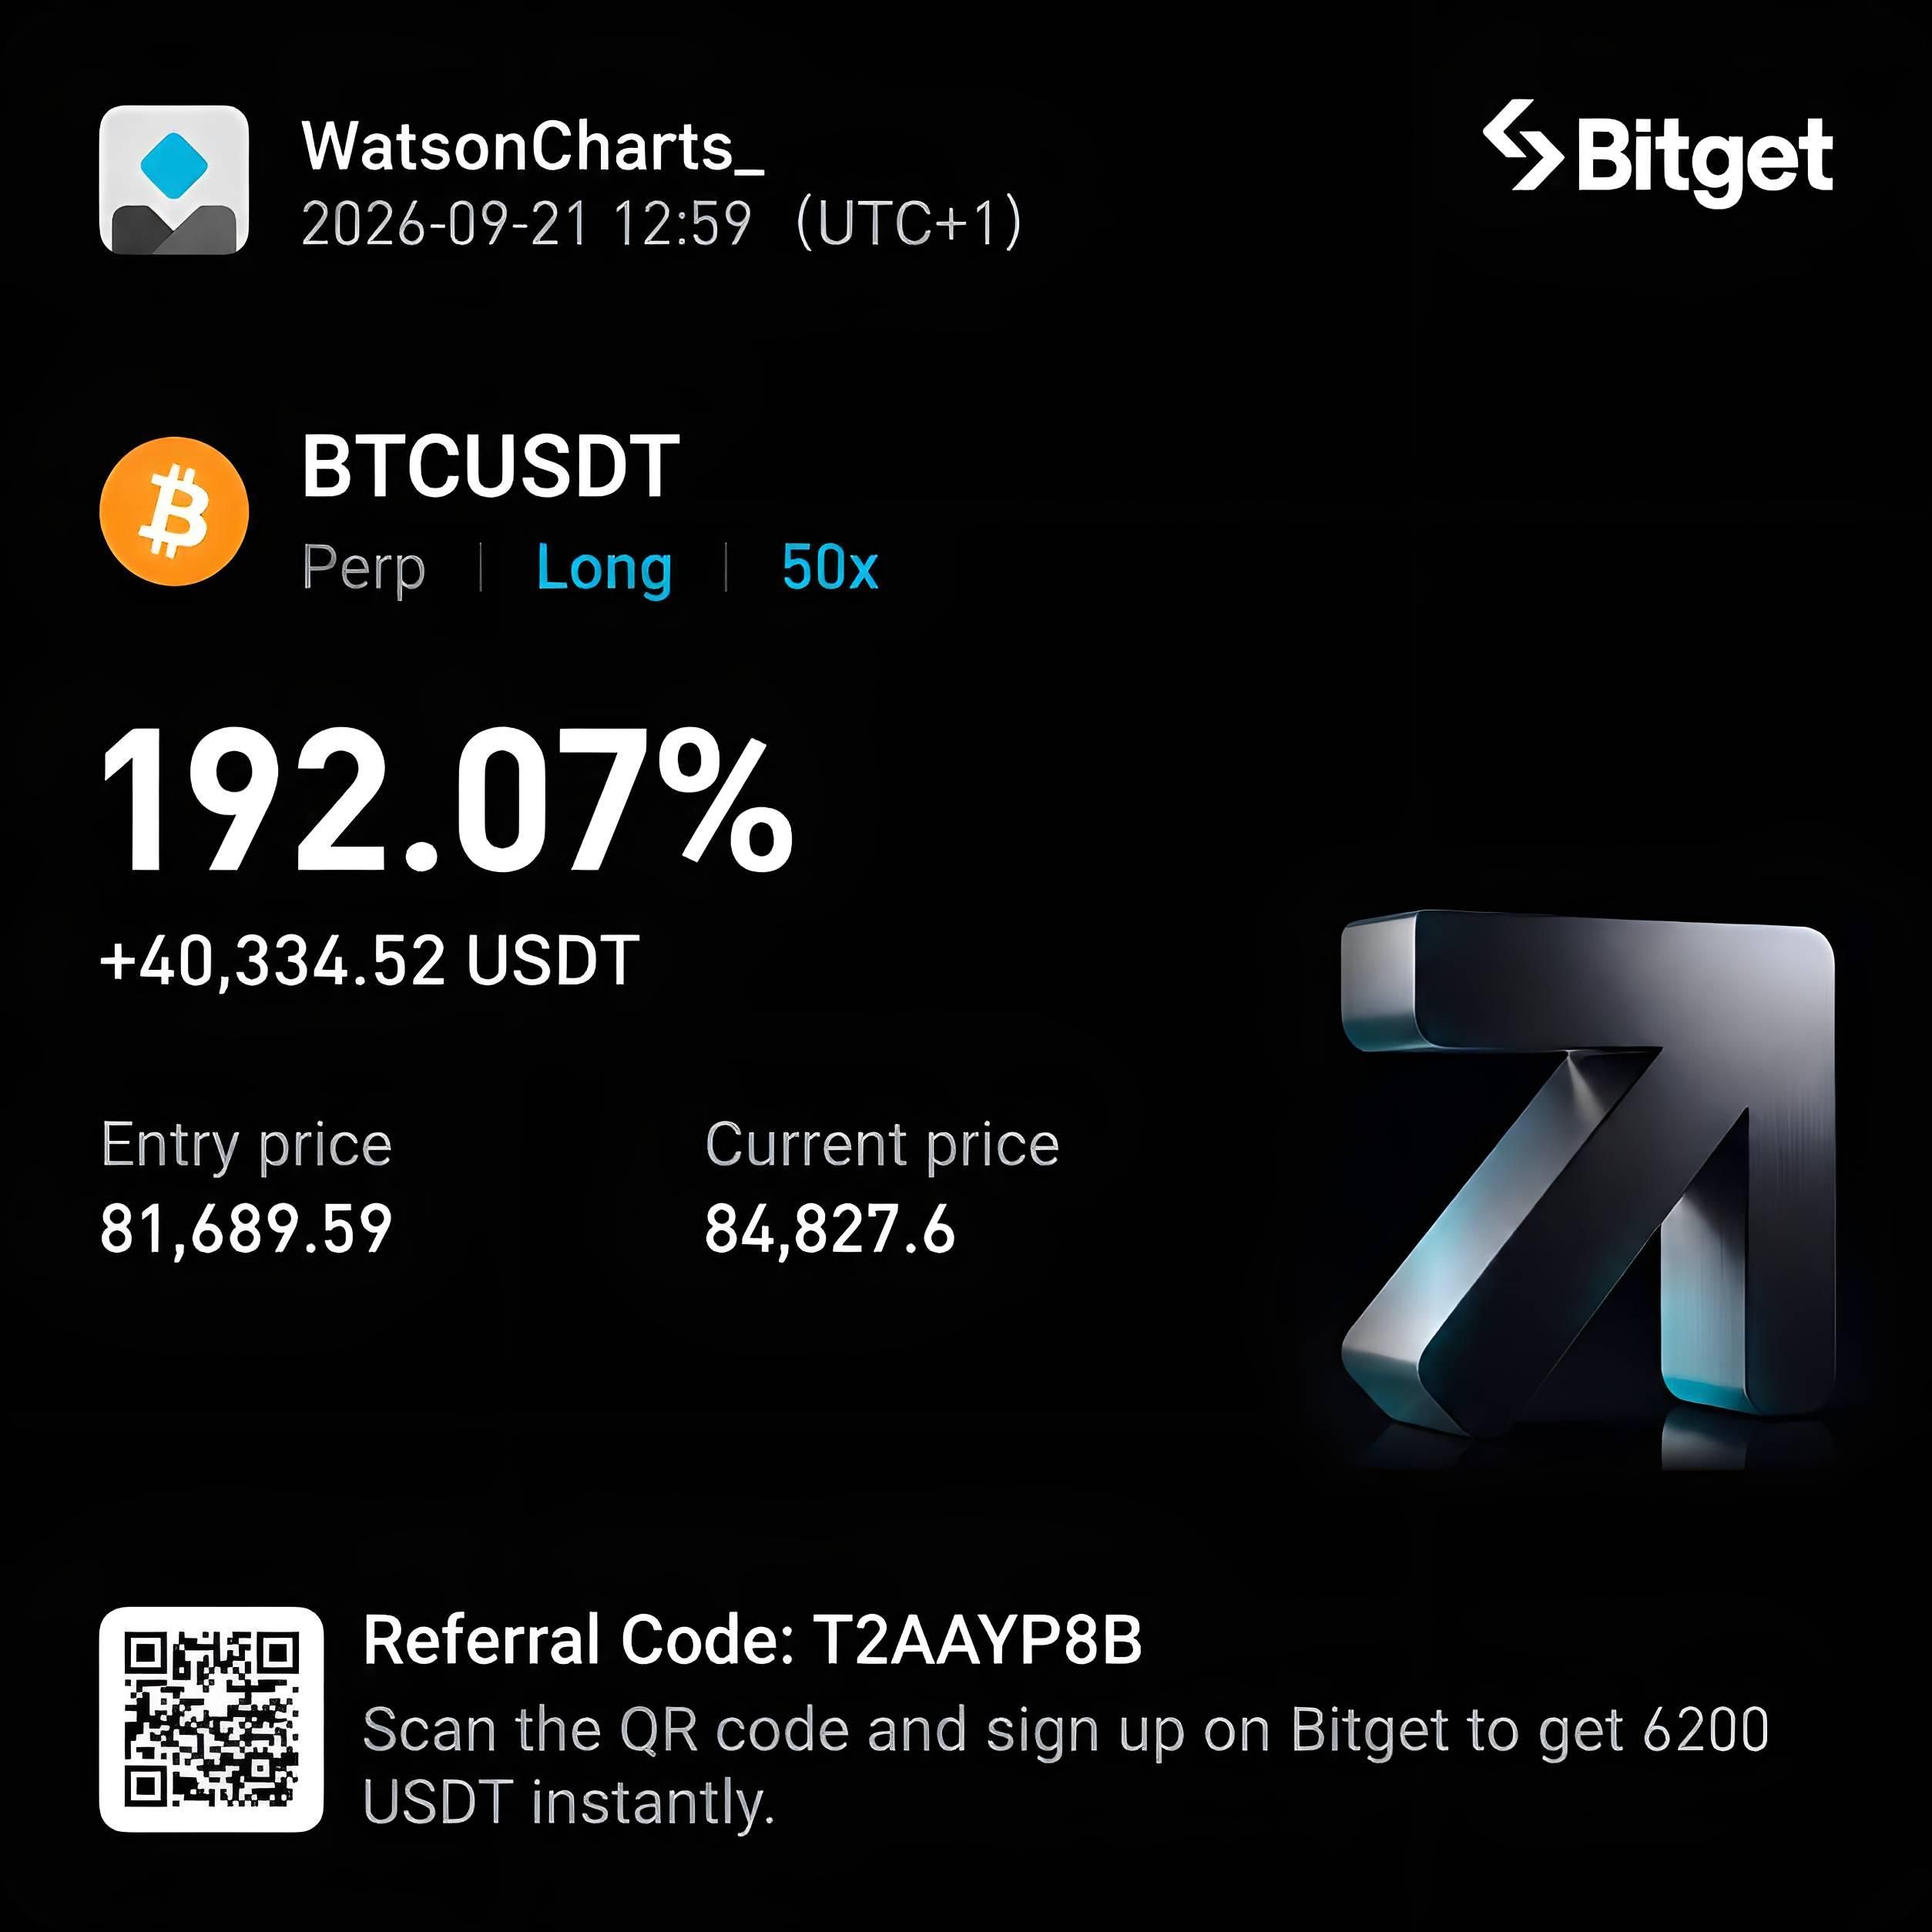

$QUID $ARKM $CHR Many people focus on finding the next big crypto opportunity, but having the right knowledge and guidance is what really helps you stay consistent. I've personally found Craig's approach to trading very different from the usual hype you see online. Following his guidance has helped me become more confident with my decisions and less likely to trade emotionally whenever the market gets volatile. I'm still learning every day, but the difference in my mindset and overall approach to trading has been noticeable.
Show more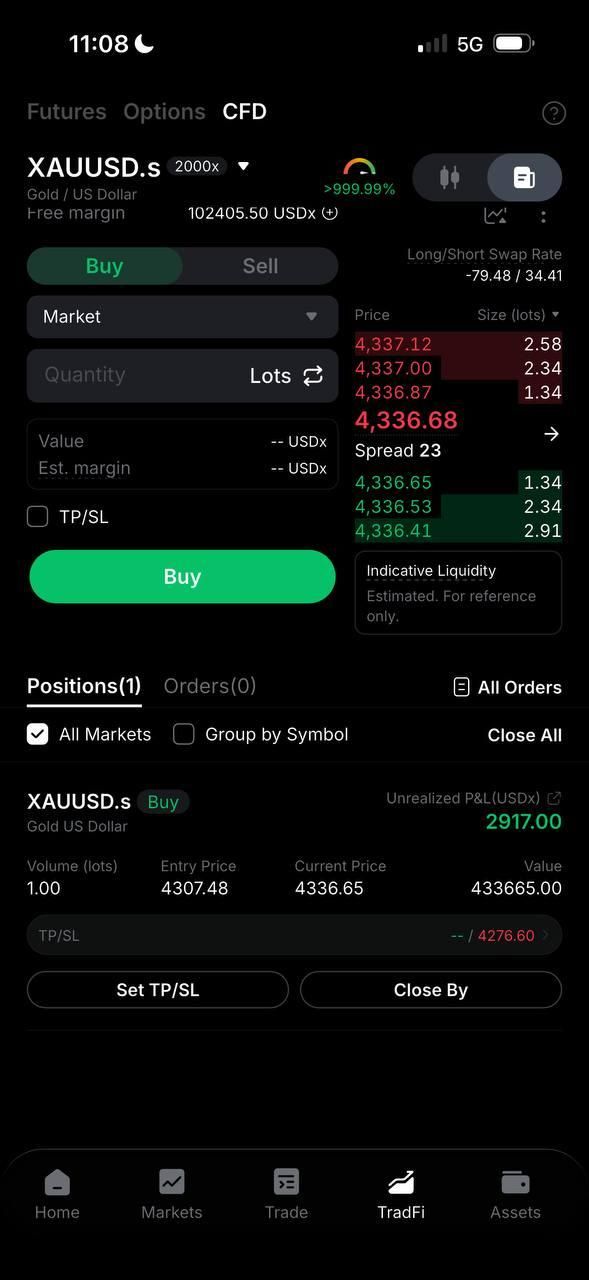

$SXT is at 0.00829 now, short-term bullish. Entry 0.00822-0.00829, TP1 0.00837, TP2 0.00845, SL 0.00819. Reason: MA5 is slightly below MA20 but the gap is very small, RSI 46.9 is not overbought, MACD histogram has turned positive, the lower Bollinger Band at 0.00822 acts as support, and the Fear & Greed Index at 69 still leans greedy. Compared with SHELL and ESP, all three have similar 24h declines, but SXT's MACD has turned bullish while ESP remains bearish, making SXT relatively more resilient among peers. Also watching: $B and $CHR are relatively weaker than SXT. (Personal view only, for reference only, not any investment advice. Futures risk is extremely high, please strictly control position size.) [Data] Pair: SXTUSDT Direction: Long Entry: 0.00822-0.00829 TP1: 0.00837 TP2: 0.00845 SL: 0.00819
Show more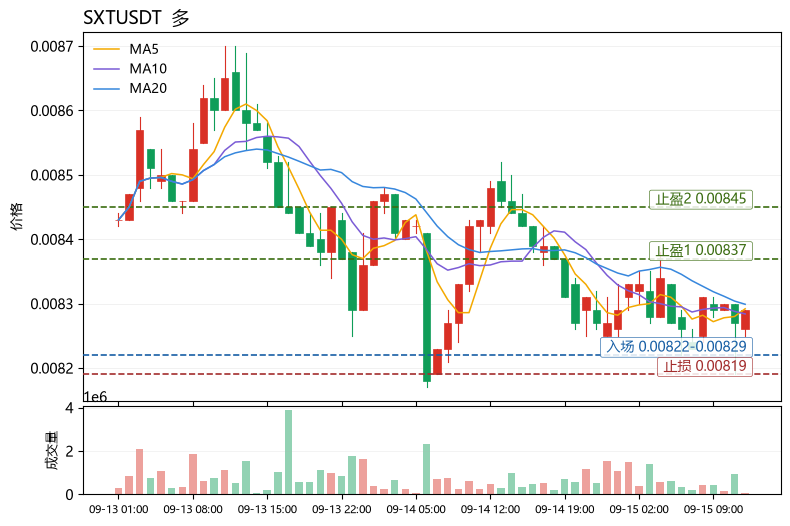
This page is for research only and is not investment advice. Models can be wrong. Past performance does not guarantee future results.