
強
強気
強気 · 25%ORCL
$183.84
シナリオ価格
$126.060
-0.101 (-0.08%)終値時点
Oracle Corporation offers integrated suites of applications plus secure, autonomous infrastructure in the Oracle Cloud. The Company operates through three businesses: cloud and license, hardware and service. Its cloud and license business is engaged in the sale, marketing and delivery of its enterprise applications and infrastructure technologies through cloud and on-premise deployment models including its cloud services and license support offerings, and its cloud license and on-premise license offerings. Its hardware business provides infrastructure technologies including Oracle Engineered Systems, servers, storage, industry-specific hardware, operating systems, virtualization, management and other hardware-related software to support diverse IT environments. Its services business provides services to customers and partners to help maximize the performance of their investments in Oracle applications and infrastructure technologies.
Currently, Oracle Corp is not a strong buy due to its low RSI of 33.916, indicating it is oversold, and a significant year-to-date decline of 35.54%. However, the company has shown resilience with a gross margin of 62.97% and a forward P/E ratio of 17.762, suggesting potential for future growth. The main risk is the declining gross margin trend, which has dropped from 67.90% to 62.97% over the past year, indicating potential profitability concerns.
Freedom Broker
$205
2026-09-14
Freedom Broker
2026-09-14
目標株価
$205
BMO Capital
$195
2026-09-11
BMO Capital
2026-09-11
目標株価
$195
UBS
$250
2026-09-11
UBS
2026-09-11
目標株価
$250
RBC Capital
$165
2026-09-11
RBC Capital
2026-09-11
目標株価
$165
Stifel
$200
2026-09-11
Stifel
2026-09-11
目標株価
$200
シナリオ価格は本年の最終月次予想レンジです。確率はモデルの固定ウェイト(25 / 50 / 25)であり、保証ではありません。

Oracle Unveils New Capabilities for AI Data Platform
Oracle Acceleron Enhancements Boost AI Infrastructure Efficiency
Oracle Partners with OpenAI to Transform Enterprise AI Operations
Oracle Launches Integrated Media Platform
Oracle Partners with Snowflake to Launch AI Service on OCI
Oracle Corporation offers integrated suites of applications plus secure, autonomous infrastructure in the Oracle Cloud. The Company operates through three businesses: cloud and license, hardware and service. Its cloud and license business is engaged in the sale, marketing and delivery of its enterprise applications and infrastructure technologies through cloud and on-premise deployment models including its cloud services and license support offerings, and its cloud license and on-premise license offerings. Its hardware business provides infrastructure technologies including Oracle Engineered Systems, servers, storage, industry-specific hardware, operating systems, virtualization, management and other hardware-related software to support diverse IT environments. Its services business provides services to customers and partners to help maximize the performance of their investments in Oracle applications and infrastructure technologies. It operates in the Technology sector (SERVICES-PREPACKAGED SOFTWARE industry).
Currently, Oracle Corp is not a strong buy due to its low RSI of 33.916, indicating it is oversold, and a significant year-to-date decline of 35.54%. However, the company has shown resilience with a gross margin of 62.97% and a forward P/E ratio of 17.762, suggesting potential for future growth. The main risk is the declining gross margin trend, which has dropped from 67.90% to 62.97% over the past year, indicating potential profitability concerns.
36 analysts cover ORCL: 26 rate it Buy, 9 Hold and 1 Sell. The average price target is 309.59.

$ORCL is well positioned, with a few potential reversal candles in place, and today's gap up confirms it.
もっと見る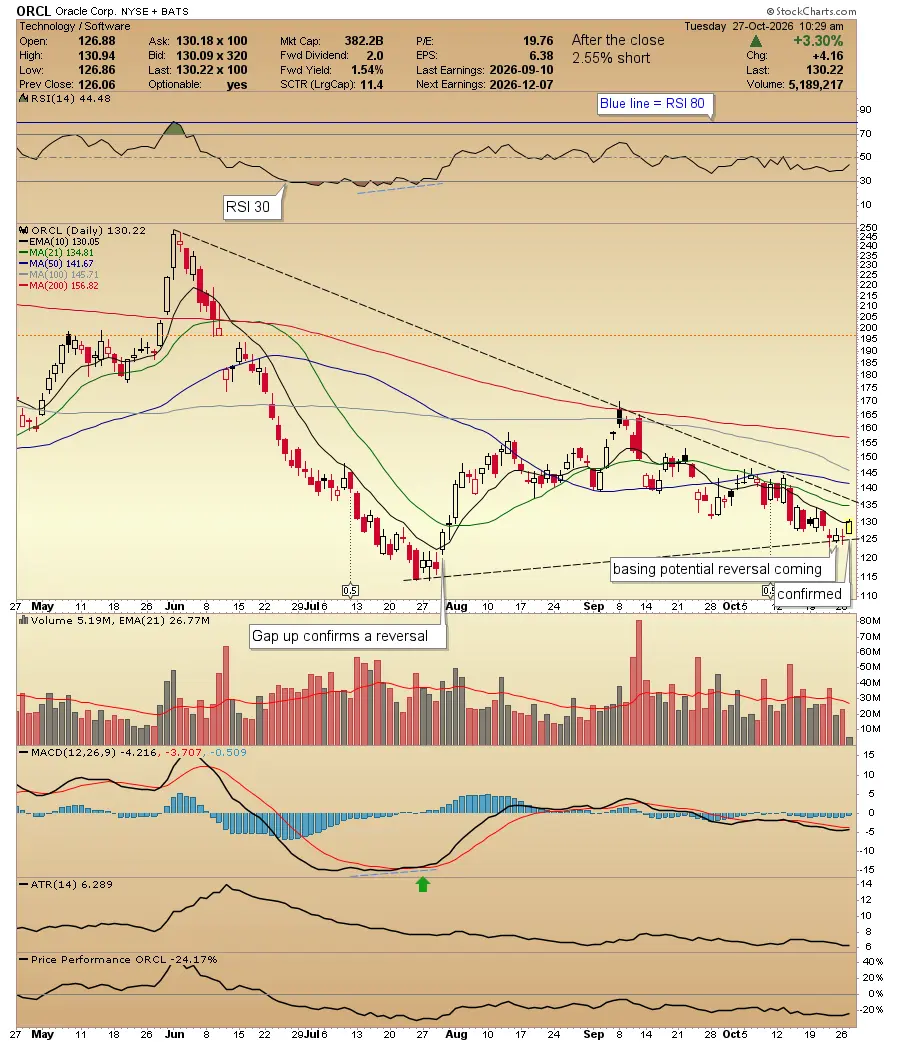


#US Earnings Season #Gate Plaza Halloween AI Computing Power: Money Is Pouring In, Supply Can't Keep Up—So Why Are Stock Prices Falling First? AI computing power is still the "lifeblood" main line of US stocks—demand is genuinely tight, money is genuinely pouring in, but stock prices are no longer rising blindly. This October pullback is simply squeezing out bubbles and washing out crowded trades, not a fundamental problem. How strong is demand? The four major cloud providers' combined capital expenditure for 2026 is roughly $725–730 billion, up nearly 80% from last year. Goldman Sachs says it could head straight to $1.14 trillion by 2027. And even that spending isn't enough—Amazon's CEO said outright that even burning $220 billion this year, demand in 2026 and 2027 still won't be satisfied. AWS GPU rental prices have risen 15% directly. When cloud providers dare to raise prices these days, it means supply is truly constrained. What about supply? Nvidia's latest quarterly report: revenue of $96.2 billion, up 106% year-over-year; data center segment at $89 billion, up 117% year-over-year; next quarter guidance of $108 billion. Jensen Huang's exact words were that orders are "pouring in almost weekly, almost daily," with customer forecasts booked out one to two years. He also shared a striking number: Nvidia now collects over $40 billion for every 1GW of AI data center equipment it sells, more than double the previous $18 billion. But why did stock prices fall in October? Nvidia fell from an intraday high of $243.37 on October 6 all the way to $210.96, down 7.6% in a month, with market cap shrinking to $5.08 trillion. Mainly two sudden brakes: one was the OpenAI situation on October 8—the market had rumored its annualized revenue was near $70 billion, but the company confirmed it was just over $50 billion, with the $20 billion gap purely due to different statistical methods. But the market didn't care—that day Nvidia fell 3%, Oracle 6%, CoreWeave 8%. The other was the semiconductor sector's collective crash on October 22, with the Philadelphia Semiconductor Index dropping 6.7% in a single day. Put simply: no matter how good the story, the market is starting to get serious—"AI has a bright future" alone isn't enough; performance has to speak. Where's the biggest risk? OpenAI alone owes Oracle, Microsoft, Amazon, and CoreWeave a combined $600+ billion in computing procurement commitments, yet its current annualized revenue is only around $50 billion—how this money will be repaid and how IPO funding will sustain it is the most critical issue in the entire chain. Additionally, Morgan Stanley ran the numbers: AI capital expenditure will be roughly $1.58 trillion in 2027 and $1.81 trillion in 2028, but growth will fall from 100% this year all the way to 14% by 2028—the market is now afraid this "deceleration expectation" will detonate early. Another hidden concern is power: factoring in the pace of power plant construction, the US may face a 32GW power gap in 2028, expanding to 72GW by 2029. Chips manufactured but no power to run them—that's the real awkward situation. What to watch next? Nvidia's November earnings (guidance is $108 billion—see if it delivers); the four major cloud providers' Q3 earnings commentary on 2027 capital expenditure; OpenAI's financing and IPO progress. If cloud providers suddenly cut capital expenditure guidance, or Nvidia's earnings miss expectations, then the "supply-demand gap" story collapses, and the script needs to change fast [threshold · analytical setting, reason: cloud providers' spending is the direct source of Nvidia's revenue, and guidance cuts are the earliest visible signal of a turn]. The computing power theme has hard fundamentals but fragile sentiment. Whether this drop is a shakeout or an inflection point depends on those signals above—chasing highs purely on slogans will get you hurt in this market. The above is casual research sharing only and does not constitute any investment advice.
もっと見る

本ページは調査目的であり、投資助言ではありません。モデルは誤ることがあります。過去の実績は将来の成果を保証しません。