
強
強気
強気 · 25%HIMX
$8.53
シナリオ価格
$11.980
-0.653 (-5.45%)終値時点
Himax Technologies Inc is mainly engaged in the fabless semiconductor solution. The Company offers comprehensive automotive integrated circuit (IC) solutions, including traditional driver ICs, in-cell touch and display driver integration, large touch and display driver integration and local dimming timing controllers. The Company's principal product lines include display drivers and timing controllers, touch controller ICs, thin film transistor liquid crystal display (TFT-LCD) television and monitor semiconductor solutions, intellectual property (IP) and application specific integrated circuit (ASIC) service, liquid crystal on silicon (LCOS) and micro-electro mechanical systems (MEMS) products, power ICs, complementary metal-oxide-semiconductor (CMOS) image sensor product, and wafer level optics products.
Himax Technologies Inc is currently a hold. The stock is priced at $13.30, which is significantly below the analyst price target of $30, indicating potential upside. However, the RSI is at 31.78, suggesting the stock is oversold and may not be the best buy right now. Additionally, the stock has seen a 12.73% decline over the past 5 days, indicating short-term weakness, although it has a strong YTD change of +55.92%. The main risk is the high P/E ratio of 65.03, which may deter value-focused investors.
Baird
$30
2026-05-08
Baird
2026-05-08
目標株価
$30
Morgan Stanley
$8
2026-02-04
Morgan Stanley
2026-02-04
目標株価
$8
Morgan Stanley
$8.80
2025-05-09
Morgan Stanley
2025-05-09
目標株価
$8.80
Baird
$15
2024-12-13
Baird
2024-12-13
目標株価
$15
Credit Suisse
$8
2023-08-11
Credit Suisse
2023-08-11
目標株価
$8
シナリオ価格は本年の最終月次予想レンジです。確率はモデルの固定ウェイト(25 / 50 / 25)であり、保証ではありません。

Himax Partners with Alibaba to Launch Next-Gen Smart Glasses

Robotics Industry Presents New Investment Opportunities
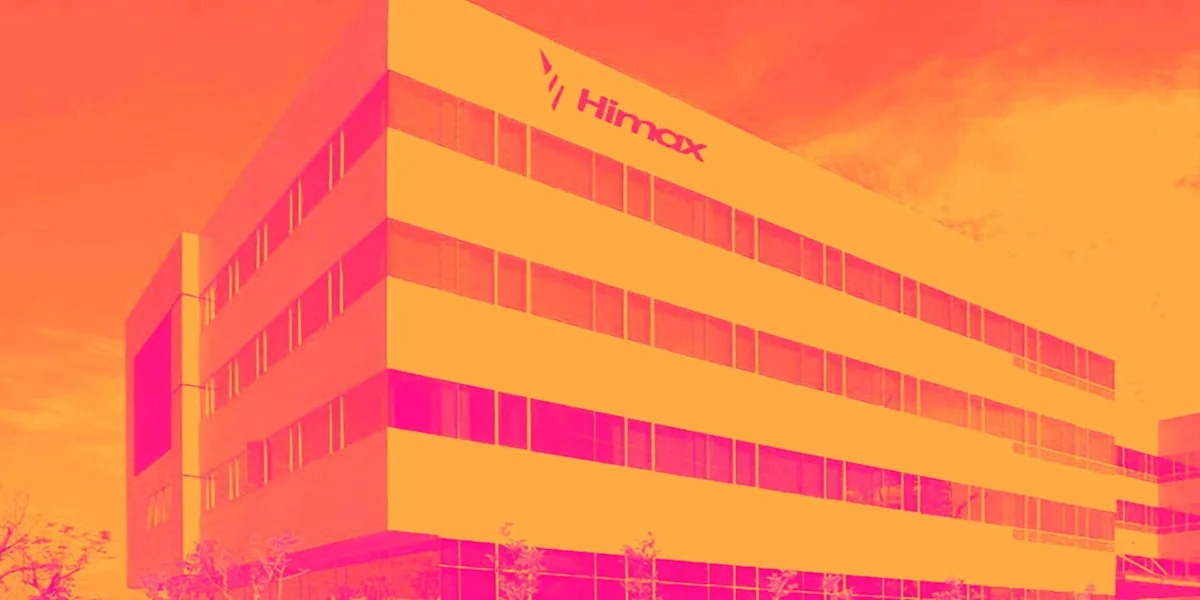
Himax Stock Rises After Launching Automotive Display Chip
Himax Showcases Automotive Display Tech and 3D Sensing Innovations
Himax Unveils High-Performance Automotive TDDI Chip
Himax Technologies Inc is mainly engaged in the fabless semiconductor solution. The Company offers comprehensive automotive integrated circuit (IC) solutions, including traditional driver ICs, in-cell touch and display driver integration, large touch and display driver integration and local dimming timing controllers. The Company's principal product lines include display drivers and timing controllers, touch controller ICs, thin film transistor liquid crystal display (TFT-LCD) television and monitor semiconductor solutions, intellectual property (IP) and application specific integrated circuit (ASIC) service, liquid crystal on silicon (LCOS) and micro-electro mechanical systems (MEMS) products, power ICs, complementary metal-oxide-semiconductor (CMOS) image sensor product, and wafer level optics products. It operates in the Technology sector.
Himax Technologies Inc is currently a hold. The stock is priced at $13.30, which is significantly below the analyst price target of $30, indicating potential upside. However, the RSI is at 31.78, suggesting the stock is oversold and may not be the best buy right now. Additionally, the stock has seen a 12.73% decline over the past 5 days, indicating short-term weakness, although it has a strong YTD change of +55.92%. The main risk is the high P/E ratio of 65.03, which may deter value-focused investors.
11 analysts cover HIMX: 8 rate it Buy, 1 Hold and 2 Sell. The average price target is 10.00.
投稿はまだありません
登録またはログインして議論に参加本ページは調査目的であり、投資助言ではありません。モデルは誤ることがあります。過去の実績は将来の成果を保証しません。