強
強気
強気 · 25%BROS
$106.57
シナリオ価格
$42.260
-1.504 (-3.56%)終値時点
Dutch Bros Inc. is an operator and franchiser of drive-thru shops, which is focused on serving hand-crafted beverages. The Company sells a range of customizable hot, iced and blended beverages. The Company-operated shops segment includes retail coffee shop sales to end consumers. The Franchising and other segment includes bean and product sales to franchise partners, initial franchise fees, royalties, and marketing fees related to the franchise partners, as well as sales of products through its website. It also sells its proprietary coffee-based Freeze blended beverages and cold brew. Its proprietary Dutch Bros Rebel energy drink, which is customizable with flavors and modifiers and can be served blended or over ice. It also offers a variety of teas, lemonades, smoothies, and sodas offering caffeine-lite and caffeine-free beverages. The Company has approximately 1,177 shops, of which over 844 are operated by the Company and 333 are franchised, across 25 states.
Dutch Bros Inc is a good buy right now due to its strong sales growth and expansion plans. The company reported a 58% increase in sales over the past three years and plans to open 185 new locations in 2023, aiming for over 2,000 by 2029. Additionally, the stock has seen a recent 5-day change of +8.17%, indicating positive momentum. However, the main risk is its current high P/E ratio of 58.07, which suggests that the stock may be overvalued if growth does not meet expectations.
シナリオ価格は本年の最終月次予想レンジです。確率はモデルの固定ウェイト(25 / 50 / 25)であり、保証ではありません。
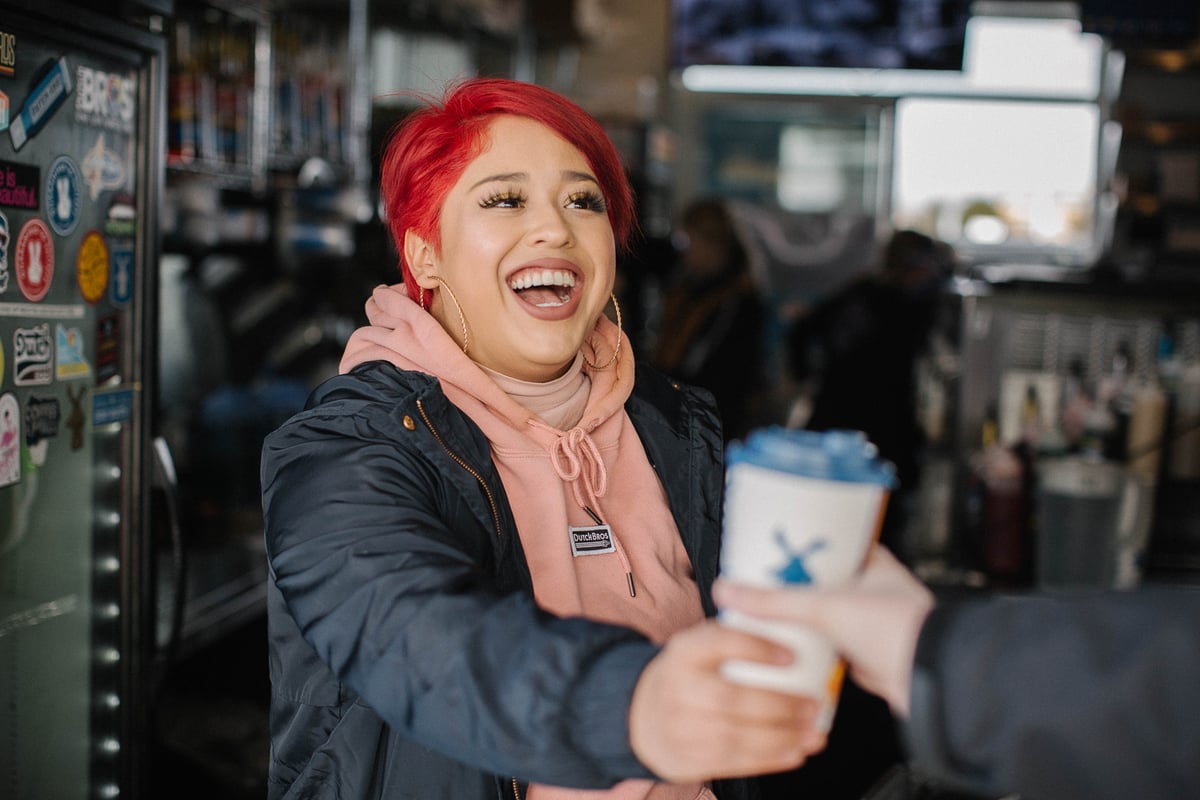
Dutch Bros Expands Rapidly Amid Earnings Expectations

Competitive Analysis of Dutch Bros and e.l.f. Beauty

Dutch Bros Stock Valuation Analysis
Beverage Market Shift: Comparing Dutch Bros and Celsius
Investment Comparison: Dutch Bros vs CAVA Group
Dutch Bros Inc. is an operator and franchiser of drive-thru shops, which is focused on serving hand-crafted beverages. The Company sells a range of customizable hot, iced and blended beverages. The Company-operated shops segment includes retail coffee shop sales to end consumers. The Franchising and other segment includes bean and product sales to franchise partners, initial franchise fees, royalties, and marketing fees related to the franchise partners, as well as sales of products through its website. It also sells its proprietary coffee-based Freeze blended beverages and cold brew. Its proprietary Dutch Bros Rebel energy drink, which is customizable with flavors and modifiers and can be served blended or over ice. It also offers a variety of teas, lemonades, smoothies, and sodas offering caffeine-lite and caffeine-free beverages. The Company has approximately 1,177 shops, of which over 844 are operated by the Company and 333 are franchised, across 25 states. It operates in the Consumer Cyclicals sector (RETAIL-EATING & DRINKING PLACES industry).
Dutch Bros Inc is a good buy right now due to its strong sales growth and expansion plans. The company reported a 58% increase in sales over the past three years and plans to open 185 new locations in 2023, aiming for over 2,000 by 2029. Additionally, the stock has seen a recent 5-day change of +8.17%, indicating positive momentum. However, the main risk is its current high P/E ratio of 58.07, which suggests that the stock may be overvalued if growth does not meet expectations.
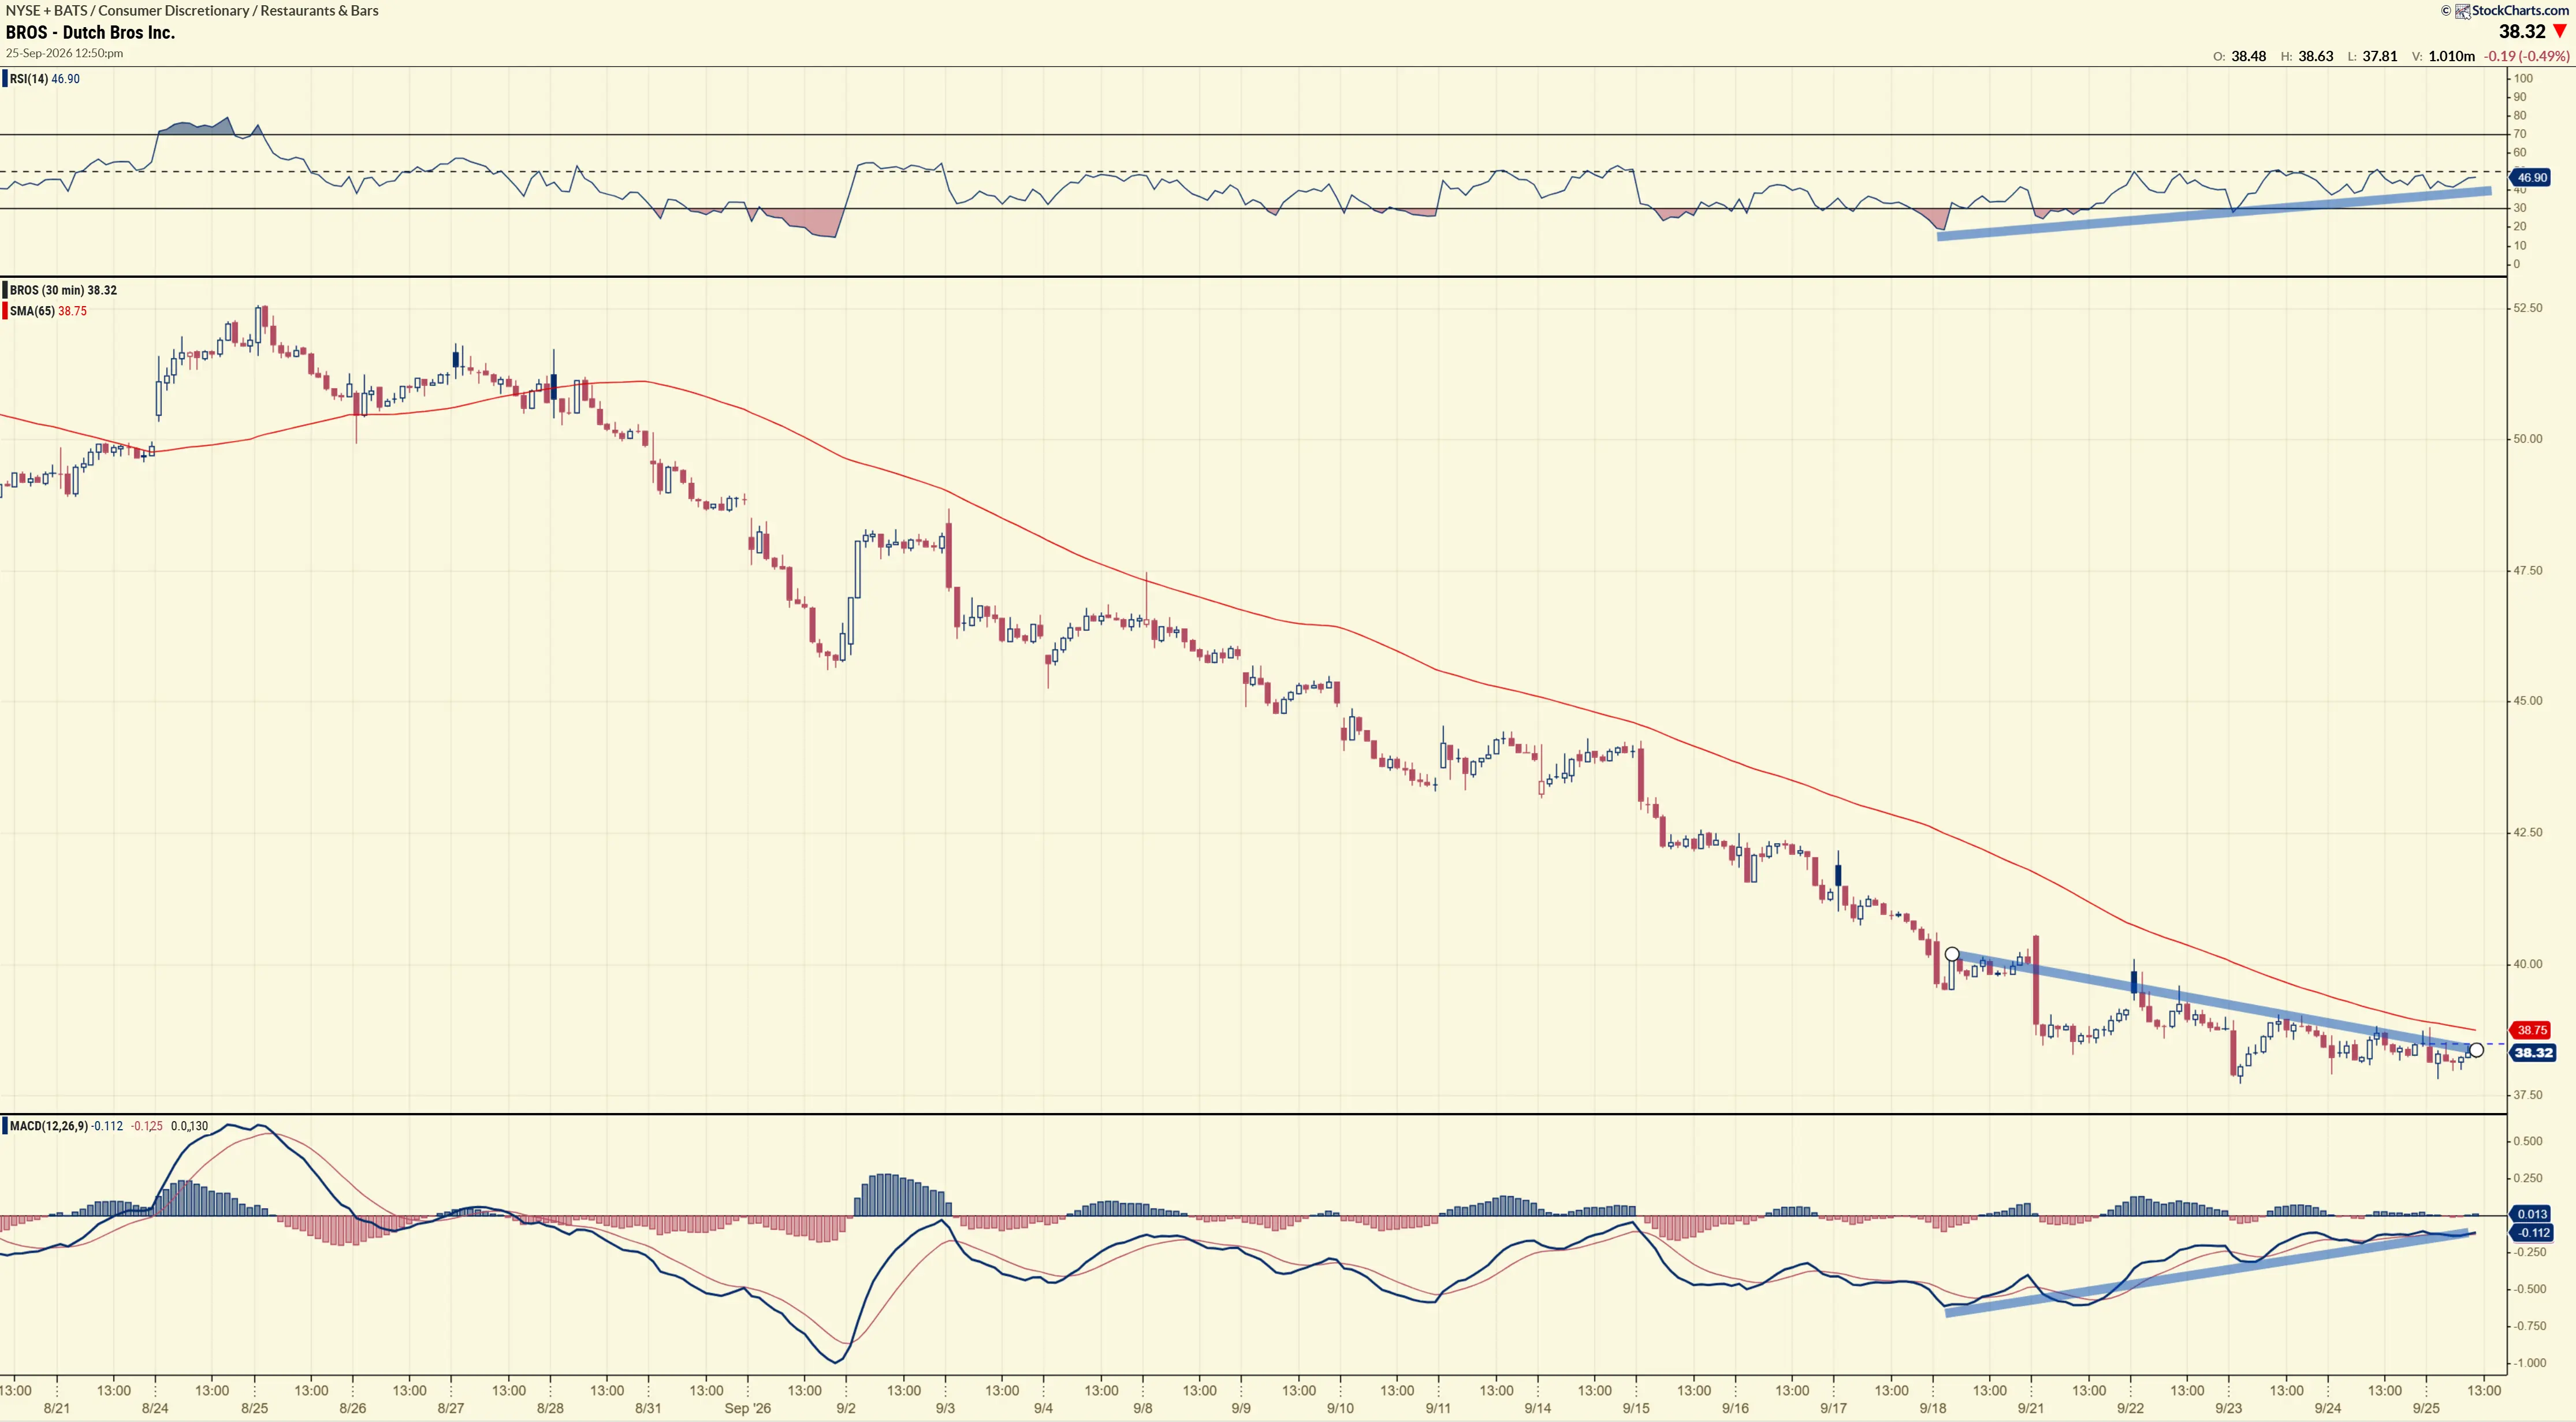
$BROS revenue up 32%. Stock down 49%. Why: - Capex raised ~30% to $360M, eating most of the cash flow - Lost the Salad and Go deal - Analysts cut targets to $60 Now on the wedge low at $38, weekly RSI 31. Hold $36, path to $45 to test the 200DMA📈
もっと見る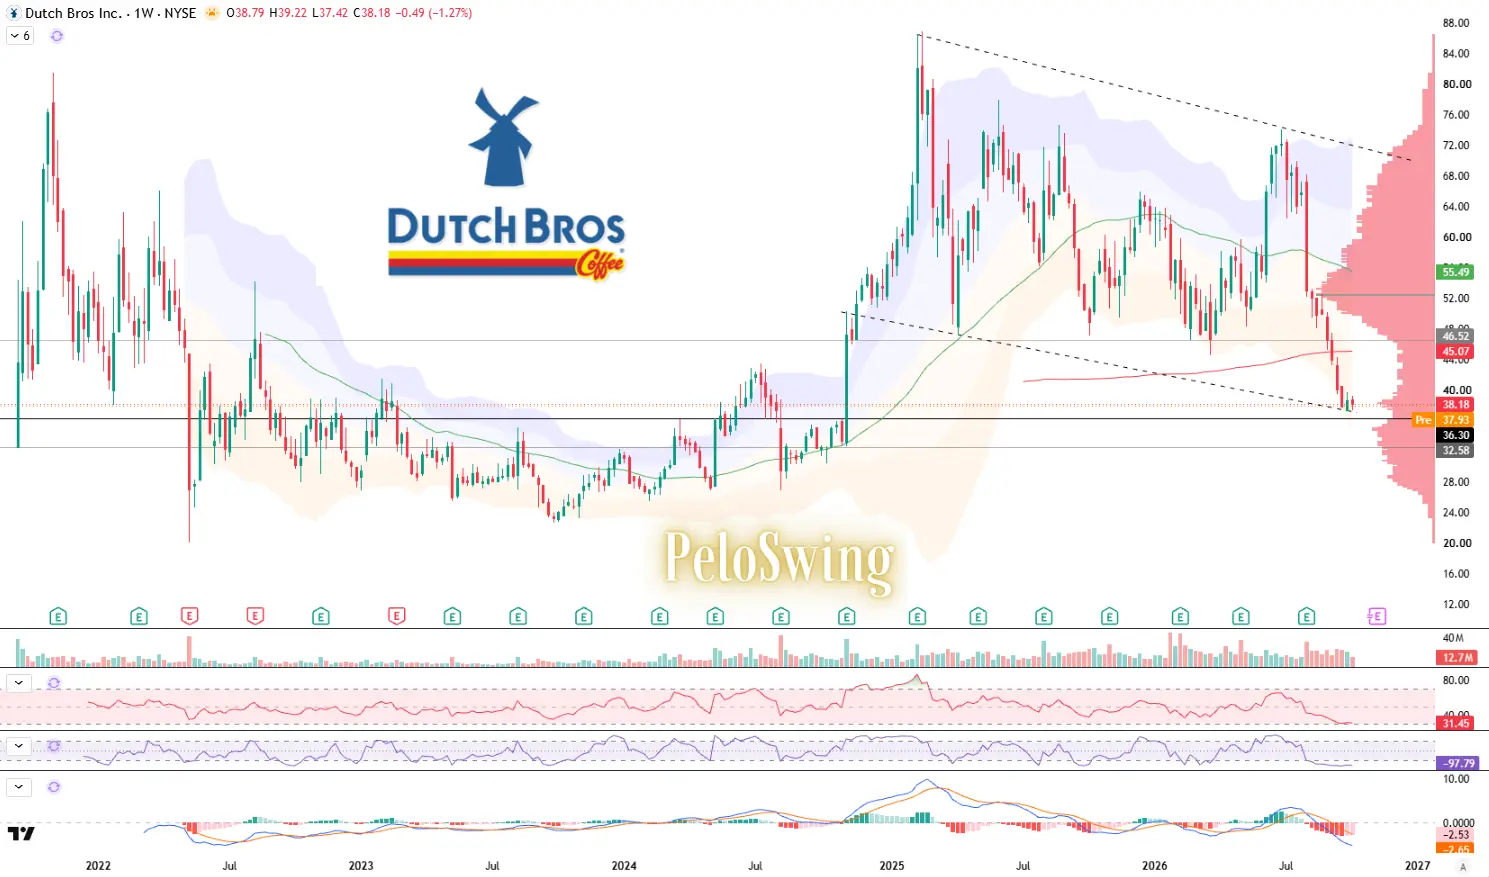

$BROS Weekly looks amazing (and we're lowering our average on shares) Price has never been so low compared to Revenue ☕️
もっと見る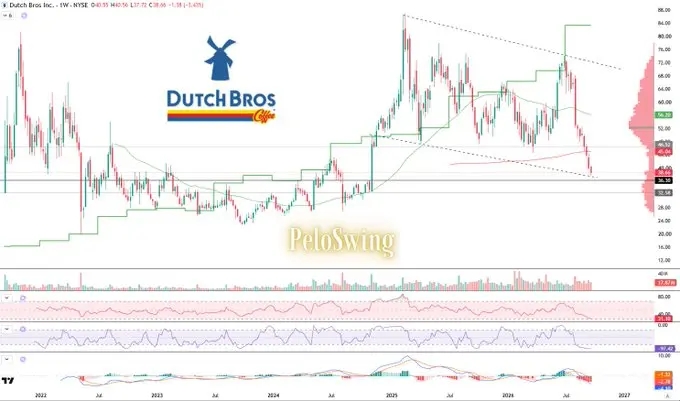
本ページは調査目的であり、投資助言ではありません。モデルは誤ることがあります。過去の実績は将来の成果を保証しません。