
強
強気
強気 · 25%BR
$282.30
シナリオ価格
$175.110
+0.998 (+0.57%)終値時点
Broadridge Financial Solutions, Inc. is a global technology company with specialization and transformative technology, helping clients and the financial services industry operate, innovate, and grow. Its segments include Investor Communication Solutions (ICS) and Global Technology and Operations (GTO). Its ICS segment provides Regulatory Solutions, Data-Driven Fund Solutions, Corporate Issuer Solutions, and Customer Communications Solutions. The ICS business involves the processing and distribution of proxy materials to investors in equity securities and mutual funds, and the facilitation of related vote processing. The Global Technology and Operations business offers mission-critical, scale infrastructure to the global financial markets. Its component-based platform automates the front-to-back transaction lifecycle of equity, mutual funds, fixed income, and foreign exchange and exchange-traded derivatives. It also offers cross-border fund distribution and regulatory services.
Broadridge Financial Solutions Inc is a good buy right now due to its strong earnings performance, with a reported EPS of $3.82, exceeding the estimate of $3.75, and a forward P/E ratio of 15.456, indicating potential for growth. Additionally, the stock has seen a 5-day change of +5.84%, suggesting positive momentum. However, the main risk is the year-to-date change of -20.57%, reflecting volatility in the market.
RBC Capital
$226
2026-08-31
RBC Capital
2026-08-31
目標株価
$226
Morgan Stanley
$176
2026-08-06
Morgan Stanley
2026-08-06
目標株価
$176
Morgan Stanley
$169
2026-05-10
Morgan Stanley
2026-05-10
目標株価
$169
DA Davidson
$214
2026-05-05
DA Davidson
2026-05-05
目標株価
$214
UBS
$165
2026-05-04
UBS
2026-05-04
目標株価
$165
シナリオ価格は本年の最終月次予想レンジです。確率はモデルの固定ウェイト(25 / 50 / 25)であり、保証ではありません。

Broadridge DLR Achieves $359 Billion Daily Transactions

Broadridge Board Announces Leadership Change

Broadridge Board Member Transition Announced

Broadridge and KSD Sign MOU to Enhance Korean Capital Market

Broadridge and KSD Sign MOU to Enhance Korean Capital Market
Broadridge Financial Solutions, Inc. is a global technology company with specialization and transformative technology, helping clients and the financial services industry operate, innovate, and grow. Its segments include Investor Communication Solutions (ICS) and Global Technology and Operations (GTO). Its ICS segment provides Regulatory Solutions, Data-Driven Fund Solutions, Corporate Issuer Solutions, and Customer Communications Solutions. The ICS business involves the processing and distribution of proxy materials to investors in equity securities and mutual funds, and the facilitation of related vote processing. The Global Technology and Operations business offers mission-critical, scale infrastructure to the global financial markets. Its component-based platform automates the front-to-back transaction lifecycle of equity, mutual funds, fixed income, and foreign exchange and exchange-traded derivatives. It also offers cross-border fund distribution and regulatory services. It operates in the Industrials sector (SERVICES-BUSINESS SERVICES, NEC industry).
Broadridge Financial Solutions Inc is a good buy right now due to its strong earnings performance, with a reported EPS of $3.82, exceeding the estimate of $3.75, and a forward P/E ratio of 15.456, indicating potential for growth. Additionally, the stock has seen a 5-day change of +5.84%, suggesting positive momentum. However, the main risk is the year-to-date change of -20.57%, reflecting volatility in the market.
6 analysts cover BR: 1 rate it Buy, 5 Hold and 0 Sell. The average price target is 267.80.


🚨 CRYPTO MARKET MOVERS — ETH, NIL & BR! 🔥📈 Altcoin momentum is heating up! BR is leading with an impressive gain, NIL is surging, and ETH is also moving higher. Here's today's watchlist for traders. 👇 🔵 ETH — Ethereum 📈 Change: +2.66% Ethereum is showing positive momentum. Watch for sustained buying volume and a confirmed breakout above resistance to support further upside. A rejection could trigger short-term consolidation. 🚀 NIL — Strong Momentum 📈 Change: +18.89% NIL is making a strong upward move and attracting attention. Traders should watch whether buyers can maintain momentum or whether profit-taking appears after the rally. 🔥 BR — Top Performer 📈 Change: +34.77% BR is leading this group with the biggest percentage gain. Such a sharp move can create opportunities, but volatility and sudden reversals can also increase significantly. 🎯 TRADER'S WATCHLIST 🥇 BR: Strongest momentum — watch for a confirmed breakout or pullback. 🥈 NIL: Monitor buying pressure and resistance. 🥉 ETH: Watch for continued recovery and volume confirmation. ⚠️ Trading Reminder: Don't chase green candles. Wait for confirmation, manage position size, and define your stop-loss before entering. 💬 Which one could make the next big move — ETH, NIL, or BR? Drop your pick below! 👇 Educational purposes only — not financial advice. $ETH $NIL $BR
もっと見る
$BR $AVA $PHA 🚀 $PHA IS RALLYING STRONGLY CAN IT BREAK $0.062? 🔥 $PHA is trading near $0.06143, up 28.25% in 24 hours. Bulls are in control, but overbought RSI suggests a possible pullback. 📈 Resistance: $0.06193 – $0.06371 🟢 Support: $0.05973 – $0.04781 A breakout above $0.06193 could open the door to further gains, while rejection may trigger a correction. Wait for confirmation and manage risk carefully. #PHA #CryptoTrading
もっと見る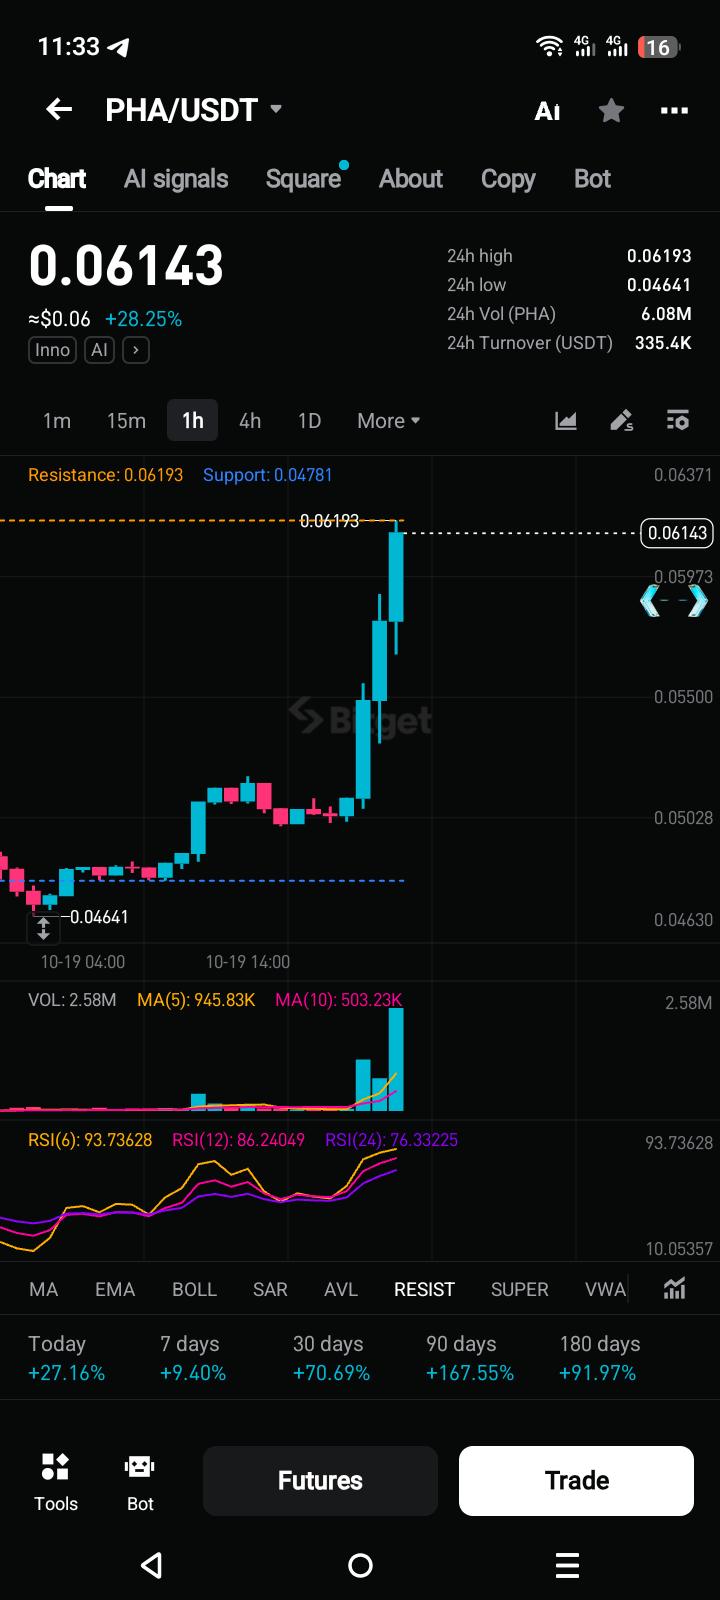


$BR ◆━━━━━━━━━━━━━━━━━━◆ Market Overview Bedrock (BRUSDT Perp) is up over 31% in 24 hours, trading near 0.5348 after tagging a 24h high of 0.5462. After a long slide from the 0.6770 swing high to 0.2918, price has staged a sharp recovery with strong momentum and elevated volatility. ◆━━━━━━━━━━━━━━━━━━◆ Technical Analysis On the 4H chart, price has pushed above the MA(99) near 0.4678, a level that capped rallies for days. MA(7) at 0.4814 has also crossed above MA(25) at 0.4217, a short-term bullish shift. Volume expanded clearly during the breakout candles, which suggests real participation behind the move. After such a fast rally, though, a pullback or retest would be normal and healthy. ◆━━━━━━━━━━━━━━━━━━◆ 🟢 Bullish Case ➤ A 4H close above 0.5462 with steady volume could open the way toward 0.6000 and later the 0.6770 swing high. 🔴 Bearish Case ➤ A close back below 0.4678 (MA99) would signal a failed breakout and risk a drift toward 0.4217. ⚪ Neutral Case ➤ Trading between 0.4800 and 0.5460 would point to consolidation while the market digests the rally. ◆━━━━━━━━━━━━━━━━━━◆ Key Levels ➤ Resistance: R1 0.5462 | R2 0.6770 ➤ Support: S1 0.4814 | S2 0.4678 ◆━━━━━━━━━━━━━━━━━━◆ Outlook Bedrock has reclaimed a key trend filter, but momentum needs follow-through. Watch volume on any retest of the MA zone. For information only. Not financial advice. Always DYOR and manage your risk.
もっと見る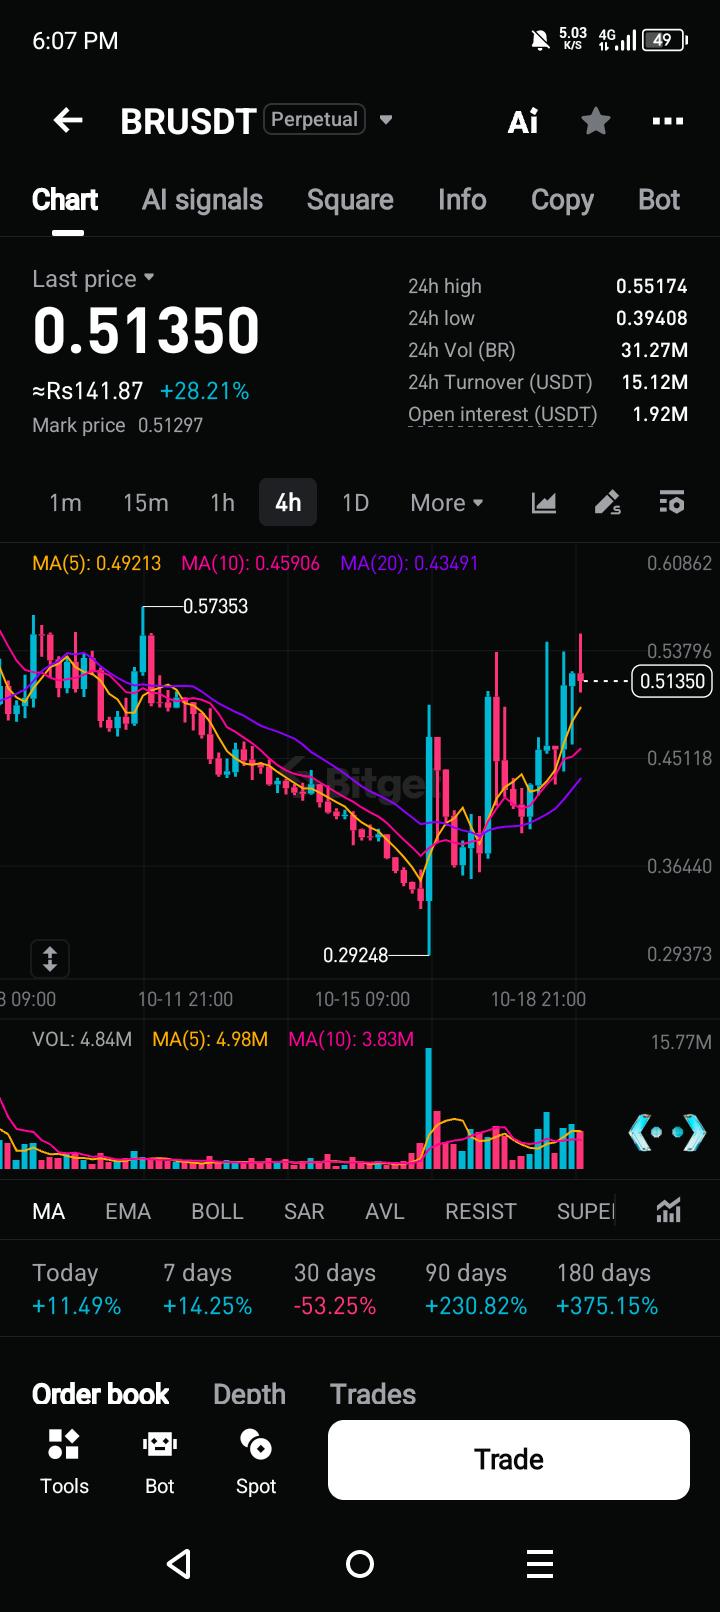
本ページは調査目的であり、投資助言ではありません。モデルは誤ることがあります。過去の実績は将来の成果を保証しません。