A
Alcista
Alcista · 25%GOOGL
$268.91
Precio del escenario
$349.220
+1.571 (+0.45%)Al cierre
Alphabet Inc. is a holding company. The Company's segments include Google Services, Google Cloud, and Other Bets. The Google Services segment includes products and services such as ads, Android, Chrome, devices, Google Maps, Google Play, Search, and YouTube. The Google Cloud segment includes infrastructure and platform services, collaboration tools, and other services for enterprise customers. Its Other Bets segment is engaged in the sale of healthcare-related services and Internet services. Its Google Cloud provides enterprise-ready cloud services, including Google Cloud Platform and Google Workspace. Google Cloud Platform provides access to solutions such as artificial intelligence (AI) offerings, including its AI infrastructure, Vertex AI platform, and Gemini for Google Cloud; cybersecurity, and data and analytics. Google Workspace includes cloud-based communication and collaboration tools for enterprises, such as Calendar, Gmail, Docs, Drive, and Meet.
Alphabet Inc is a good buy right now due to its strong financial performance, highlighted by a gross margin of 61.65% in Q2 2026 and a significant year-over-year net income increase of 93.65% in the same quarter. The current price of $351.66 is well below the average analyst price target of $436.50, indicating substantial upside potential. However, the risk of a class action lawsuit could impact investor sentiment.
Wells Fargo
$417
2026-10-06
Wells Fargo
2026-10-06
Precio objetivo
$417
Citi
$447
2026-10-01
Citi
2026-10-01
Precio objetivo
$447
Tigress Financial
$485
2026-09-17
Tigress Financial
2026-09-17
Precio objetivo
$485
Evercore ISI
$450
2026-09-16
Evercore ISI
2026-09-16
Precio objetivo
$450
Freedom Broker
$400
2026-07-23
Freedom Broker
2026-07-23
Precio objetivo
$400
Los precios por escenario son la última banda de previsión mensual del año en curso. Las probabilidades son pesos fijos del modelo (25 / 50 / 25), no garantías.
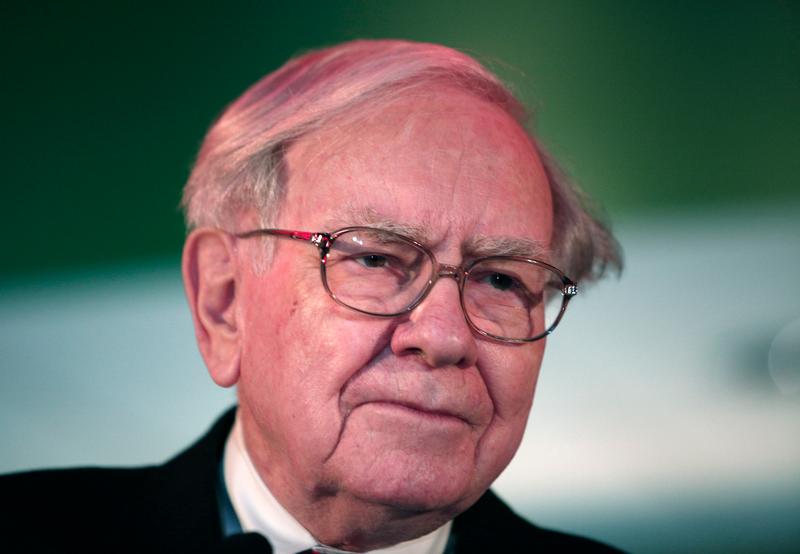
Berkshire's Investment Strategy Post-Buffett Retirement

Billionaire Investors Sell AI Stocks Amid Caution
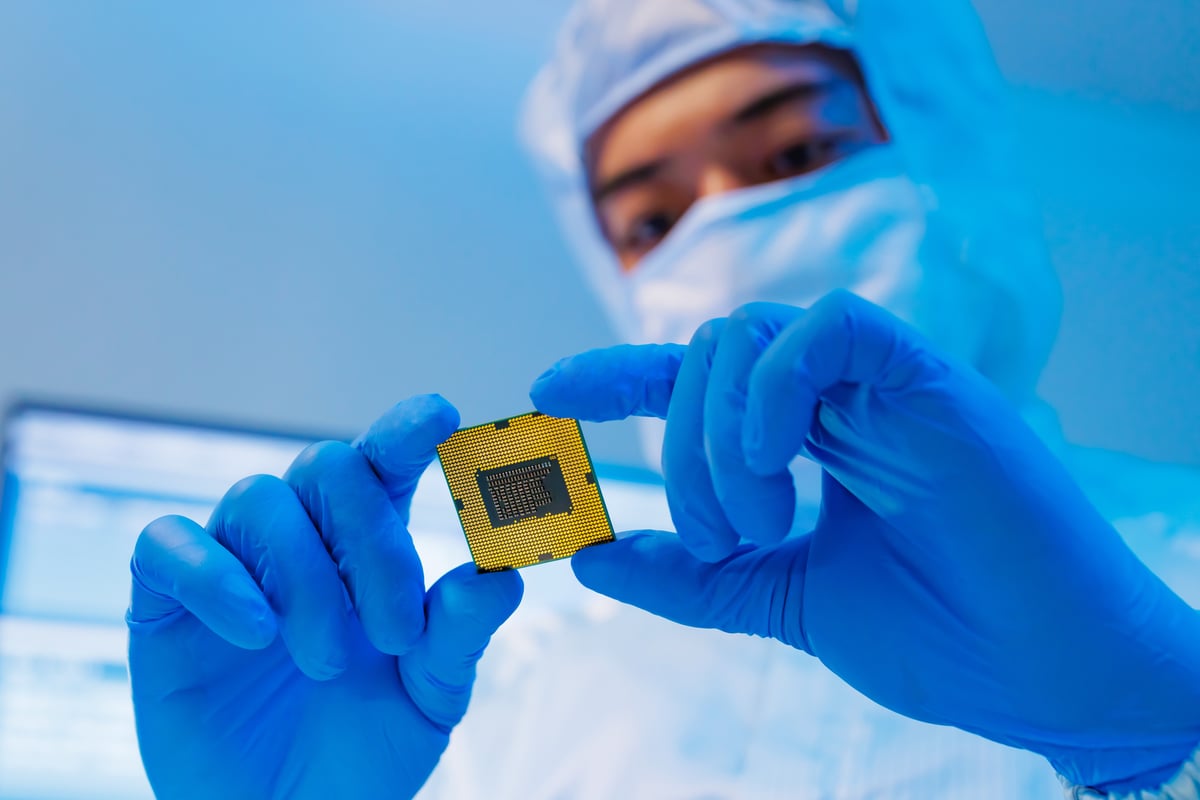
The Critical Importance of Arm Holdings in the Semiconductor Market
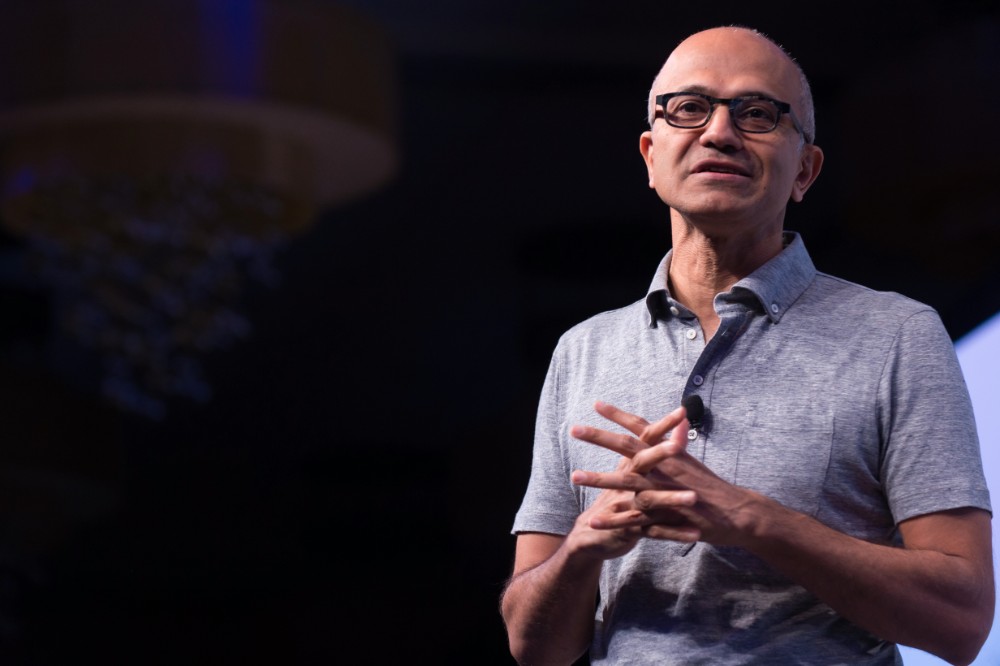
Microsoft to Significantly Increase Custom Chip Usage in Azure Data Centers

SpaceX Executive to Testify at NYC Council Hearing on AI Safety
Alphabet Inc. is a holding company. The Company's segments include Google Services, Google Cloud, and Other Bets. The Google Services segment includes products and services such as ads, Android, Chrome, devices, Google Maps, Google Play, Search, and YouTube. The Google Cloud segment includes infrastructure and platform services, collaboration tools, and other services for enterprise customers. Its Other Bets segment is engaged in the sale of healthcare-related services and Internet services. Its Google Cloud provides enterprise-ready cloud services, including Google Cloud Platform and Google Workspace. Google Cloud Platform provides access to solutions such as artificial intelligence (AI) offerings, including its AI infrastructure, Vertex AI platform, and Gemini for Google Cloud; cybersecurity, and data and analytics. Google Workspace includes cloud-based communication and collaboration tools for enterprises, such as Calendar, Gmail, Docs, Drive, and Meet. It operates in the Technology sector (SERVICES-COMPUTER PROGRAMMING, DATA PROCESSING, ET industry).
Alphabet Inc is a good buy right now due to its strong financial performance, highlighted by a gross margin of 61.65% in Q2 2026 and a significant year-over-year net income increase of 93.65% in the same quarter. The current price of $351.66 is well below the average analyst price target of $436.50, indicating substantial upside potential. However, the risk of a class action lawsuit could impact investor sentiment.
43 analysts cover GOOGL: 38 rate it Buy, 5 Hold and 0 Sell. The average price target is 374.25.

Breaking: Google has reduced quantum computing errors by 40x using magic state cultivation on its Willow processor, with the research published in Science.
Mostrar más


#OpenAIAnnualizedRevenue20BBelowReports OpenAI annualized revenue is below the reported $20 billion. OpenAI revenue estimate is $20 billion lower: what does this mean for the AI industry and global markets? The AI industry is facing a new round of financial reality checks after reports said OpenAI's annualized revenue was close to $50 billion as of the end of September 2026, clearly below the roughly $70 billion widely reported earlier. According to the Financial Times and Reuters, this difference reflects different ways OpenAI and its competitor Anthropic calculate revenue, and does not necessarily mean business demand has suddenly collapsed. Source: Reuters 1. Understanding the $20 billion gap The difference between $70 billion and $50 billion represents a substantial gap in market expectations. However, it is important to understand that the earlier $70 billion figure was based on estimates and comparisons, not a public financial statement confirming that OpenAI had received that amount. OpenAI reportedly excludes some sales generated through cloud partners from its revenue calculation, while Anthropic includes revenue from services sold through partners such as Amazon Web Services and Google Cloud. These different methods can make direct comparisons misleading. Annualized revenue is also a run-rate estimate based on current business performance and does not guarantee actual revenue over the next 12 months. 2. Why this matters for the AI boom Investors closely watch OpenAI's revenue growth because it helps them assess whether the huge investments in AI infrastructure can generate sustainable returns. AI companies need enormous computing power, advanced chips, data centers, energy, and engineering resources. If revenue growth is slower than investors expect, the market may begin to question profitability, capital expenditure, and the long-term sustainability of current valuations. Still, OpenAI's reported annualized revenue of about $50 billion still represents enormous commercial scale. The important question is whether its revenue can continue growing fast enough to support its infrastructure spending and operating costs. 3. Potential impact on NVIDIA and tech stocks The news put pressure on AI-related stocks. An October 8 report said Nvidia fell about 2.9%, Oracle fell 5.5%, and the Nasdaq 100 closed down about 1.4%. These moves highlight how financial markets closely link AI business expectations with semiconductor demand, cloud infrastructure spending, and tech sector valuations. However, one report cannot determine the long-term path of these companies. Investors should distinguish between selloffs driven by temporary sentiment and a real deterioration in underlying business fundamentals. 4. What should investors watch next? The most important indicators include enterprise AI adoption, subscription revenue, computing costs, cloud spending, operating margins, and future financial disclosures. If AI adoption continues to expand and companies show stronger monetization, market confidence may recover. Conversely, slower revenue growth combined with rising infrastructure costs could increase volatility in tech stocks. Crypto investors should also watch broader risk sentiment. Weakness in large tech stocks can sometimes affect Bitcoin and other digital assets, although crypto prices also depend on liquidity, interest rates, institutional flows, and developments specific to the crypto sector. My market outlook I have a cautious neutral view on the short-term trend. The revenue difference creates uncertainty, but it should not automatically be interpreted as evidence that the AI boom is ending. The next phase of the AI industry will depend on measurable revenue growth, efficient infrastructure spending, and sustainable profitability, not just headline valuations. Final view The $20 billion difference reminds investors that before making investment decisions, they must examine how financial data is calculated. In the fast-moving AI economy, transparency, consistent reporting, and real business performance matter more than hype. Follow the data, understand the fundamentals, and manage risk before chasing the next market trend. #OpenAIAnnualizedRevenue20BBelowReports
Mostrar más

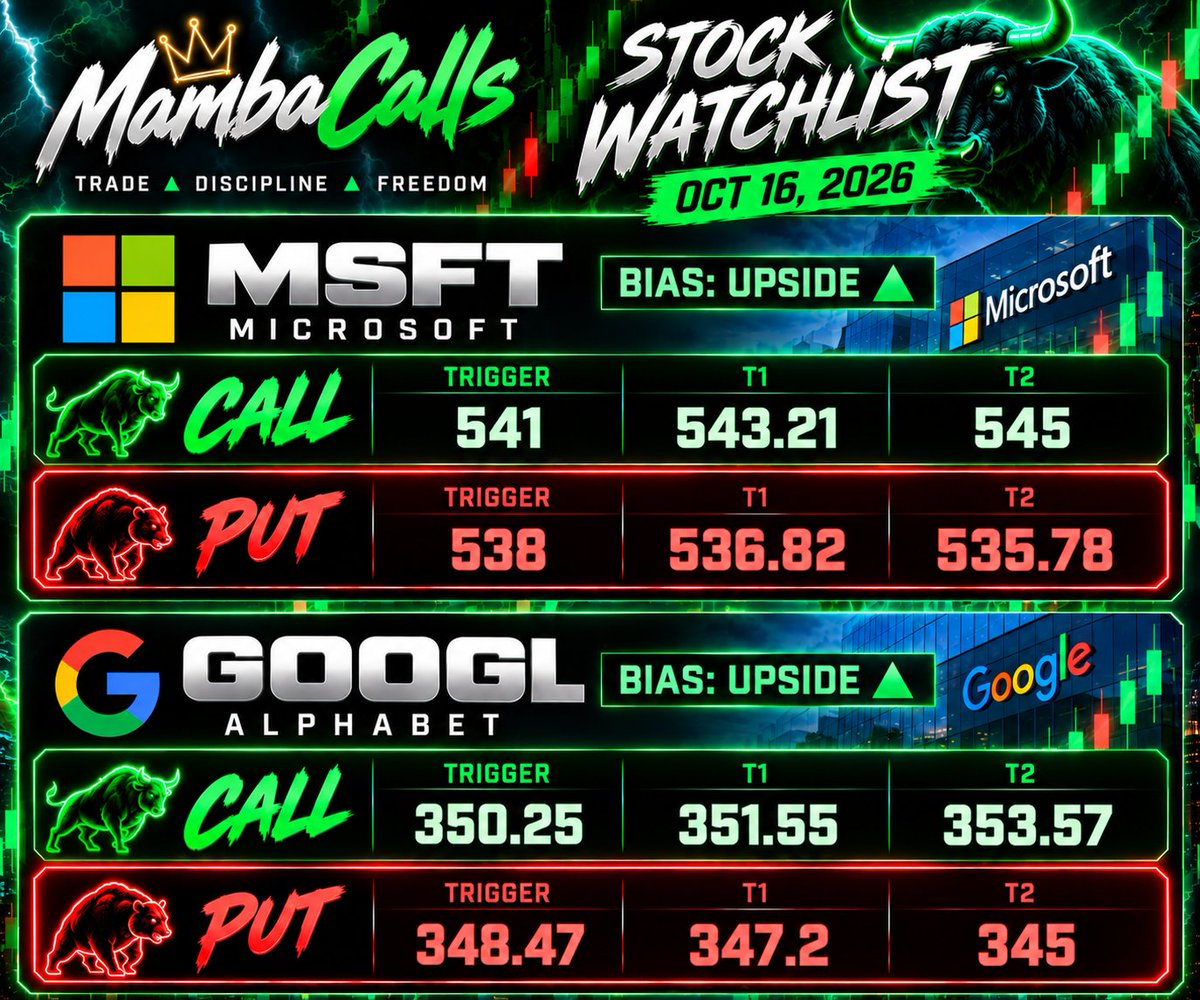
$GOOGL is one of the best-looking Mag Seven setups right now. It is just reclaiming the 50 DMA here, with room back up within this triangle to the top trendline at around ~$363.
Mostrar más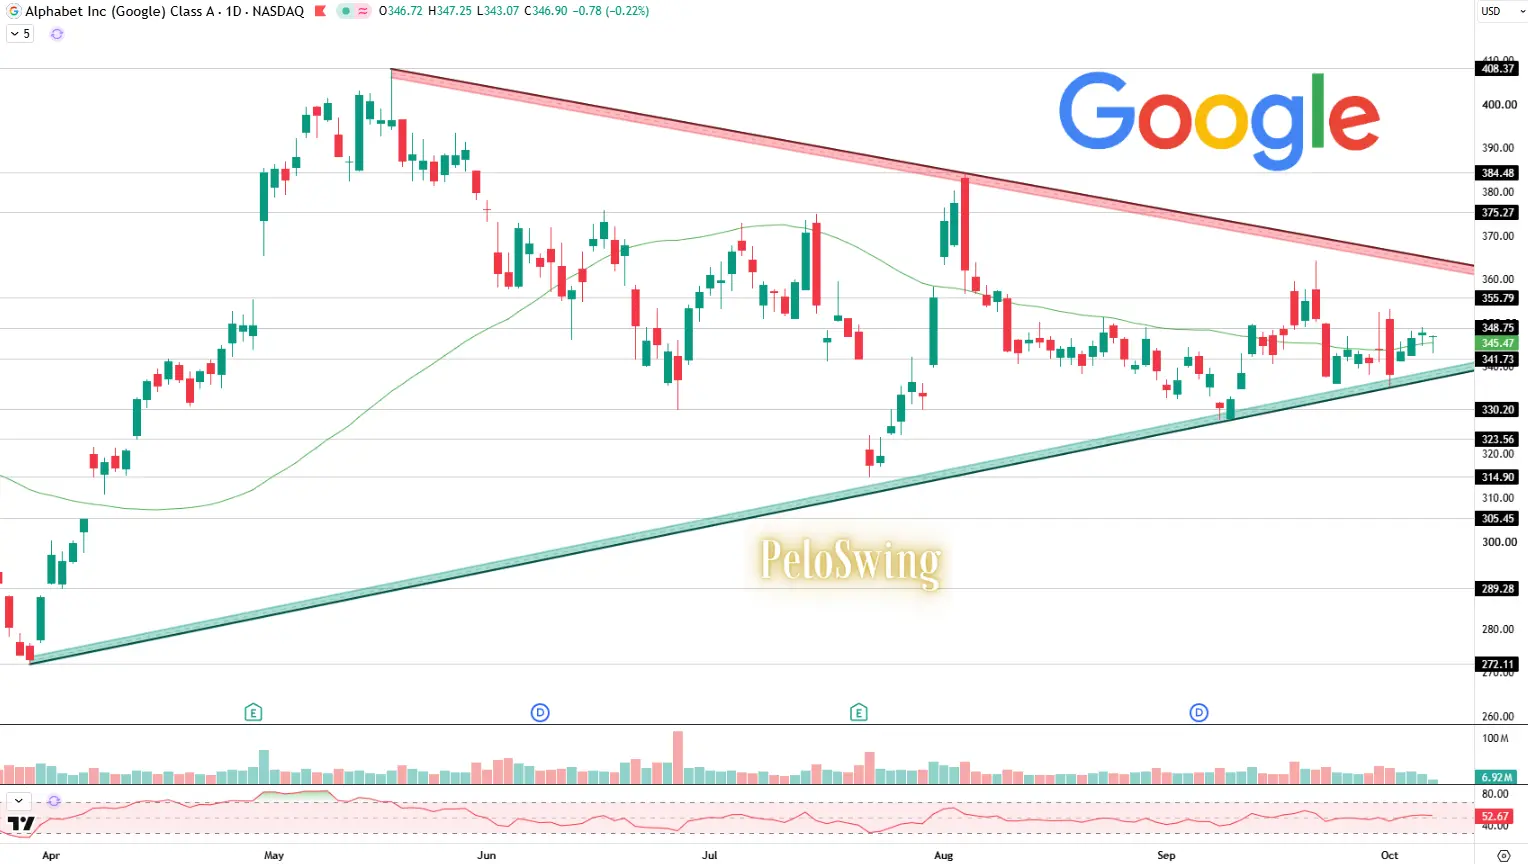

$U (+5.0% pre) $GOOGL Google and Unity partner on an AI gaming platform with no-code tools.
Mostrar másEsta página es solo para investigación y no constituye asesoramiento de inversión. Los modelos pueden equivocarse. El rendimiento pasado no garantiza resultados futuros.