A
Alcista
Alcista · 25%DASH
$238.02
Precio del escenario
$184.010
-8.648 (-4.70%)Al cierre
Doordash, Inc. is engaged in providing services that reduce friction in local commerce and help merchants better connect with consumers in their communities. The Company's primary offerings include the DoorDash Marketplace, the Wolt Marketplace, and the Deliveroo Marketplace (together, the Marketplaces), and its Commerce Platform. Its Marketplaces operate in over 40 countries and provide an integrated suite of services that help merchants establish an online presence, connect with consumers in their communities, and solve mission-critical challenges, such as customer acquisition, demand generation, order fulfillment, merchandising, payment processing, and customer support. The Company also offers advertising as a value-added service through its Marketplaces to help merchants and consumer packaged goods companies increase consumer engagement. It also has offsite advertising capabilities. Its Marketplaces also include consumer membership programs, DashPass, Wolt+, and Deliveroo Plus.
DoorDash Inc is a good buy right now, primarily due to its current price of $196.50 being significantly lower than the analyst price targets of $230 to $275. Additionally, the stock has shown a recent positive momentum with a 5-day change of +3.89% and an RSI of 63.81, indicating strong buying interest. However, the main risk is its high P/E ratio of 99.13, suggesting that the stock may be overvalued if growth does not meet expectations.
Los precios por escenario son la última banda de previsión mensual del año en curso. Las probabilidades son pesos fijos del modelo (25 / 50 / 25), no garantías.
DoorDash Announces Q3 2026 Financial Results Release Date
Costco's Sales Growth Exceeds Expectations

Uber's Acquisition Strategy Draws Investor Scrutiny

Anthropic's IPO Faces Unprecedented Investor Gullibility Test

Anthropic's IPO Could Be 2026's Biggest Risk
Doordash, Inc. is engaged in providing services that reduce friction in local commerce and help merchants better connect with consumers in their communities. The Company's primary offerings include the DoorDash Marketplace, the Wolt Marketplace, and the Deliveroo Marketplace (together, the Marketplaces), and its Commerce Platform. Its Marketplaces operate in over 40 countries and provide an integrated suite of services that help merchants establish an online presence, connect with consumers in their communities, and solve mission-critical challenges, such as customer acquisition, demand generation, order fulfillment, merchandising, payment processing, and customer support. The Company also offers advertising as a value-added service through its Marketplaces to help merchants and consumer packaged goods companies increase consumer engagement. It also has offsite advertising capabilities. Its Marketplaces also include consumer membership programs, DashPass, Wolt+, and Deliveroo Plus. It operates in the Technology sector (SERVICES-BUSINESS SERVICES, NEC industry).
DoorDash Inc is a good buy right now, primarily due to its current price of $196.50 being significantly lower than the analyst price targets of $230 to $275. Additionally, the stock has shown a recent positive momentum with a 5-day change of +3.89% and an RSI of 63.81, indicating strong buying interest. However, the main risk is its high P/E ratio of 99.13, suggesting that the stock may be overvalued if growth does not meet expectations.

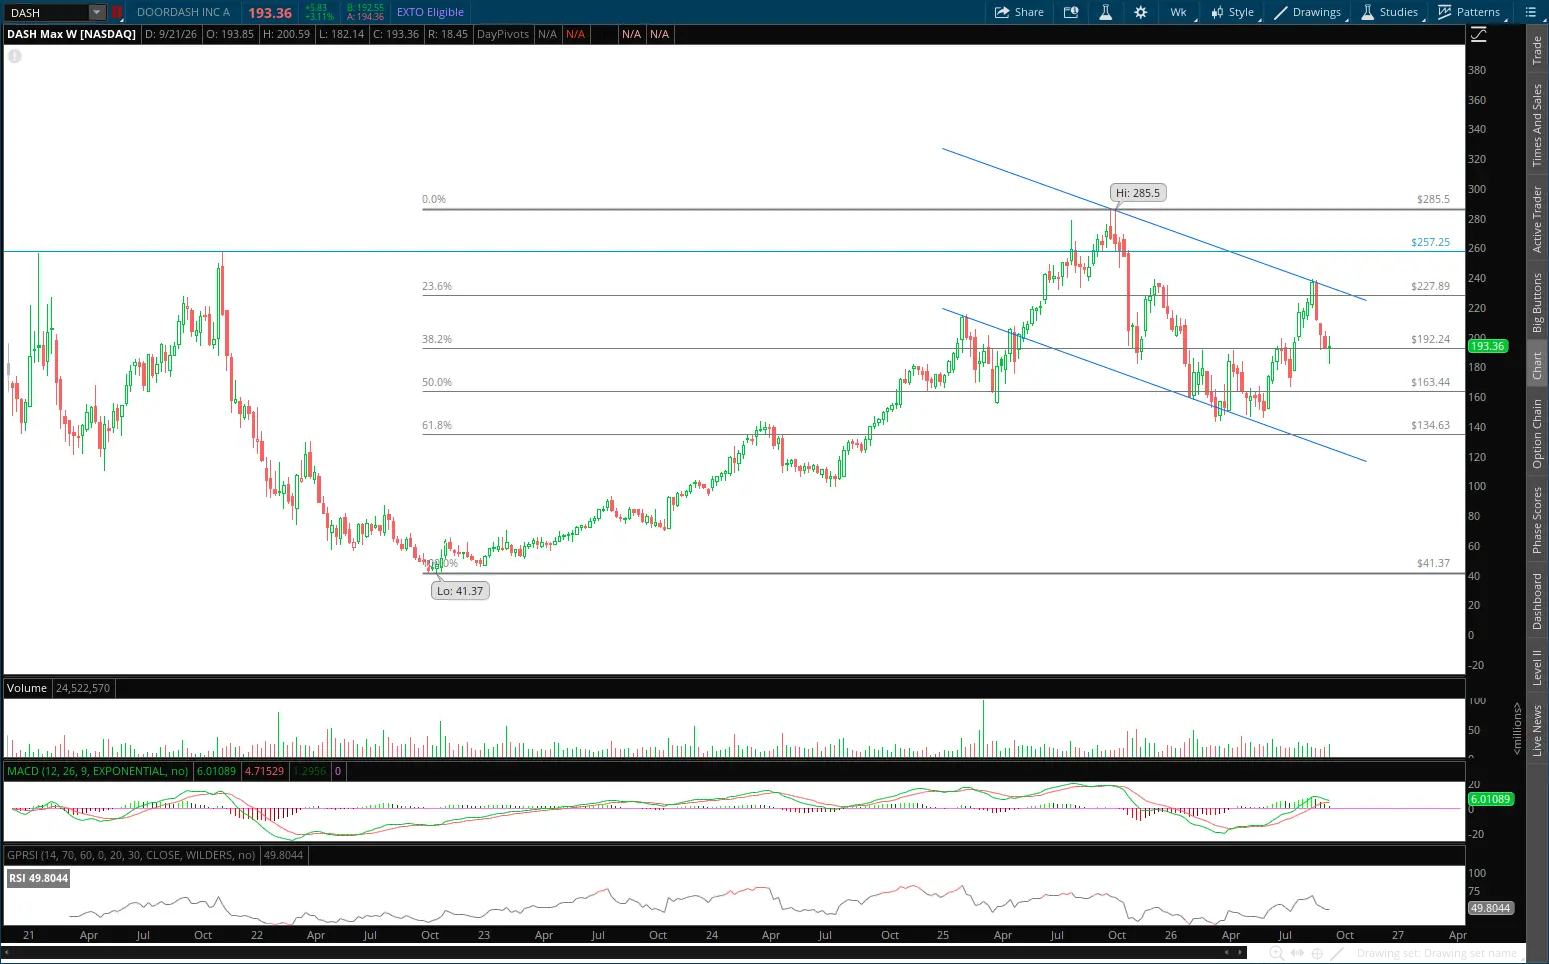
$DASH is not an AI, but it is setting up for AI-like performance soon enough. Buyers were found inside this massive handle in the form of an inverse head and shoulders at the 200SMA. Second add today.
Mostrar más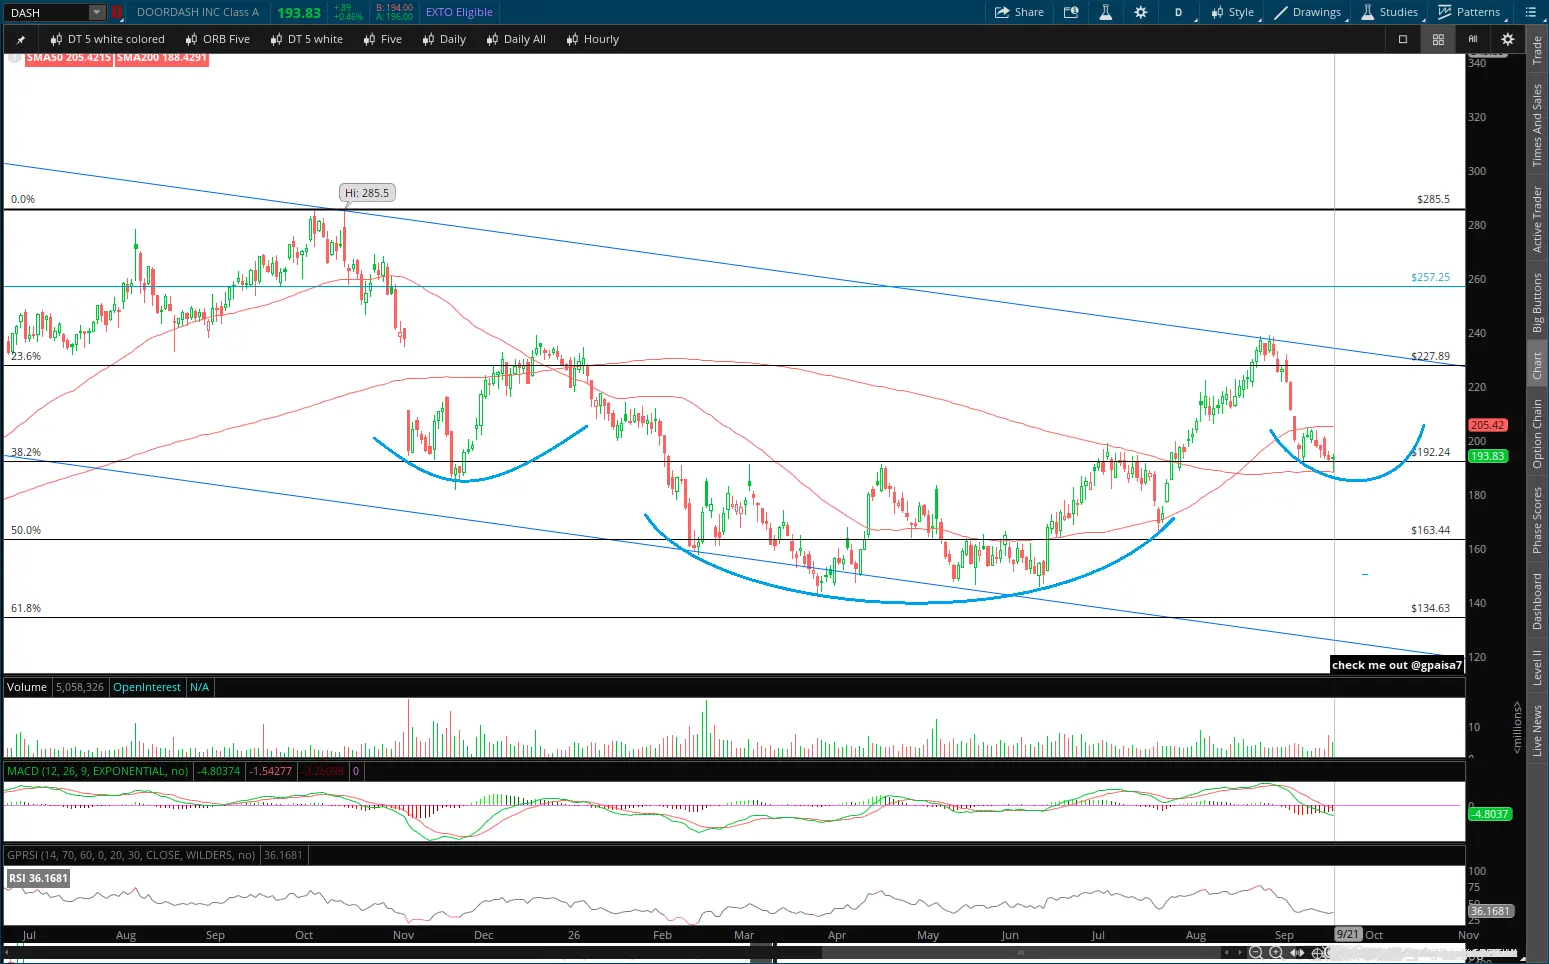
Esta página es solo para investigación y no constituye asesoramiento de inversión. Los modelos pueden equivocarse. El rendimiento pasado no garantiza resultados futuros.