B
Bullisch
Bullisch · 25%SEI
$35.41
Szenariopreis
$65.160
-3.955 (-6.07%)Zum Schluss
Solaris Energy Infrastructure, Inc. delivers comprehensive power infrastructure solutions including generation, distribution, installation and commissioning, aftermarket support, and operations and maintenance. Its segments include Solaris Power Solutions and Solaris Logistics Solutions. Solaris Power Solutions segment delivers power generation, power control, and power distribution solutions. The segment’s offerings support data center, energy, and other commercial and industrial sector customers by providing flexible, on-demand power infrastructure, including power control and distribution capabilities. Solaris Logistics Solutions segment designs and manufactures specialized equipment that enables the efficient management of raw materials used in the completion of oil and natural gas wells. The Company also offers specialized engineering, procurement and construction capabilities in heavy civil construction across multiple end markets, including large-scale data centers.
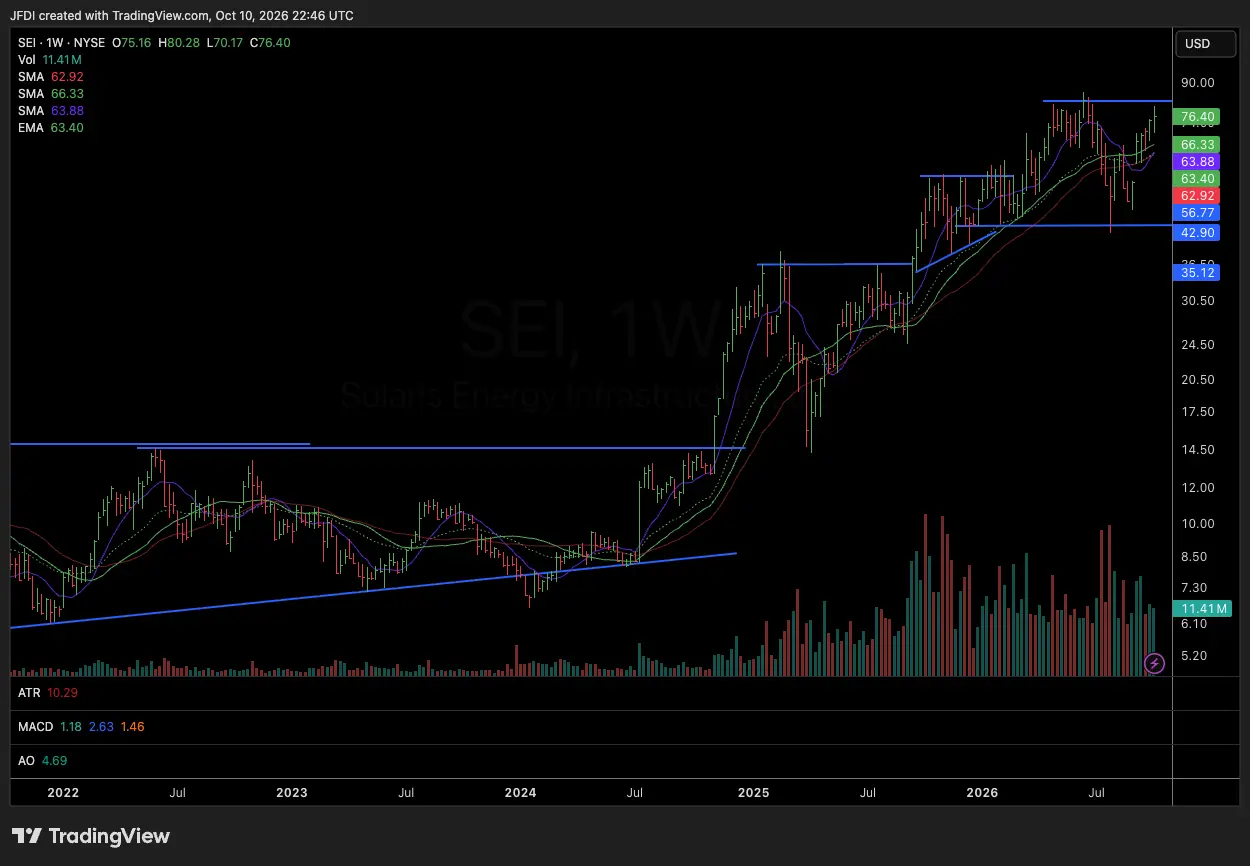
Solaris Energy Infrastructure Inc is a good buy right now due to its strong financial growth and positive market sentiment. The current price is $76.40, and the stock has shown a year-to-date change of +52.01%, indicating robust performance. Additionally, the RSI is at 60.95, suggesting the stock is in a healthy momentum phase. The main risk is the high forward P/E ratio of 384.62, which indicates that the stock may be overvalued if growth does not meet expectations.
Szenariopreise sind das letzte monatliche Prognoseband des laufenden Jahres. Die Wahrscheinlichkeiten sind feste Modellgewichte (25 / 50 / 25), keine Garantien.

Solaris Energy Infrastructure's AI Buildout Unimpeded by Rising Interest Rates

Solaris Energy Infrastructure Prices $1.25 Billion Senior Notes Offering

Middle East Tensions Drive Oil Prices Higher

Solaris and Grace Executives Increase Stock Holdings

Solaris Energy Infrastructure Board Member Increases Shareholding
Solaris Energy Infrastructure, Inc. delivers comprehensive power infrastructure solutions including generation, distribution, installation and commissioning, aftermarket support, and operations and maintenance. Its segments include Solaris Power Solutions and Solaris Logistics Solutions. Solaris Power Solutions segment delivers power generation, power control, and power distribution solutions. The segment’s offerings support data center, energy, and other commercial and industrial sector customers by providing flexible, on-demand power infrastructure, including power control and distribution capabilities. Solaris Logistics Solutions segment designs and manufactures specialized equipment that enables the efficient management of raw materials used in the completion of oil and natural gas wells. The Company also offers specialized engineering, procurement and construction capabilities in heavy civil construction across multiple end markets, including large-scale data centers. It operates in the Energy sector.
Solaris Energy Infrastructure Inc is a good buy right now due to its strong financial growth and positive market sentiment. The current price is $76.40, and the stock has shown a year-to-date change of +52.01%, indicating robust performance. Additionally, the RSI is at 60.95, suggesting the stock is in a healthy momentum phase. The main risk is the high forward P/E ratio of 384.62, which indicates that the stock may be overvalued if growth does not meet expectations.

Sei said that three SEI ETFs from REX-Osprey, Canary Capital, and 21Shares are registering with the SEC, with two planning to offer staking exposure. @SeiNetwork
Mehr anzeigen

$SEI SEI/USDT 4H - Primary Scenario: Entering the Fifth Wave of Elliott Wave The current 4H structure may represent a completed corrective fourth wave and the start of an upward fifth impulse wave, with a potential target of 0.078–0.086 USDT. Reaching a zone alone does not constitute an entry signal. Primary scenario: The correction may complete near 0.060–0.063 USDT. Potential long zones are 0.060–0.063 after a confirmed reversal, or 0.071–0.074 after a resistance breakout and successful retest. Place stops below the confirmed local swing low or retest level. The preferred approach is to wait for confirmation rather than relying solely on the Elliott Wave count. Alternative scenario: If support above local resistance fails, the correction may extend. The 0.078–0.086 zone may offer take-profit opportunities for longs, or short opportunities after a confirmed reversal signal. A break below 0.063 may lead to further downside toward 0.060–0.058; below 0.052, the likelihood of a deeper move to 0.046–0.038 increases. Confirmation signals may include a 4H or 1H reversal structure, rising volume, RSI and MACD momentum, a successful retest, and the absence of clear bearish divergence for longs. Shorts should be taken after a confirmed bearish reaction supported by structure, volume, and a retest. Reassess the bullish scenario after a confirmed close below 0.052 USDT, loss of 0.048 USDT, persistent lower lows without a credible reversal, or a violation of Elliott Wave rules including the fourth wave entering the first wave's price territory. Use predefined invalidation levels and size positions based on stop distance and maximum portfolio risk; given the volatility of crypto perpetual futures, using roughly 0.5–1% of capital per trade may be appropriate. The 0.078–0.086 USDT zone is a potential target, not a guarantee.
Mehr anzeigen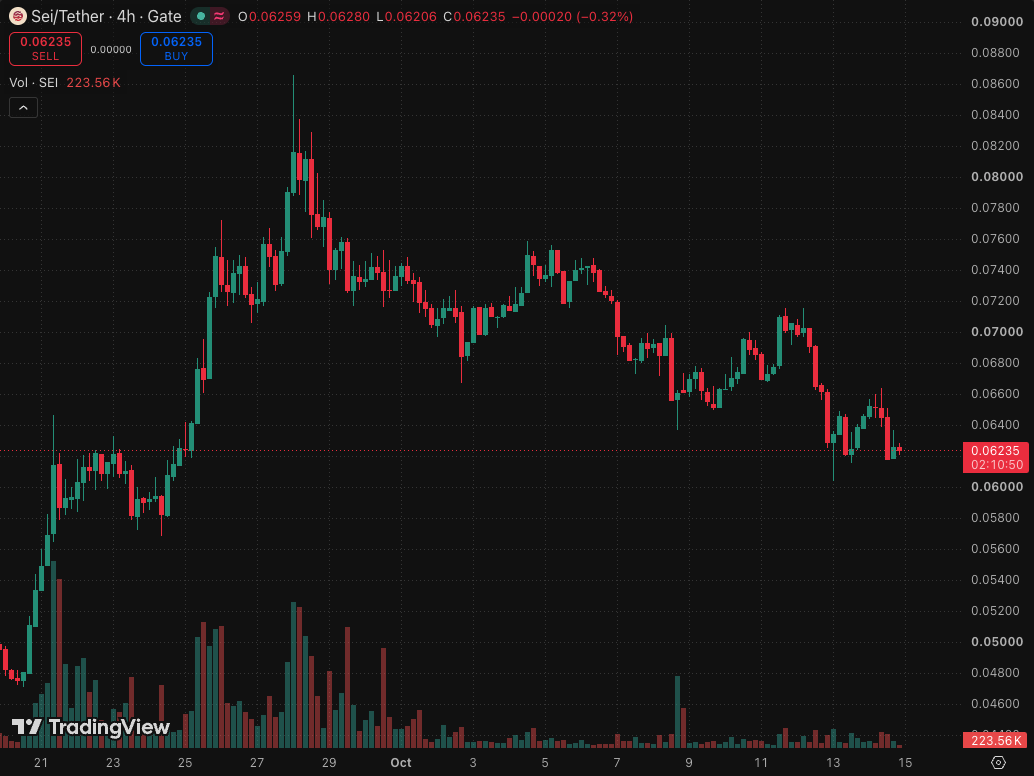
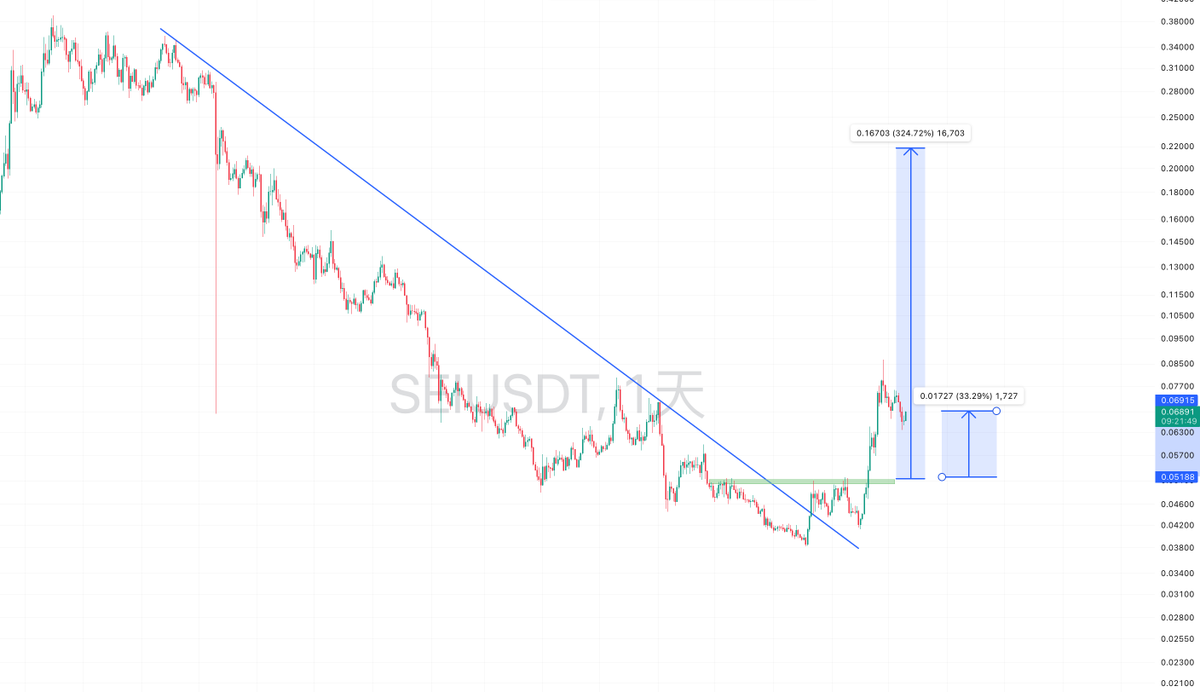
🚀 Bull Market Update – Altcoin Targets RAY: $5 → $10 INJ: $20 → $40 APT: $10 → $20 OP: $2 → $4 TIA: $5 → $10 SEI: $0.50 → $1 JUP: $1 → $2 PYTH: $0.50 → $1 FIL: $5 → $10 STX: $2 → $4 SAND: $0.50 → $1 RENDER: $5 → $10 IMX: $2 → $4 MINA: $0.50 → $1 ZRO: $3 → $6 🔥 A strong market recovery could bring renewed attention to altcoins. Watch for volume confirmation and sustained breakouts before making trading decisions.
Mehr anzeigen

Diese Seite dient nur der Recherche und ist keine Anlageberatung. Modelle können falsch liegen. Vergangene Wertentwicklung ist kein Indikator für die Zukunft.