

PCE Inflation Report and the Stock Market: What the Fed's Preferred Gauge Means in a Correction
The PCE inflation report lands Nov 25 amid a stock correction and Fed hike talk. Learn PCE vs CPI, what to watch, and how stocks, sectors and bonds react.

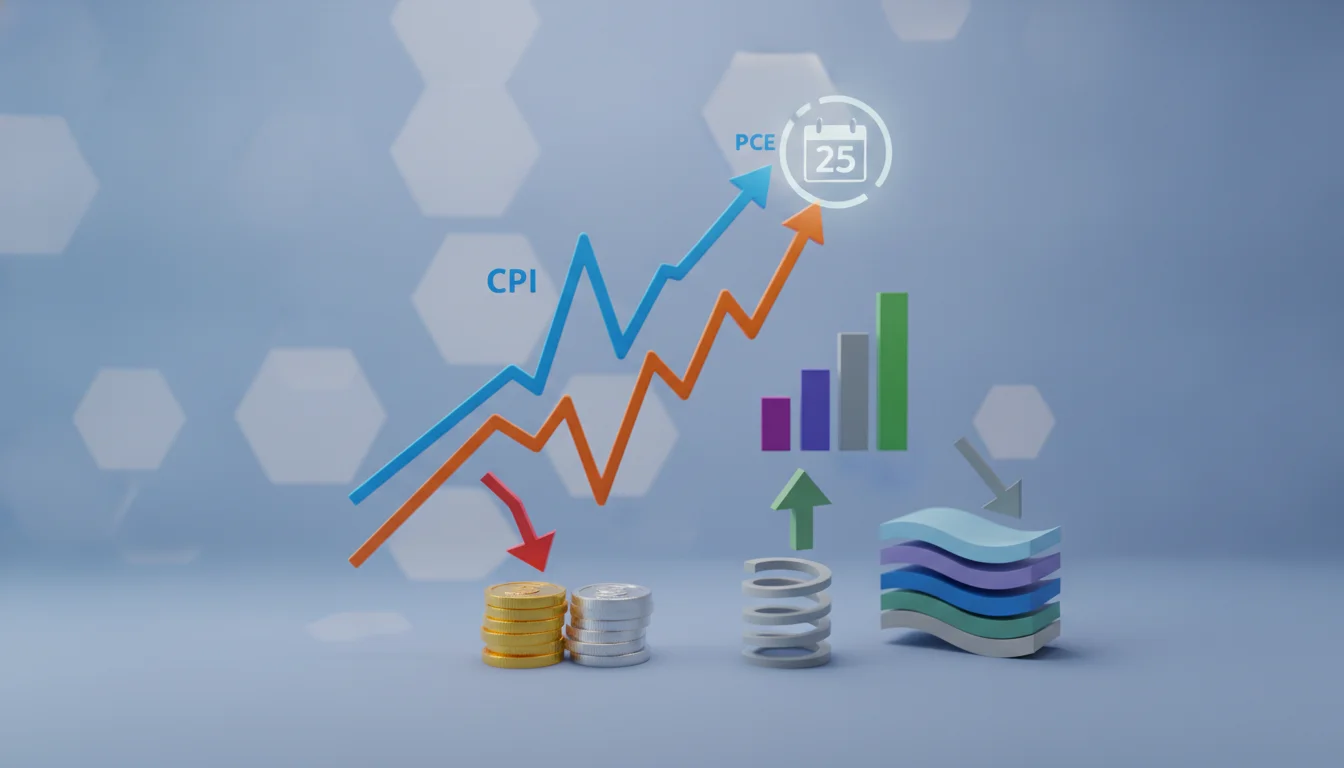
Key Takeaway
The PCE inflation report due on Wednesday, November 25, 2026, at 8:30 a.m. Eastern lands at an awkward moment for the stock market. The S&P 500 closed at 6,910.39 on Friday, November 20, after a 3.7% one-day drop, an 8.6% weekly loss, and a slide that left the index more than 10% below its October 6 record, according to AP market data. The Nasdaq Composite fell 5.3% that day and turned negative for 2026. Into that fragile tape, the Bureau of Economic Analysis will publish October's personal consumption expenditures price index, the inflation measure the Federal Reserve actually targets, together with the second estimate of third-quarter GDP.
The stakes are clear. The Fed raised its target range to 3.75%–4.00% on September 16, held on October 28 with two dissenters who wanted another hike, and meets again on December 8–9 with new economic projections. CME FedWatch priced roughly a 92% chance of a December rate hike as of Friday's close, according to CNBC. September PCE ran 3.6% year over year, with core PCE at 3.1%, per BEA, and published bank forecasts for October core PCE cluster near 0.3% month over month. A print in line with that would largely confirm what markets already expect; a hot or soft surprise could swing December pricing, Treasury yields, and the most rate-sensitive parts of the market.
This guide explains what PCE measures, why it differs from CPI, which numbers inside the report matter most, and how stocks, sectors, and bonds tend to react. It also offers a practical framework for handling a data release that arrives during a correction and right before a holiday-shortened trading session. It is educational, not a forecast or a trading recommendation.
Why the November 25 PCE Report Matters More Than Usual
A Fed that is debating how far to hike
Most of the past two decades of PCE coverage has been framed around rate cuts. That framing is outdated in late 2026. The Federal Open Market Committee's September Summary of Economic Projections put the median 2026 PCE inflation projection at 3.7% and core PCE at 3.4% on a fourth-quarter basis, with a median year-end federal funds rate of 4.1%, which implies one more quarter-point increase. The October 28 statement said plainly, "Inflation remains elevated," and Governors Lisa Cook and Beth Hammack dissented in favor of a hike.
That is the backdrop for this report. The question for investors is no longer whether the Fed cuts, but whether December brings a quarter-point move, a larger one, or a pause. CNBC reported that Governor Christopher Waller has said a half-point hike may be needed in December. PCE is the measure the Fed uses to define its 2% goal, so this release feeds directly into that debate.
The year-over-year gap left by the October CPI
The October CPI report, released on November 10, showed headline prices up 0.4% for the month and core up 0.3%, according to the Bureau of Labor Statistics. BLS could not publish a 12-month change for October because it did not collect October 2025 data during that year's funding lapse. That left markets without a clean annual CPI reading for the month.
The PCE report may partly fill that gap. RBC Economics, in its week-ahead note, expects both headline and core PCE to rise 0.3% in October, which it estimates would lift the annual rates to 3.8% and 3.3%. Those are forecasts, not data, and investors should check exactly what BEA publishes, but an annual PCE figure would give the Fed and the market a more complete picture before December.
A crowded morning and a thin holiday tape
The PCE release does not arrive alone. BEA's schedule shows the second estimate of third-quarter GDP and corporate profits at the same 8:30 a.m. slot. U.S. stock markets are closed on Thursday, November 26, for Thanksgiving, and the Friday session is scheduled to end early. Thin liquidity around holidays can exaggerate moves, which matters when the S&P 500 has just posted seven straight losses.
What the PCE Price Index Actually Measures
PCE versus CPI: scope, weights, and formula
The CPI measures out-of-pocket prices paid by urban consumers for a fixed basket of goods and services. The PCE price index, produced by BEA as part of the national accounts, covers a broader universe. It includes spending made on behalf of households, such as employer-provided health insurance and Medicare and Medicaid outlays, which CPI largely excludes. That broader scope changes the weights. Shelter carries roughly a third of the CPI basket but a much smaller share of PCE, while health care carries far more weight in PCE.
The formula differs too. PCE uses a chain-type index whose weights update as consumers shift their spending, so it captures substitution when people switch away from items that have become more expensive. CPI's weights change far less often. Over long periods, these differences have tended to make PCE inflation run somewhat below CPI inflation, though the gap varies from month to month and has not been constant in 2026.
Why the Fed targets PCE
The Fed formally defined its 2% inflation goal in terms of the PCE price index in 2012, and policymakers have generally cited core PCE as the best guide to the underlying trend. The broader coverage, the substitution effects, and the fact that past PCE data can be revised as source data improve all make it a better fit for policy, even if it lacks CPI's headline appeal for retail investors.
Chair Kevin Warsh has signaled interest in changing how the Fed reads inflation. At his confirmation hearing in April, he said PCE "offers only a rough take on inflation," according to Yahoo Finance, and voiced support for trimmed averages. In July the Fed named leaders for an inflation-frameworks task force. As of this writing, the Fed has not announced any change to PCE as its target measure, so PCE remains the number that matters for December.
Core, supercore, and trimmed-mean measures
Headline PCE includes food and energy, which can swing sharply. In 2026, energy has been a major driver, with BLS reporting gasoline prices up 37.4% from a year earlier on an unadjusted basis in the October CPI. Core PCE strips out food and energy to show the more persistent trend. Many analysts also watch core services excluding housing, often called supercore, because it tracks labor-intensive prices that respond to wage growth. Alternative gauges such as the Dallas Fed's trimmed-mean PCE drop the most extreme price changes each month and can help tell broad inflation apart from a few volatile categories.
How to Read the PCE Report Line by Line
Month-over-month core is the headline that moves markets
Annual rates get the headlines, but they move slowly because they cover 12 months of data. Traders focus on the monthly change in core PCE, usually reported to one decimal place, and many desks look at the unrounded figure to two decimals. Published estimates from several bank economists, including Goldman Sachs and Morgan Stanley, clustered around 0.3% for October after November's CPI and PPI data. That is roughly a 3.5% to 4% annualized pace, well above the Fed's 2% goal, so even an in-line number would not signal relief.
Because CPI and PPI components feed into PCE, the forecast range for core PCE is usually narrow by the time the report arrives. That is why a surprise of even 0.1 percentage point can matter. The market is not reacting to inflation being high, which it already knows, but to whether the new data shift the odds for December and for 2027.
Revisions can matter as much as the new month
BEA revises prior months in every report, and its annual update on September 30 revised data back to 2021. A soft October number paired with an upward revision to September can leave the overall picture unchanged, while an in-line October combined with downward revisions can read as dovish. Reading the revision table, not just the headline, helps investors avoid reacting to a number that tells only part of the story.
Income, spending, and the saving rate
The same release reports personal income, consumer spending, and the personal saving rate. Strong real spending alongside sticky inflation would support the case that demand is still running hot and that the Fed has more work to do. Weak spending and a rising saving rate would suggest that higher rates and energy costs are biting consumers, which matters for retailers heading into Black Friday. These details often explain why markets react differently to two reports with similar inflation numbers.
How the Stock Market Reacts to PCE Surprises
Surprises relative to expectations drive the first move
Stocks do not react to the level of inflation as much as to the gap between the print and expectations. A core reading above forecasts tends to lift short-term Treasury yields as traders price more hikes, and that usually pressures equity valuations. A softer reading can produce relief, especially when positioning is defensive after a sharp sell-off. In-line numbers often fade quickly as attention shifts to the next catalyst.
PCE surprises have historically produced smaller moves than CPI surprises, largely because CPI arrives first and gives forecasters most of the information they need. In a market already down more than 10% from its high, with December hike odds near 92%, the reaction function may be asymmetric. A hot number could reinforce fears of a larger hike, while a soft one could challenge the case for one.
Why the reaction can reverse after the open
The first reaction at 8:30 a.m. happens in futures, Treasuries, and currencies, often before investors digest revisions, spending data, and the GDP release. It is common for the initial move to reverse by midday as traders work through the details. On November 25, with markets closed the next day and an early close on Friday, positioning ahead of the holiday may add to the noise.
Inflation data in a correction
During corrections, macro data can carry extra weight because investors are looking for a reason to buy or sell. The current sell-off has been concentrated in AI and semiconductor stocks, with the Nasdaq falling 10% in the week to November 20. Long-duration growth stocks, whose value depends heavily on profits far in the future, tend to be the most sensitive to changes in rate expectations. That makes the PCE report especially relevant for the most crowded part of the market.
Which Sectors Are Most Sensitive to the PCE Print
Long-duration growth and AI stocks
The mechanics are simple. Higher expected policy rates lift discount rates, which reduce the present value of distant cash flows. Companies valued on large future earnings, including many AI leaders, feel this more than firms with steady current profits. That does not mean every hot inflation print hurts every tech stock, but it does mean valuation multiples matter when rate expectations change. A disciplined way to approach that is to compare a company's valuation against its own history and peers rather than reacting to the day's headline.
Banks, insurers, and financials
Financials have a more mixed relationship with inflation data. Higher short-term rates can support net interest margins for banks with large deposit bases, but rapid hikes can also raise funding costs, slow loan demand, and increase credit stress. Insurers can benefit from higher yields on their investment portfolios. For investors, the key is the shape of the yield curve: a steeper curve tends to help lenders, while a flatter or inverted curve can squeeze margins.
Consumer stocks and the holiday calendar
The PCE report's spending data arrive two days before Black Friday. Real spending growth, the saving rate, and income figures can shape the narrative for retailers and consumer discretionary stocks just as the holiday season begins. Consumer staples companies have historically held up better in high-inflation periods because of steadier demand, though elevated input costs can squeeze their margins too.
PCE, Treasury Yields, and Stock Valuations
The two-year yield is the market's December gauge
The two-year Treasury yield, around 4.63% to 4.65% on November 20 according to CNBC data, is one of the most direct market reads on near-term Fed policy. If core PCE comes in hot, the two-year yield would likely rise as traders price a larger or longer hiking cycle. If it comes in soft, the two-year could fall. For stock investors, watching the two-year in the first minutes after 8:30 a.m. is often more informative than watching index futures.
Longer yields, real yields, and the equity risk premium
The 10-year Treasury yield ended around 4.93% on November 20, down roughly 10 basis points as investors sought safety, according to CNBC. Long yields reflect growth expectations, inflation expectations, and the term premium investors demand for holding long bonds. When real yields rise, the extra return stocks offer over bonds, the equity risk premium, shrinks unless prices fall or earnings rise. That is a key reason why inflation data matter for valuations even when earnings forecasts are unchanged.
When bonds stop hedging stocks
In low-inflation periods, high-quality bonds often rise when stocks fall. In high-inflation periods, both can fall together because inflation risk hits both. On November 20, Treasuries rallied as stocks slumped, a sign that growth fears were outweighing inflation fears that day. A hot PCE print could test that relationship again, which matters for anyone relying on bonds to cushion an equity drawdown.
A Practical PCE-Day Playbook for Investors
Before the release
Preparation beats reaction. Investors can note the consensus range for core PCE, the current December odds on CME FedWatch, and the level of the two-year yield before the release. It also helps to decide in advance what would change their plans and what would not. For most long-term investors, the honest answer is that a single month of PCE data should not drive a major allocation change.
A short pre-release checklist can keep the process objective:
- Note the consensus for core PCE month over month and year over year.
- Record the December hike probability and the two-year Treasury yield.
- Identify which holdings are most rate-sensitive, such as long-duration growth stocks, REITs, and long bonds.
- Set position limits and stop-loss rules before the open, not during it.
Investors who want this routine to run automatically can use Alphio's Scheduled Task feature to schedule recurring checks of rates, market moves, and portfolio exposure around key data releases.

In the first hour
The first move is often driven by algorithms reacting to the headline, before the revisions and GDP details are digested. Waiting for the cash market to open and for the first 30 to 60 minutes to settle can help investors avoid chasing noise. Watching the two-year yield and the dollar alongside equity futures gives a fuller picture of how the market is interpreting the data.
After the dust settles
Once the report is absorbed, the bigger question returns: what does it mean for December 8–9 and the path into 2027? The next CPI report, scheduled for December 10, comes the day after the FOMC decision, so PCE is the last major inflation read before the Fed acts. Investors can use the report to test their assumptions rather than to react to the headline. Alphio's Conversational Trading can help talk through how a hot or soft print might affect a specific portfolio before placing any trade.

Conclusion
The November 25 PCE report is not just another data point. It is the Fed's preferred inflation measure, released during a stock market correction, alongside the GDP revision, and right before the final policy meeting of 2026. With September PCE at 3.6% and core at 3.1%, forecasts for October near 0.3% per month, and markets pricing a high chance of a December hike, the details of the report matter more than usual.
Investors do not need to predict the number to handle it well. Know the consensus, watch the two-year yield, read the revisions and spending data, and separate the first market reaction from the lasting one. A single month of inflation data rarely justifies a major portfolio overhaul, but it can be a useful prompt to review risk, rate sensitivity, and position sizing.
For a repeatable process, Alphio's Scheduled Task can automate recurring market and portfolio checks around data releases, and Conversational Trading can help you think through scenarios before you trade. Investors who prefer rules-based execution within limits they define can explore Autonomous Trading. None of these tools removes market risk, but they can make a disciplined plan easier to follow.
FAQs
When is the next PCE inflation report released?
BEA's schedule lists the Personal Income and Outlays report for October 2026, which includes the PCE price index, for Wednesday, November 25, 2026, at 8:30 a.m. Eastern. The second estimate of third-quarter GDP is scheduled for the same time.
What is the difference between PCE and CPI?
CPI tracks out-of-pocket prices paid by urban consumers, while PCE covers a broader range of spending, including spending made on behalf of households such as employer-provided health insurance. PCE also uses a chain-type formula that captures substitution, and it gives shelter a smaller weight than CPI, so the two often differ.
Why does the Federal Reserve prefer PCE inflation?
The Fed defined its 2% inflation goal in terms of the PCE price index in 2012, and policymakers generally view core PCE as the best guide to the underlying trend. Its broader coverage and substitution effects make it more useful for policy, even though CPI gets more attention from investors.
How does the PCE report affect the stock market?
Markets react mainly to the gap between the report and expectations. A hotter-than-expected core PCE reading tends to push Treasury yields higher and pressure stock valuations, especially long-duration growth stocks, while a softer reading can bring relief. Initial moves often reverse as investors digest revisions and spending data.
What were the latest PCE inflation numbers?
BEA reported that the PCE price index rose 3.6% year over year in September 2026, with core PCE up 3.1%. October figures are due on November 25, and published forecasts from several bank economists clustered around a 0.3% monthly increase in core PCE.
Related articles
- Stop-Loss Orders in a Volatile Market: How to Set Stops Without Getting Whipsawed in 2026How stop-loss, stop-limit and trailing stop orders really work when the VIX is near 36, plus how to set stops, avoid gaps and whipsaws, and size positions.
- How to Buy the Dip in the 2026 Stock Market Correction Without Guessing the BottomHow to buy the dip in the November 2026 stock market correction: what history says, why a hiking Fed changes the math, and how to stage purchases safely.
- Required Minimum Distributions in a Down Market: How to Take Your 2026 RMD Without Selling LowHow to take required minimum distributions in a down market in 2026: what to sell, in-kind RMDs, QCDs, the Dec. 31 deadline, penalties, and tax moves to use.
- When to Stop Following a Crypto Vault or WhaleA practical unfollow checklist for crypto vaults and whales: drawdown limits, style drift, manipulation red flags, and review cadences.
- How to Size Stops and Max Drawdown When Copy TradingLearn how to size stops and max drawdown for crypto copy trading: per-trade risk, per-lead budgets, portfolio circuit breakers, and cooling-off rules.
- How to Set a Budget Cap for AI Trading Agents and Copy TradeLearn how to set hard budget caps for AI trading agents and copy trading: per-trade, daily, portfolio, and drawdown circuit breakers.