

Dollar-Cost Averaging vs Lump Sum: How to Invest Cash in a Volatile, High-Yield 2026 Market
Dollar cost averaging vs lump sum in a volatile 2026 market: what Vanguard's research shows, how 4%+ T-bill yields change the math, and how to build a plan.

Key Takeaway
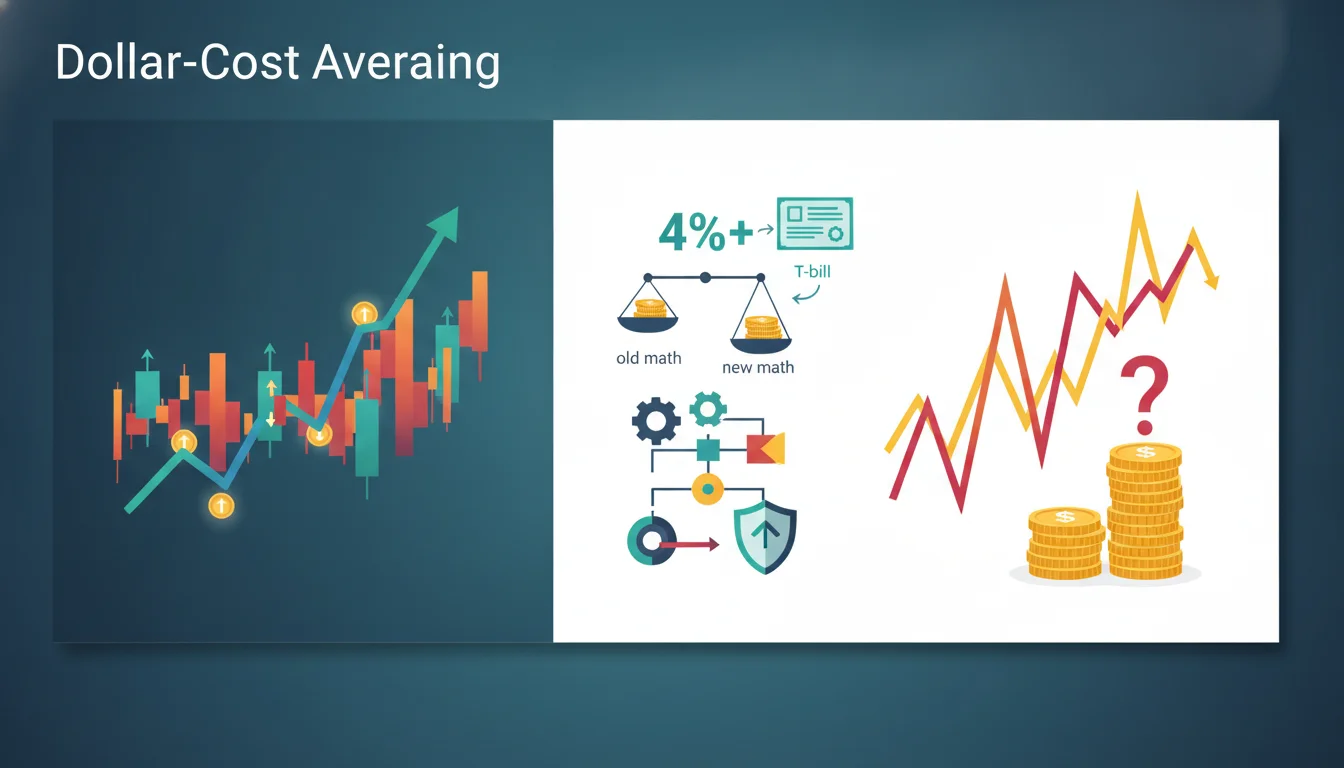
Few questions come up more often in a shaky market than this one: if you have a pile of cash to invest, should you put it all in today or feed it in over several months? The research answer is clearer than many investors expect. Vanguard's February 2023 study by Megan Finlay and Josef Zorn, which tested rolling one-year periods from 1976 to 2022 across the US, UK, Canada, Europe, Australia, emerging markets and global stocks, found that investing a lump sum immediately beat a cost-averaging plan between 61.6% and 73.7% of the time, depending on the market. For an all-equity portfolio, the median lump-sum result ended 2.2% ahead of spreading the money over three months.
Yet the decision feels different in November 2026. The S&P 500 fell 4.4% on November 5, its worst day since the April 2025 tariff shock, and closed at 7,561.67 on November 13, according to the Associated Press. The Federal Reserve raised rates in September, held its target range at 3.75% to 4.00% on October 28 with two officials voting for another hike, and meets again on December 8–9. Meanwhile, cash finally pays: the 3-month Treasury bill yielded 4.32% and the 6-month bill 4.42% on November 12, according to the Fed's H.15 release. That combination changes the cost of waiting, even if it does not overturn the long-run evidence.
This guide explains what the lump sum vs dollar-cost averaging research really shows, why higher cash yields shrink (but do not erase) the penalty for averaging in, when a staged entry is the rational choice, and how to build a rules-based plan that you will actually follow. Market data are as of November 12–13, 2026 (America/New_York). Historical results do not guarantee future returns, and nothing here is personalized investment advice.
What Dollar-Cost Averaging and Lump Sum Investing Really Mean
Two different situations that share one name
The phrase "dollar-cost averaging" gets used for two very different behaviors, and confusing them leads to bad conclusions. The first is the steady investing most people already do: a slice of every paycheck goes into a 401(k) or brokerage account on a fixed schedule. That is not really a choice between lump sum and averaging, because the money does not exist yet. You invest it as soon as you earn it, which is the closest thing to lump-sum investing available to a salaried worker.
The second situation is the one the research addresses. You already hold a meaningful sum, perhaps from a bonus, an inheritance, the sale of a business or a home, or a matured CD, and you must decide whether to deploy it at once or deliberately hold part of it in cash and invest it in installments. Vanguard's study is explicit that its findings apply to this lump-sum decision, not to regular monthly investing from income. Keeping that distinction in mind removes much of the confusion in online debates.
How the mechanics work
With lump-sum investing, the entire amount goes into your target portfolio on day one. With a cost-averaging plan, you divide the money into equal parts and invest one part at fixed intervals, for example one-twelfth each month for a year, while the uninvested balance waits in cash or short-term bonds. Because each installment buys more shares when prices are low and fewer when prices are high, your average cost per share can end up below the average market price over that window.
That arithmetic is real, but it is often oversold. Buying more shares at lower prices only helps relative to a lump sum if prices actually fall after you start. If prices rise steadily, every later installment buys at a higher price than the lump sum paid on day one. The averaging effect is a hedge against regret, not a free source of return.
What the Research Says About Lump Sum vs DCA
The Vanguard evidence across seven markets
The 2023 Vanguard paper, titled "Cost averaging: Invest now or temporarily hold your cash?", compared investing everything immediately with spreading a lump sum over time, using rolling one-year windows. The test covered the Russell 3000 in the US from 1979, the FTSE All-Share in the UK, the S&P/TSX Composite in Canada, MSCI Europe, the S&P/ASX 300 in Australia, MSCI Emerging Markets and the MSCI World index going back to 1976. In every market, lump sum came out ahead in most periods, with a hit rate between 61.6% and 73.7%.
The size of the advantage depended on how much risk the portfolio carried. Vanguard's summary puts the median lump-sum edge over a three-month averaging plan at 2.2% for a 100% equity portfolio, 1.8% for a 60/40 stock-bond mix and 1.2% for a 40/60 mix. The logic is simple. Over most rolling periods stocks rise, so money that sits in cash misses part of the equity risk premium. Vanguard describes the months spent partly in cash as "lost risk premium," and the longer you take to invest, the larger that drag tends to become.
Where averaging wins: the worst-case tail
The same research shows exactly when averaging helps. In the very worst outcomes, the 5th percentile of the distribution, cost averaging beat lump sum by 3.6% for an all-equity portfolio, 1.4% for a 60/40 mix and 0.6% for a 40/60 mix. In other words, averaging trades a lower expected result for a better result in the scenarios that hurt the most. That is an insurance trade, and like most insurance, it costs something in the typical case.
Separate work from Charles Schwab reaches a related conclusion from a different angle. Its widely cited "Does Market Timing Work?" analysis follows hypothetical investors who each receive $2,000 a year over rolling 20-year periods and invest it in different ways. Perfect timing, buying at the lowest close every year, finished first, but investing immediately was a close second, and the investor who stayed in cash waiting for a better entry fared worst. The lesson is not that timing never pays, but that the cost of waiting usually exceeds the benefit of even perfect timing, which nobody can achieve in practice.
Why 2026's High Cash Yields Change the Math
Cash is no longer a zero-return parking spot
Much of the historical penalty for averaging comes from the gap between what stocks return and what idle cash earns. During the long stretch of near-zero short-term rates from 2009 to 2015 and again in 2020–2021, money waiting to be invested earned almost nothing, so every month of delay was costly. Today the picture is different. According to the Federal Reserve's H.15 data for November 12, 2026, the effective federal funds rate was 3.88%, the 3-month Treasury bill yielded 4.32% and the 6-month bill 4.42%.
That means the uninvested portion of a staged plan earns a meaningful return while it waits. As a simple illustration, not a forecast: if you spread $120,000 evenly over 12 months, your average cash balance during that year is roughly half the total, or about $60,000. At an annualized yield near 4.3%, that idle balance would earn on the order of $2,500 over the year before taxes. That cushion offsets part of the expected advantage of investing at once, especially for conservative portfolios where the stock-versus-cash gap is narrower.
But the hurdle for stocks also moved
Higher yields cut both ways. When cash and Treasuries pay more, investors demand more from stocks, which helps explain why valuations came under pressure this autumn. The 10-year Treasury yield stood at 5.10% on November 12, up from 4.98% two days earlier, according to the same H.15 release, and the 2-year yield was 4.86%. Rising long-term yields were one of several forces behind the sharp November sell-off in technology shares.
The practical takeaway is that high cash yields make a short, disciplined averaging plan cheaper than it was in the zero-rate era, but they do not turn averaging into the higher-expected-return strategy. Stocks still need only to beat roughly 4% to 4.5% over your averaging window for the lump sum to come out ahead, and over most historical one-year periods they have. The higher yield on waiting money narrows the gap; it does not reverse the odds.
Fed policy keeps short rates elevated for now
The Fed's own path matters here, because the yield on your waiting cash depends on it. The October 28 statement kept the target range at 3-3/4 to 4 percent by a 10–2 vote, with Governor Lisa Cook and Cleveland Fed President Beth Hammack preferring a quarter-point hike. With the next meeting on December 8–9 and futures markets pricing a substantial chance of another increase, short-term yields look unlikely to collapse in the near term. Those projections can change quickly, however, so treat the yield on cash as a helpful tailwind rather than something you can count on for years.
The Behavioral Case for a Staged Entry
The biggest risk is abandoning the plan
If lump sum wins most of the time on paper, why does any advisor recommend averaging? Because the best strategy on a spreadsheet is worthless if the investor abandons it. Imagine investing a large windfall the week before a 4.4% one-day drop like November 5, followed by further losses. Many people in that situation sell near the bottom, locking in exactly the outcome they feared. Vanguard's own discussion notes that loss-averse investors may reasonably prefer cost averaging for this reason.
A staged entry reduces the emotional stakes of any single day. If the market drops after your first installment, you have cash left to invest at lower prices, which makes the decline feel like an opportunity rather than a disaster. That reframing can be worth more than the median 1% to 2% expected cost, particularly for first-time investors or anyone handling a sum that is large relative to their net worth.
Regret works in both directions
There is a mirror-image risk that receives less attention: averaging in during a strong rally can produce its own regret, and that regret often leads to abandoning the schedule and dumping the rest of the cash in at a peak. The cure for both forms of regret is the same. Write the schedule down before you start, decide in advance that you will not accelerate or pause it based on headlines, and automate it if you can.
This is where tools can help. Investors who want their installments to execute on a fixed calendar, rather than relying on willpower during a volatile week, can set up recurring rules with Alphio's Scheduled Task feature after defining the amount, interval and target allocation on paper.

When Dollar-Cost Averaging Makes Sense in a Volatile Market
Size of the sum relative to your wealth
The larger the lump sum is compared with your existing portfolio, the more a bad entry point can hurt, both financially and emotionally. Someone adding $10,000 to a $500,000 portfolio is barely changing their risk exposure, and there is little reason to average in. Someone moving a $300,000 home-sale proceeds check into stocks for the first time is effectively making one giant market call. For that second investor, spreading the entry over three to twelve months is a reasonable way to diversify across time.
Valuation and concentration risk
Starting valuations do not reliably predict one-year returns, but they do shape the range of outcomes. When a market is led by a handful of very large companies that trade at premium multiples, a sudden reset in that leadership can drag the whole index lower, as investors saw during November's AI-related sell-off in the Nasdaq. A staged entry does not fix concentration, but it lowers the chance that all your capital is committed at a local peak in sentiment.
If part of your plan involves individual stocks rather than a broad index fund, each purchase deserves its own valuation check instead of an automatic schedule. Looking at how a company's multiple compares with its own history and its peers helps you judge whether the next installment is buying quality at a reasonable price or simply chasing momentum.
Known event risk on the calendar
Some weeks carry more scheduled uncertainty than others. In the coming days investors face Nvidia's quarterly results on November 17, the release of the October FOMC minutes the following day and, in early December, the Fed's final 2026 decision. Options markets are pricing a sizable move in Nvidia shares around its report, according to previews published November 13. Event risk is not a reason to stay out of the market indefinitely, but it can justify splitting a lump sum so that a single binary event does not determine your entire entry price.
How to Build a Rules-Based Investing Plan
Pick the window and the cadence in advance
The research gives useful guardrails for designing a plan. Because the drag from holding cash grows with time, shorter averaging windows usually cost less. Many planners suggest three to twelve months, with weekly, biweekly or monthly installments. Within that range, the right choice depends on how large the sum is and how much a sharp early drop would bother you. Write the choice down before the first purchase.
A simple framework that many investors use covers the main decisions:
- Decide the total amount and the target allocation (for example, 70% stocks and 30% bonds) before investing a dollar.
- Choose the window and cadence, such as six equal monthly installments.
- Park the uninvested balance in Treasury bills, a government money market fund or another short-term, high-quality option.
- Set a rule for what happens if markets fall sharply, such as investing the next installment early, and commit to it in writing.
- Rebalance once the plan is complete rather than tinkering midway.
Consider a hybrid approach
Investing does not have to be all or nothing. A common compromise is to invest half or two-thirds of the sum immediately and spread the remainder over a few months. That keeps most of your money working from day one while still leaving dry powder if the market corrects. For many people navigating a volatile fourth quarter, a hybrid split is easier to stick with than either extreme.
Use questions, not hunches, to adjust
Markets will tempt you to deviate. Before changing the plan, ask specific questions: Has my time horizon changed? Has my need for the money changed? Is my allocation still right for my goals? Investors who want a quick sounding board for these questions, such as checking how an index has behaved after past drawdowns or how a position fits their allocation, can use Alphio's Conversational Trading interface as a research companion, not as a substitute for their written plan.
Common Mistakes With Lump Sum and DCA
Turning averaging into market timing
The most common failure is a plan that quietly becomes a timing strategy. An investor starts averaging, sees the market rise, decides to wait for a pullback, and ends up holding cash for a year or longer. At that point the strategy is no longer dollar-cost averaging; it is waiting for a better entry, which the Schwab analysis suggests is usually the most expensive choice. If you notice yourself skipping installments because of headlines, that is a sign the schedule needs automation.
Ignoring taxes, fees and where the cash sits
Costs matter more than most people think. Frequent small purchases can rack up commissions or spreads on some platforms, and moving money between accounts can trigger taxable events. Interest earned on cash in a taxable account is taxed as ordinary income, which reduces the after-tax cushion discussed earlier. Choosing tax-advantaged accounts first and keeping the waiting cash in a low-cost, high-quality vehicle helps more than fine-tuning the interval.
Forgetting the rest of the portfolio
Finally, a lump-sum decision should never be made in isolation. Before deploying a windfall, make sure your emergency fund is in place, high-interest debt is paid down and your overall allocation fits your goals and timeline. Money you may need within two or three years generally does not belong in stocks at all, whether you invest it gradually or at once. Getting those basics right matters far more than the choice between lump sum and averaging.
Conclusion
The debate between dollar-cost averaging and lump sum investing has a clearer answer than its reputation suggests. Over decades of data and across seven markets, investing a lump sum right away has beaten a staged entry roughly two-thirds of the time, by a median of about 1% to 2% depending on the mix of stocks and bonds. Averaging earns its place by limiting the damage in the worst scenarios and by helping nervous investors stay committed, which is a real benefit rather than a weakness.
What is different in late 2026 is the price of patience. With Treasury bills yielding above 4% and the Fed still leaning toward tighter policy, the cash waiting in a short averaging plan earns a meaningful return, which makes a disciplined three- to twelve-month schedule or a hybrid split a reasonable choice for investors facing a volatile tape. The key is to decide the rules before the market tests you and then follow them.
Investors who want that discipline built in can automate recurring purchases with Scheduled Task, explore rules-driven execution with Autonomous Trading, or study how experienced investors manage entries through Copy Trade. Whatever tool you use, write down your amount, window and allocation first, because the plan you follow will always beat the perfect plan you abandon.
FAQs
Is dollar-cost averaging better than investing a lump sum?
Historically, no, not on average. Vanguard's 2023 study of rolling one-year periods from 1976 to 2022 found lump sum investing beat cost averaging between 61.6% and 73.7% of the time across seven markets. Dollar-cost averaging tends to win only when markets fall soon after you start investing.
When does dollar-cost averaging make sense?
It makes sense when the sum is large relative to your wealth, when a sharp early loss would likely cause you to abandon the plan, or when you want to limit worst-case outcomes. In Vanguard's data, averaging beat lump sum in the worst 5% of scenarios, which is why loss-averse investors may prefer it.
How do high Treasury bill yields affect the lump sum vs DCA decision?
Higher yields reduce the cost of waiting because the uninvested cash earns interest. On November 12, 2026, the 3-month Treasury bill yielded 4.32%, according to Federal Reserve H.15 data. That narrows the expected gap, but stocks have historically still outpaced cash over most one-year periods.
How long should a dollar-cost averaging plan last?
Shorter windows usually cost less because the drag from holding cash grows with time. Many planners suggest three to twelve months with weekly, biweekly or monthly installments. The key is to set the schedule in writing before you start and avoid pausing it based on headlines.
Is investing from every paycheck the same as dollar-cost averaging a lump sum?
Not really. Investing from each paycheck means you invest money as soon as you earn it, which is effectively lump-sum investing for a salaried worker. The lump sum vs averaging debate only applies when you already hold a sum of cash and choose whether to deploy it all at once or in stages.
Related articles
- Stock Market Outlook 2027: What Wall Street's S&P 500 Forecasts Really Tell InvestorsStock market outlook 2027: what Goldman, UBS, BofA and bears forecast for the S&P 500, the earnings math behind targets, and how to plan for any scenario.
- REITs and Rising Interest Rates in 2026: Why Real Estate Stocks Are Holding Up and Where the Risks AHow rising interest rates affect REITs in 2026: why REITs are up despite Fed hikes, which sectors hold up, how to value REITs and build a rate-aware allocation.
- International Stocks vs US Stocks in 2026: How the Strong Dollar and Valuations Change the CaseInternational stocks vs US stocks in 2026: how the strong dollar, valuation gaps, Fed hikes and concentration risk shape a smarter global allocation plan now.
- Treasury Yields and the Stock Market: What a Near-5% 10-Year Yield Means for Investors in 2026The 10-year Treasury yield hit 5.31% in October 2026 before easing to 4.88%. Learn how Treasury yields affect stocks, which sectors react and how to plan.
- CPI Report and the Stock Market: How to Read October 2026 Inflation Data Before the Fed DecidesOctober 2026 CPI lands Nov 10 with no year-over-year number and Fed hike odds near 80%. Learn how to read CPI, which stocks react, and how to plan for it.
- Are You Buying NVIDIA’s Earnings or Its CEO’s Perfect Image?An Alphio analysis of NVIDIA’s share-price timeline, operating results, governance uncertainty and upcoming earnings.