

CPI Report and the Stock Market: How to Read October 2026 Inflation Data Before the Fed Decides
October 2026 CPI lands Nov 10 with no year-over-year number and Fed hike odds near 80%. Learn how to read CPI, which stocks react, and how to plan for it.


Key Takeaway
The October 2026 Consumer Price Index report, due from the Bureau of Labor Statistics on Tuesday, November 10, at 8:30 a.m. Eastern Time, may be the most important data release of the quarter for stock investors. Markets enter the week bruised: the S&P 500 fell about 2.7% and the Nasdaq Composite about 3.4% in the week ended November 6, according to FXEmpire figures cited by Gotrade, and futures markets are pricing roughly a 77% to 81% chance that the Federal Reserve raises rates by a quarter point on December 9, according to CME and LSEG data cited by Mitrade on November 9. A Fed that is debating a hike rather than a cut changes how every inflation number should be read.
This CPI report also comes with an unusual twist. Because the BLS did not collect price data from October 1 through November 12, 2025, during the federal government shutdown, the October 2026 release will not include an official year-over-year headline inflation rate. That puts the spotlight squarely on the monthly change. Consensus forecasts compiled by Mitrade and FXEmpire call for headline CPI to rise about 0.3% month over month and core CPI about 0.2%, after hot September readings of 0.6% and 0.3%.
This guide explains how to read a CPI report the way professional traders do, why the stock market reacts to the surprise rather than the level, which sectors tend to be most sensitive, and how to build a calm, rules-based plan for CPI day. Data are as of November 9, 2026, unless noted, and all forecasts and market-implied probabilities are projections that can change quickly.
Why the October 2026 CPI Report Matters More Than Usual
A Fed that is debating hikes, not cuts
The Federal Reserve held its policy rate in a target range of 3.75% to 4.00% at its October 28 meeting, and market previews from Gotrade report that two policymakers voted for a 25 basis point increase. That split matters, because it tells investors the bar for tightening is not especially high. Since then, the labor market has added fuel to the debate. The October jobs report showed nonfarm payrolls rising by 165,000, far above a consensus of roughly 65,000, with the unemployment rate falling to 4.1%, according to Mitrade and Gotrade summaries of the report.
Before payrolls, December hike odds were around 66%, according to Mitrade's tracking of CME data. After the strong jobs number, that figure climbed toward 77% on CME and about 81% on LSEG's measure. In other words, the market has already priced in a good deal of hawkishness. The October CPI report is the last major inflation reading before the December 8–9 Federal Open Market Committee meeting besides producer prices, which makes it the swing factor for whether those odds firm up or fade.
The missing year-over-year number
Most investors are used to seeing a single headline: inflation ran at X% over the past year. This month that figure will not be published. The BLS has explained that it did not collect CPI data between October 1 and November 12, 2025, and that missing data affected the October and November 2025 indexes. Without a reliable October 2025 base, the bureau cannot produce a clean twelve-month comparison for October 2026, so Mitrade notes it will publish month-on-month changes only.
That has two practical consequences. First, headlines and social media summaries may be confusing, with some outlets trying to estimate an annual rate on their own. Second, the monthly prints carry even more weight than usual, because they are the only official signal. The last official twelve-month figure, for September 2026, showed headline CPI up 3.7% and core CPI up 2.6%, according to the BLS.
What the consensus expects
Forecasts are tightly clustered but not identical. Mitrade's compilation shows headline estimates ranging from about 0.19% (Morgan Stanley) to 0.3% (ING), with Bloomberg Economics at 0.25%. The Cleveland Fed's inflation nowcast, cited by Phemex on November 8, pointed to roughly 0.24% for headline and 0.21% for core. The commonly quoted consensus is 0.3% for headline and 0.2% for core.
The gap between the nowcast and the round-number consensus is worth noticing. If the actual print lands at 0.2% on core, it would be roughly in line; a 0.4% core reading would be a clear upside surprise. For a Fed weighing a hike, core is the number that matters most, because energy prices, which drove September's jump, can reverse quickly.
How to Read a CPI Report Like a Market Professional
Headline versus core
The headline CPI measures the average change in prices paid by urban consumers for a broad basket of goods and services. Core CPI strips out food and energy, which are volatile and often driven by weather, geopolitics or supply shocks rather than underlying demand. In September 2026, the difference was stark: energy prices jumped 5.2% in a single month and gasoline rose 9.1%, with the BLS noting that gasoline accounted for over half of the monthly all-items increase. Core inflation, by contrast, rose a steadier 0.3%.
Professional traders usually react to core first. A hot headline driven by gasoline may fade as oil prices fall, and crude has already eased in recent weeks amid reports of U.S.–Iran talks. A hot core reading, especially in services, suggests inflation is spreading into wages, rents and everyday spending, which is far harder for the Fed to ignore.
Month-over-month is the real signal
Annual inflation rates move slowly because they reflect the cumulative change over twelve months. The monthly change is where new information shows up. A useful rule of thumb is to annualize the monthly core reading: a 0.2% monthly pace works out to roughly 2.4% a year, close to the Fed's comfort zone, while 0.3% annualizes to about 3.7% and 0.4% to nearly 5%. Small differences in the decimal point therefore translate into big differences in the inflation story.
Markets also watch whether the unrounded figure is near a rounding threshold. A core print of 0.24% rounds down to 0.2% but is materially warmer than 0.16%, which also rounds to 0.2%. Many trading desks look at the unrounded figure within minutes of the release, so the first move in futures can look puzzling to investors who only see the headline number.
Shelter, energy and the components that drive the print
Not all categories carry equal weight. In the BLS relative-importance tables for December 2025, shelter accounted for about 35.6% of the all-items CPI and roughly 45% of core, food about 13.7% and energy about 6.4%. That means a modest change in rent or owners' equivalent rent can move core inflation more than a large swing in a small category. In September 2026, shelter rose 0.4% for the month and 3.2% over the year.
Energy is the opposite: a small weight, but enormous volatility. Energy prices were up 20.4% over the twelve months to September and gasoline was up 34.2%, according to the BLS. When you read the October report, start with core, then check shelter and core services, then look at energy to understand the gap between headline and core. That order helps separate a temporary shock from a persistent trend.
How the Stock Market Reacts to CPI Surprises
It is the surprise, not the level
Stocks do not trade on whether inflation is high or low in an absolute sense; they trade on how the number compares with what was already priced in. With December hike odds near 80%, a reading in line with the 0.2% core consensus might do little to change Fed expectations. A cooler print could push hike odds lower and support rate-sensitive stocks, while a hotter one would make a December hike look close to certain and could raise questions about further tightening in 2027.
This is why the same inflation rate can produce opposite reactions in different years. In a market that expects rate cuts, a slightly hot print can hurt. In a market braced for the worst, a merely warm number can spark relief. Before the release, it is worth writing down what the market is pricing so you can judge the reaction against that baseline rather than against the headline alone.
Lessons from September and November 2022
The 2022 inflation cycle offers two clear examples. On September 13, 2022, the August CPI report showed annual inflation of 8.3% versus expectations of 8.1%, with core prices rising 0.6% for the month. The S&P 500 fell 4.3%, the Nasdaq Composite lost 5.2% and the Dow dropped 1,276 points, or 3.9%, the worst day for all three since June 2020, according to contemporaneous reports from Kiplinger and NBC News.
Two months later, on November 10, 2022, the October CPI report showed annual inflation of 7.7% against expectations of 7.9%. The S&P 500 jumped about 5.5% and the Nasdaq Composite about 7.4%, with the Dow up more than 1,200 points, according to AP. The underlying inflation level was still very high on both days. What changed was the direction of the surprise and what it implied for the path of Fed policy.
Why the first move is not always the last
The initial reaction in futures happens within seconds, driven by algorithms reading the headline numbers. Over the next hour, human traders dig into the components, revisions and unrounded data, and the market sometimes reverses. A hot headline that turns out to be all gasoline, for example, may fade by the open. A seemingly benign core print with a sharp rise in services excluding shelter may sour later in the session.
For long-term investors, the takeaway is to avoid reacting to the first five minutes. CPI day volatility often creates more risk for those who trade impulsively than for those who stay invested with a plan. The bigger question is whether the report changes the trajectory of interest rates over the next six to twelve months.
Which Sectors Are Most Sensitive to Inflation Data
Long-duration growth and AI stocks
Growth stocks, particularly those whose profits are expected far in the future, are generally the most sensitive to changes in interest-rate expectations. When yields rise, the present value of distant earnings falls, and valuation multiples compress. That dynamic is already visible in this market: the Nasdaq has underperformed recently amid an AI and semiconductor selloff, and this week also brings AI infrastructure earnings from CoreWeave on Tuesday and Cisco and Applied Materials on Thursday.
Banks, staples and small caps
Banks can benefit from higher rates through wider net interest margins, but sharp moves in yields can also hurt bond portfolios and raise credit concerns, so the reaction is rarely one-directional. Consumer staples companies with strong pricing power often hold up better in inflationary periods because they can pass costs on to shoppers, although margins can still be squeezed when input costs rise faster than prices.
Small-cap stocks, tracked by the Russell 2000, tend to carry more floating-rate debt and depend more on domestic borrowing conditions. That makes them more vulnerable to a higher-for-longer rate path. When CPI surprises to the downside, small caps often rally hardest; when it surprises to the upside, they can lag. Watching a small-cap fund such as IWM alongside the S&P 500 on CPI day is a useful read on how the market is interpreting the report.
Energy's role in the inflation story
Energy stocks occupy an unusual position: higher oil prices push headline inflation up, but they also lift energy-company revenues. In 2026, the conflict involving Iran has been a major driver of fuel prices, and September's CPI showed gasoline up more than a third from a year earlier. If crude prices continue to ease on diplomatic progress, headline inflation may cool faster than core, which could make the October print look better than the underlying trend.
CPI, Bond Yields and Stock Valuations
The discount-rate channel
The main way inflation data reach stock prices is through bond yields. A hotter CPI print raises expectations for Fed policy, which tends to push Treasury yields higher, especially at the short end. Higher yields raise the discount rate investors apply to future corporate earnings and make bonds more competitive with stocks. The 10-year Treasury yield was around 4.86% on November 9, near a two-month low, according to Mitrade data.
That level matters for valuation. Equity investors are currently paying for strong earnings growth: FactSet data cited by Gotrade show blended third-quarter earnings growth for the S&P 500 of about 31.4% with 88% of companies reported. If CPI pushes yields sharply higher, the market may demand more earnings growth to justify current multiples.
Real yields and the equity risk premium
Professional investors also watch real yields, which subtract expected inflation from nominal yields. When real yields rise, the cost of capital rises in real terms, and that has historically been a headwind for high-multiple stocks. The equity risk premium, the extra return investors expect from stocks over bonds, tends to shrink when yields rise but stock prices do not adjust, leaving less cushion for disappointment.
This does not mean investors should sell stocks every time yields rise. It does mean that the CPI report is best read alongside the bond market's reaction. If stocks rally while yields jump, the move may be fragile; if both stocks and yields fall on a cool print, it is usually a cleaner signal of easing pressure.
CPI vs PCE and the Rest of the Inflation Calendar
Why the Fed prefers PCE
The Federal Reserve's 2% inflation target is defined using the Personal Consumption Expenditures price index, not CPI. The Fed explains that it uses PCE largely because it covers a wide range of household spending. PCE inflation for September 2026 was 3.6%, according to the Bureau of Economic Analysis, with core PCE at 3.1% according to the Dallas Fed's data page. The next PCE release is scheduled for November 25.
CPI still matters enormously because it arrives first and because many PCE components are derived from CPI and producer price data. Economists translate each CPI release into an estimate of PCE within hours, and those estimates often drive the Fed's internal discussions as much as the CPI headline itself.
PPI, jobs and the December meeting
The October Producer Price Index follows on Friday, November 13, with FXEmpire listing a forecast of a 0.4% monthly increase. Several PPI categories, such as airfares, medical services and portfolio management fees, feed directly into PCE, so a hot PPI can offset a cool CPI, and vice versa. Weekly jobless claims on Thursday and a busy slate of Fed speakers, including Governors Waller and Bowman on Tuesday, add more signals.
A Practical CPI-Day Playbook for Investors
Before the release
Preparation is the most valuable part of any CPI-day plan. Know the consensus, know what the market is pricing and decide in advance what would change your view. If you plan to rebalance, add to positions or trim risk, set those levels before the data are released, when emotions are calm.
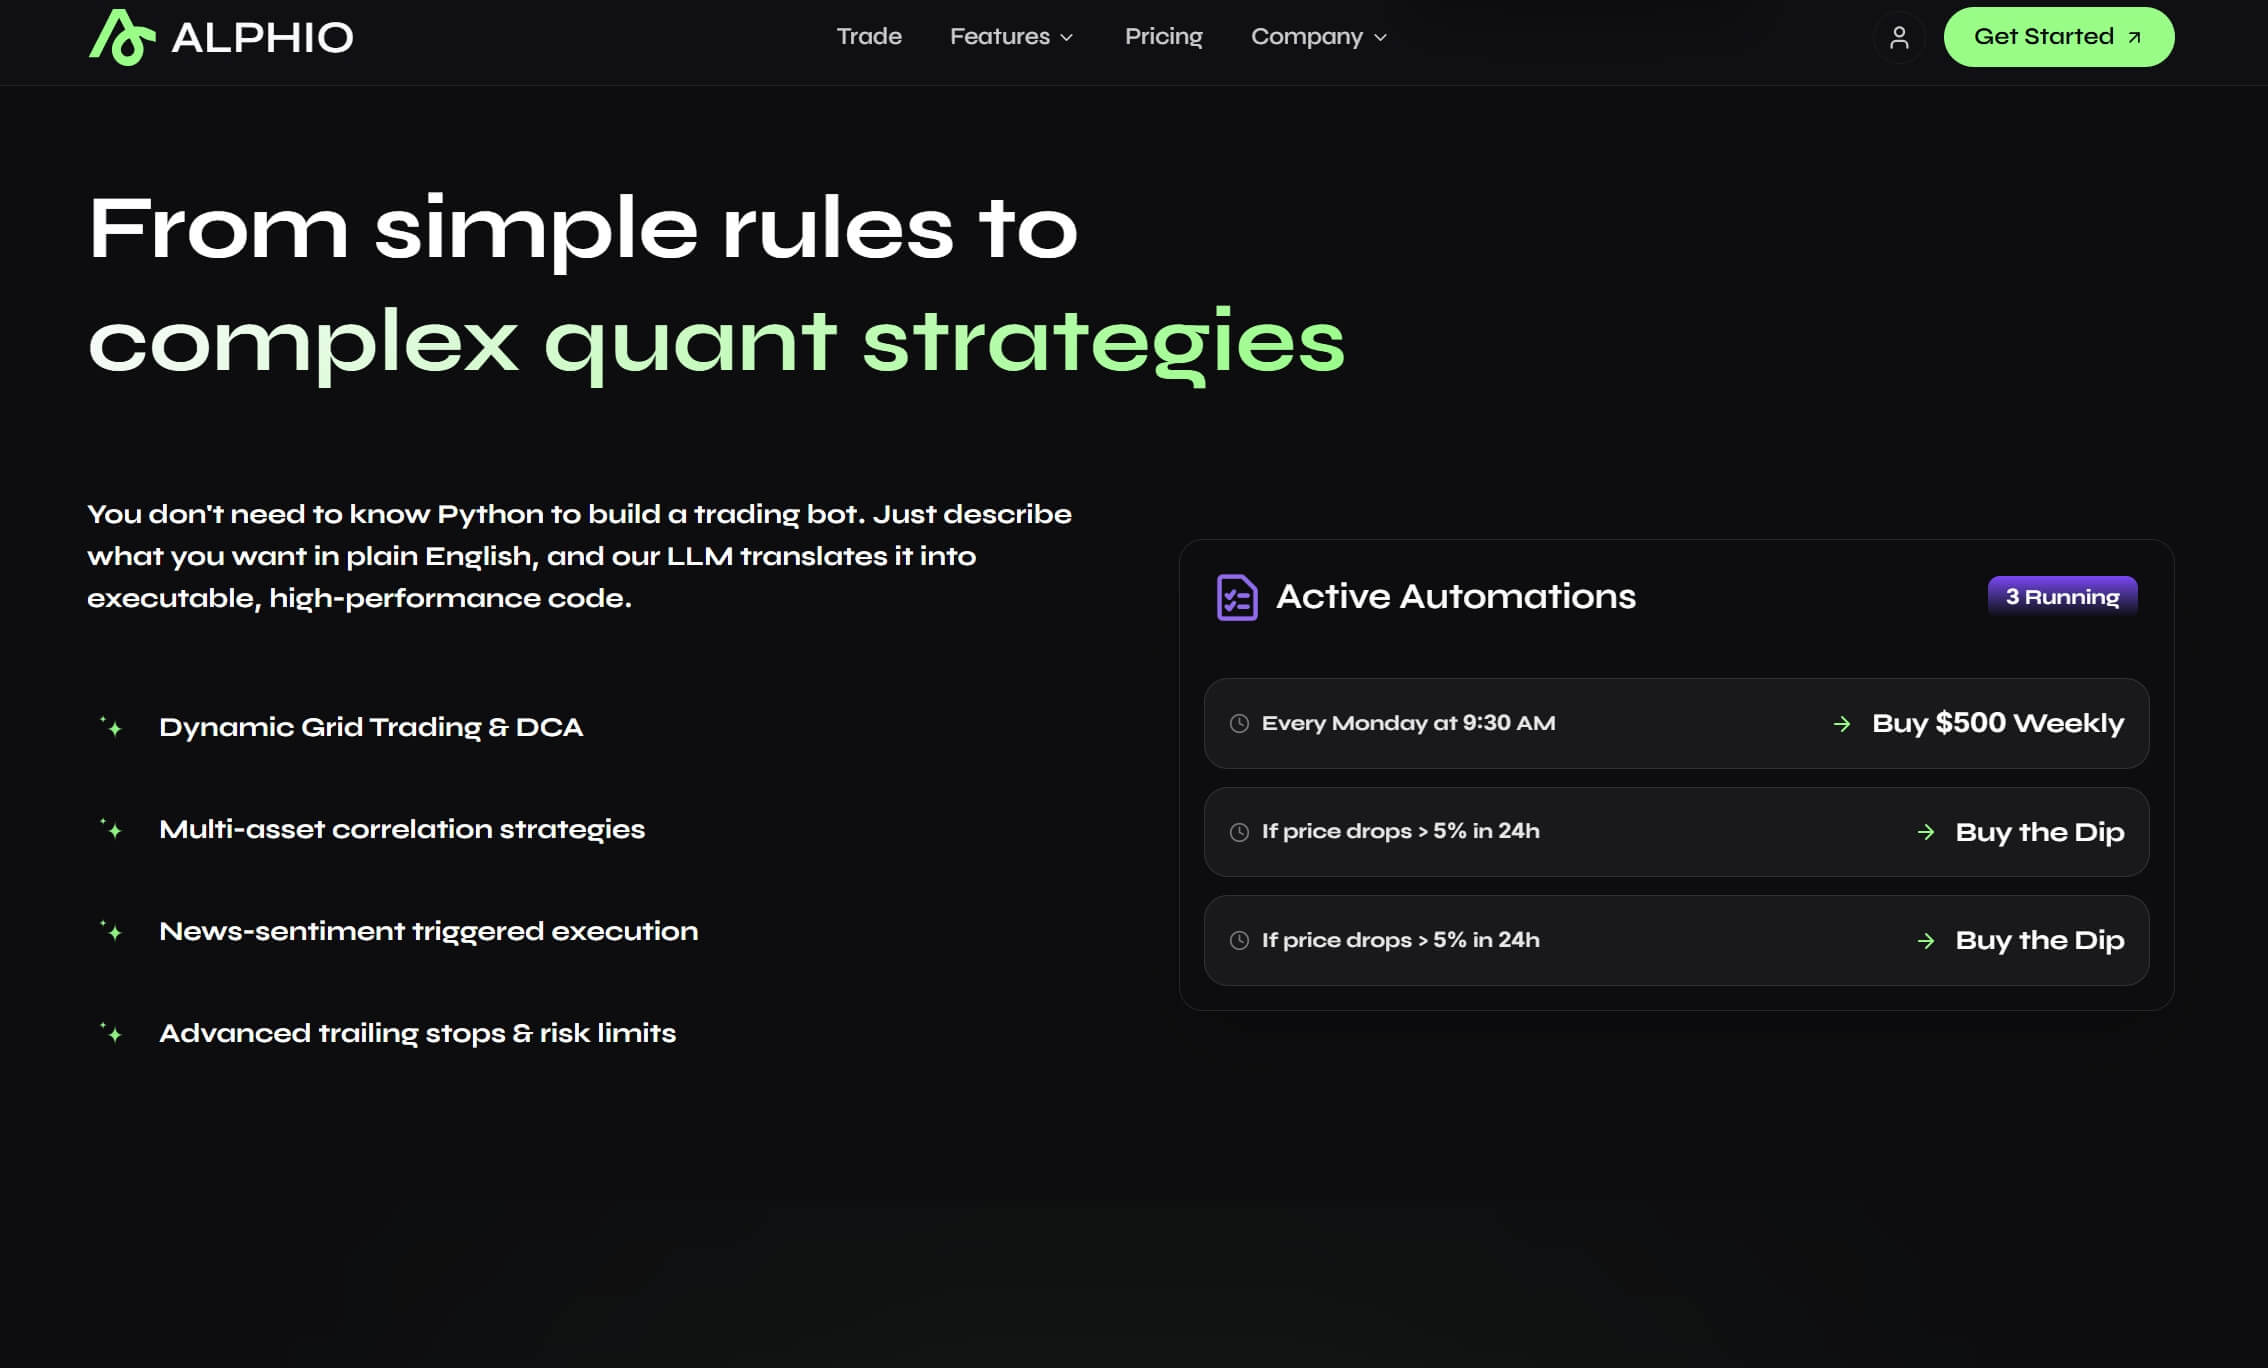
Automation can help remove the temptation to trade the first headline. With Alphio's Scheduled Task feature, you can set reminders or rules-based checks around release times, such as reviewing your portfolio's rate-sensitive positions an hour after the report rather than in the first chaotic minutes.

In the first hour
A simple checklist helps keep the first hour disciplined:
- Compare core month-over-month with the 0.2% consensus and the roughly 0.21% Cleveland Fed nowcast.
- Check shelter and services to judge whether inflation is broadening or narrowing.
- Watch the 2-year and 10-year Treasury yields for confirmation of the stock move.
- Note how small caps and growth stocks react relative to the S&P 500.
- Revisit December hike odds after the release to see how expectations shifted.
After the dust settles
The most important decisions usually come a day or two later, once the full picture, including PPI and Fed commentary, is clear. If the data meaningfully change the outlook for rates, that may justify adjusting portfolio duration, sector weights or cash levels. If they do not, staying the course is often the best response.
Tools that let you ask questions in plain language can speed up that review. Alphio's Conversational Trading lets you query your positions and market data conversationally, which can help you assess exposure to inflation-sensitive sectors without digging through multiple screens.
Conclusion
The October 2026 CPI report arrives at a delicate moment. The Fed is weighing a rate hike, futures imply roughly 77% to 81% odds of one in December, stocks just posted a difficult week and the report will lack its usual year-over-year headline because of the 2025 shutdown. For investors, that makes the monthly core reading the number to watch, with roughly 0.2% as the consensus line between relief and renewed pressure.
History shows that CPI surprises can move markets dramatically, as in the 4.3% S&P 500 drop of September 2022 and the 5.5% rally two months later. But the investors who navigate these days best are not the ones who guess the number. They are the ones who know what is priced in, read core and shelter before reacting, check the bond market's verdict and stick to a plan set in advance.
If you want help turning that discipline into a repeatable process, Alphio offers several tools. Autonomous Trading can execute your predefined rules automatically once you have written down your thesis, position sizes and exit criteria, while Copy Trade lets you follow experienced traders' strategies within your own risk limits. No tool can remove market risk or guarantee returns, but a clear, rules-based approach makes inflation-driven volatility far easier to manage.
FAQs
When is the October 2026 CPI report released?
The Bureau of Labor Statistics is scheduled to release the October 2026 Consumer Price Index on Tuesday, November 10, 2026, at 8:30 a.m. Eastern Time. The November report is scheduled for December 10, the day after the Fed's December decision.
Why is there no year-over-year CPI number for October 2026?
The BLS did not collect CPI data from October 1 through November 12, 2025, because of the federal government shutdown. Without a reliable October 2025 base, the October 2026 release reports month-over-month changes only, so investors should focus on the monthly headline and core readings.
How does a hot CPI report affect the stock market?
A CPI reading above expectations usually raises the odds of tighter Fed policy, pushes Treasury yields higher and pressures stock valuations, especially for growth and small-cap stocks. In September 2022, a hotter-than-expected report sent the S&P 500 down 4.3% in one day. The reaction depends on the surprise versus consensus, not the level of inflation itself.
What is the difference between headline CPI and core CPI?
Headline CPI measures price changes across the full consumer basket, while core CPI excludes volatile food and energy prices. Investors and the Fed focus on core because it better reflects underlying inflation; in September 2026, headline CPI rose 0.6% for the month largely because of gasoline, while core rose 0.3%.
Does the Federal Reserve use CPI or PCE for its inflation target?
The Fed's 2% inflation target is measured by the Personal Consumption Expenditures price index, which covers a broader range of household spending. CPI still matters because it is released earlier and many PCE components are derived from CPI and PPI data, so economists use it to forecast PCE.
Related articles
- AI Stocks Correction: How to Invest After the November 2026 Tech SelloffThe Nasdaq slid into correction as AI and chip stocks plunged in November 2026. Learn what drove the selloff, how valuations compare, and how to invest now.
- How to Invest in Gold in 2026: A Guide After the Price Pullback and Fed Hike FearsGold fell about 30% from its January 2026 record as Fed hike odds rose. Learn what drives gold, ETFs vs miners, taxes, and a rules-based plan to invest in gold.
- Treasury Yields and the Stock Market: What a Near-5% 10-Year Yield Means for Investors in 2026The 10-year Treasury yield hit 5.31% in October 2026 before easing to 4.88%. Learn how Treasury yields affect stocks, which sectors react and how to plan.
- Copper Price Forecast 2026: How AI Data Center Demand Is Creating a Structural Supply GapExplore copper price forecast for 2026 as AI data center demand creates structural supply deficits. Learn investment strategies for the AI-energy nexus era.
- US Reimposes Iran Oil Sanctions: How Geopolitical Tensions Are Reshaping Energy MarketsExplore how US reimposed oil sanctions on Iran are driving crude prices higher and creating investment opportunities in energy stocks amid geopolitical tensions.
- Gold Price Outlook July 2026: Navigating Fed Policy Uncertainty and Market VolatilityGold prices near $4,170 face pressure from Fed policy uncertainty. Explore the outlook for XAUUSD, Fed rate decisions, and key support levels for July 2026.