

Stock Market Outlook 2027: What Wall Street's S&P 500 Forecasts Really Tell Investors
Stock market outlook 2027: what Goldman, UBS, BofA and bears forecast for the S&P 500, the earnings math behind targets, and how to plan for any scenario.

Key Takeaway
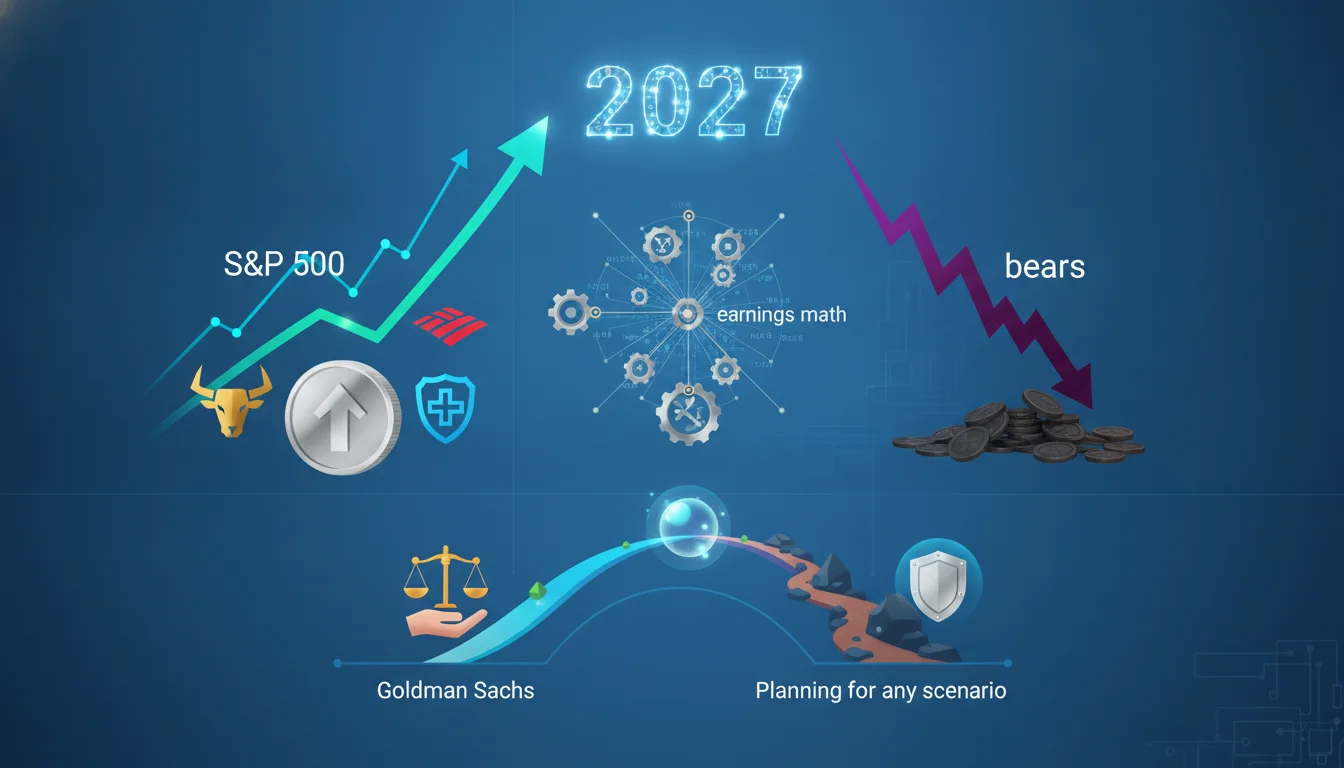
Wall Street's forecasting season for 2027 is officially underway, and the early numbers are surprisingly optimistic for a market that just lived through its roughest autumn in years. Goldman Sachs strategist Peter Oppenheimer now sees the S&P 500 reaching 8,700 over the next 12 months, about 14% above the index's November 11 close of 7,619, according to Investing.com. UBS strategist Keith Parker has a year-end 2027 target of 8,900, built on an earnings forecast of $430 per share. At the other extreme, Panmure Liberum's Joachim Klement has outlined a base case of 5,000 by the end of 2027, arguing that the AI spending boom is close to breaking.
Those calls arrive against a difficult backdrop. The Federal Reserve raised rates in September 2026 and is widely expected to hike again at its December 8–9 meeting, the 10-year Treasury yield stood at 5.15% on November 13 according to Treasury Department data, and the Nasdaq spent part of November in correction territory. The S&P 500 closed Friday, November 13, at 7,561.67, down 0.4% on the day but up 2.5% for the week, according to the Associated Press.
This guide explains what the major 2027 stock market forecasts actually say, the earnings and valuation math underneath them, why year-end targets miss as often as they do, and how investors can turn a wide range of forecasts into a practical, rules-based plan. Market data are as of the close on November 13, 2026 (America/New_York) unless noted. Every target and estimate below is a projection, not a guarantee, and nothing here is personalized investment advice.
Where the Stock Market Stands Heading Into 2027
A volatile November reset the starting point
Any 2027 forecast depends heavily on where the market begins, and the starting line moved sharply this month. On Thursday, November 5, the S&P 500 fell 4.4% to 7,353.73 and the Nasdaq Composite dropped 5.5%, the worst day for the S&P 500 since the April 2025 tariff shock, according to AP. Worries about the return on AI spending, higher borrowing costs and political pressure on data-center construction after the midterm elections all hit at once. The market then rebounded, and by the end of the following week the S&P 500 and Nasdaq had snapped four-week losing streaks.
The rebound did not erase the damage beneath the surface. Morgan Stanley's Mike Wilson described the recent action as a "pretty devastating correction under the surface," pointing to deep losses in many individual stocks even when the index held up, according to a GuruFocus report syndicated by Yahoo Finance on November 10. Friday's session added a new source of uncertainty, as Nvidia shares fell after the resignation of chief executive Jensen Huang, according to AP and Bloomberg coverage. For forecasters, that means 2027 outlooks are being written in the middle of a correction rather than at a calm peak.
Rates have become the main macro constraint
The interest rate picture is the biggest change from a year ago. The Fed lifted the federal funds target range to 3.75%–4.00% in September 2026 and held it there on October 28 in a 10–2 vote, with two dissenters favoring another hike, according to the Fed's statement. After the October CPI report showed core inflation rising 0.3% for a third straight month, CME FedWatch data cited by Mortgage Professional America on November 10 put the odds of a December quarter-point hike at 89%.
Bond yields have followed. A 5.15% 10-year Treasury yield gives investors a competitive, nearly risk-free alternative to stocks, which tends to cap how much they will pay for each dollar of corporate earnings. Any 2027 forecast that assumes rising valuations is implicitly betting that this rate pressure eases.
Earnings did the heavy lifting in 2026
The bullish case for 2027 rests on a simple fact: corporate profits grew rapidly in 2026. Bloomberg, reporting on Goldman's outlook, said the bank estimates S&P 500 earnings per share grew 36% in 2026 and will slow to 11% growth in 2027. UBS similarly described 2026 earnings as on track for growth of roughly a third. Because prices rose much less than profits, valuations fell. UBS estimates the forward price-to-earnings ratio dropped about 20% during 2026.
That combination of fast earnings growth and a lower multiple is why many strategists see the index as more reasonably priced than its headline level suggests. It is also why the debate for 2027 is less about whether companies are profitable today and more about how quickly growth decelerates, especially among the AI-heavy megacaps that dominate the index.
The Bull Case: What Goldman Sachs and UBS Are Forecasting
Goldman Sachs: 8,700 with "high volatility"
Goldman's call, published November 13, projects the S&P 500 at 8,700 within 12 months, a 14% price gain or about 16% including dividends, according to Investing.com. Oppenheimer's team argues that equities have de-rated sharply after a year of strong earnings, leaving valuations more attractive. He framed the outlook carefully, writing "we expect equities to continue to rise, but with high volatility," and noted that risks are becoming more two-sided as bonds, oil prices and shifts in AI spending feed volatility.
One of the more striking parts of the Goldman note concerns the largest technology companies. According to Bloomberg, the strategists said hyperscalers now trade well below their historical valuations and described technology, and the hyperscalers in particular, as relatively defensive. Goldman is overweight U.S. and Japanese equities and prefers long-duration growth stocks. The note also acknowledged that the biggest companies have turned cash-flow negative as AI spending soars, which is the central tension in the bull case.
UBS: 8,900 on $430 of earnings
UBS has the highest of the widely reported year-end 2027 targets at 8,900, according to a StockTwits report syndicated by Yahoo Finance on November 11. Parker's team projects S&P 500 earnings per share of $430 in 2027, up 18%, and $490 in 2028, up 14%, and set an end-2028 target of 9,600. The 8,900 level works out to about 18 times projected 2028 earnings.
UBS leans on history to support the view. After the S&P 500's forward multiple falls by more than 10% in a year, the index has historically delivered a median return of about 20%, the firm noted. UBS also listed meaningful headwinds, including uncertain returns on AI spending, possible regulation, higher bond yields and credit spreads, rising oil prices and weaker buybacks. It flagged that state-level pauses on data-center construction after the midterms could put about 30% of planned 2028 U.S. capacity additions at risk.
Other published targets cluster in the high 8,000s
Few major banks had formally published year-end 2027 targets as of mid-November, and most are expected to release full outlooks between now and mid-December. Among those reported, Barclays has a target of 8,800 and Wells Fargo Investment Institute has a range of 8,600 to 8,800, both from midyear outlooks reported by Reuters, according to a forecast tracker compiled by SimianX. Earlier in the year, Partners Group's Anastasia Amoroso told CNBC she saw a path to roughly 8,500 on 2027 earnings, with 8,200 a more likely landing spot.
The Skeptics: Crowding, AI Capex and a 5,000 Bear Case
Bank of America worries about a crowded index
Not every major strategist is bullish. Bank of America's Savita Subramanian has questioned how much room the index has to rally, according to the same StockTwits report. She flagged that the S&P 500 itself may be the most crowded equity trade, noting, "We've never been in a market environment where the index has seen outflows." She also pointed to rising debt at the hyperscalers and questioned whether the AI trade is sustainable.
The crowding argument matters because index investing has become the default for millions of savers. When so much money owns the same handful of megacap stocks through the same index products, a shift in sentiment can move prices quickly in both directions.
Panmure Liberum's 5,000 base case
The most bearish widely reported call comes from Joachim Klement of Panmure Liberum, whose base case of 5,000 by the end of 2027 implies roughly 36% downside, according to a GuruFocus report on TradingView. Klement argues that "the AI bubble will either burst in 2027 or in 2028" as hyperscalers face rising financing costs and stretched free cash flow. The report cited a Bloomberg Intelligence estimate that hyperscaler data-center spending will reach about $713 billion in 2026, more than double the 2025 level.
Klement's view is an outlier, but it frames the downside: if AI spending is cut sharply while rates stay high, valuations could compress far more than the consensus expects. Note that the published bullish targets, set at different times, imply gains of roughly 10% to 18% from the November 13 close.
Morgan Stanley's near-term floor
Morgan Stanley's Wilson sits between the camps. Rather than a 2027 year-end number, he has identified a downside range of 7,100 to 7,300 for the S&P 500 and expects a recovery into 2027, according to the November 10 GuruFocus report. He argues that falling oil prices could ease inflation and support margins, and that the six to 12 months after midterm elections have historically been strong for stocks. He also cautioned that the reason oil falls matters, since a decline driven by weak demand would be far less supportive than one driven by supply.
The Math Behind an S&P 500 Forecast
Earnings multiplied by a multiple
Every index target is ultimately two forecasts multiplied together: expected earnings per share and the price-to-earnings multiple investors will pay for those earnings. Using UBS's $430 estimate for 2027, the November 13 close of 7,561.67 equals about 17.6 times next year's projected earnings. That is a reasonable but not cheap multiple by historical standards, and it shows how much of the bull case depends on earnings arriving on schedule.
Estimates for 2027 earnings vary more than the targets suggest. According to the SimianX tracker, published estimates as of late October ranged from about $380 at Morgan Stanley to $430 at UBS, with JPMorgan at $420 and Citi at a preliminary $400. A spread of $50 per share sounds small, but at an 18 times multiple it is worth roughly 900 index points.
A simple sensitivity table in words
A quick illustrative exercise shows how sensitive outcomes are. If 2027 earnings hit $430 and investors pay 16 times, the index would sit near 6,880. At 18 times, it would be about 7,740. At 20 times, it would reach about 8,600. If earnings instead come in at $400, the same multiples produce roughly 6,400, 7,200 and 8,000. These are arithmetic illustrations, not forecasts, but they show that a modest change in either input swings the result by thousands of points.
The lesson is that a 2027 forecast is really a set of assumptions about profits and confidence. When a bank says 8,900, ask which earnings and multiple assumptions must hold, and how plausible they look today.
What 5% Treasury yields do to the multiple
Interest rates are the main force acting on the multiple. A common shorthand compares the market's earnings yield, the inverse of the P/E ratio, with the 10-year Treasury yield. At 17.6 times forward earnings, the S&P 500's earnings yield is about 5.7%, only modestly above the 5.15% Treasury yield. That thin cushion is one reason strategists such as UBS list higher bond yields as a key headwind.
If yields fall in 2027 because inflation cools, the case for a higher multiple strengthens. If yields keep rising because the Fed must tighten further, even strong earnings growth may not lift prices much.
Why Wall Street's Year-End Targets Miss So Often
The track record is humbling
Strategist targets are useful for understanding the debate, but they are poor at predicting exact outcomes. A SimianX analysis of consensus year-end S&P 500 targets from 2008 through 2025 found a median absolute miss of 13.2%. The consensus landed within 5% of the actual close in only three of 17 years, and it was too low in 12 of 17 years. Notably, the consensus never predicted a down year in that sample, even though several occurred.
That pattern reflects how forecasts are built: strategists typically extrapolate earnings and assume a stable multiple, producing high-single-digit gains. Real markets rarely deliver an average year.
Lessons from 2022 and 2023
The past few years illustrate the problem. Heading into 2022, the Bloomberg consensus target was 4,950, but the S&P 500 finished the year at 3,839.50, a miss of more than 22%, as the Fed raised rates aggressively and valuations collapsed, according to the SimianX data. A year later, the consensus expected 4,078 for 2023 and the index closed at 4,769.83, beating the forecast by about 17% as an AI-driven rally took hold.
Both years share a lesson for 2027. The decisive variable was not earnings so much as the multiple, which moved in response to interest rates and enthusiasm about technology. With the Fed hiking again and AI spending under scrutiny, those same two forces are likely to decide whether 2027 resembles 2022, 2023 or something in between.
How to use forecasts without being misled
The best way to use 2027 targets is as a map of scenarios rather than a destination. The range of published views, from 5,000 to 8,900, tells you that professional opinion is unusually divided. The reasoning behind each target tells you which indicators to watch. And the historical error rate tells you to size positions so that you can live with outcomes far from the consensus.
Key Variables That Will Shape the 2027 Stock Market
The Fed, inflation and the bond market
The first variable is monetary policy. A December hike is widely expected, but what matters for 2027 is whether the Fed stops there or continues tightening. Watch monthly CPI and PCE inflation, the Fed's updated projections at the December meeting and the 10-year Treasury yield. A sustained drop in yields would support the bulls' multiple assumptions, while yields pushing further above 5% would strengthen the skeptics.
AI spending, returns and data-center politics
The second variable is whether AI investment starts generating visible returns. Hyperscaler capital spending guidance, cloud revenue growth and free cash flow will all be scrutinized during fourth-quarter earnings season in January and February 2027. Political risk is also rising: Democrats won control of both chambers of Congress in the November midterms, according to AP projections, and UBS highlighted state-level pressure on data-center construction. Investors who want to stay on top of these releases can set up recurring checks with Alphio's Scheduled Task feature, so earnings dates, CPI releases and Fed meetings trigger a review rather than a reaction.

Oil, breadth and earnings revisions
The third group of variables is more technical but just as important. A practical 2027 dashboard might include:
- Brent and WTI crude prices, since Wilson's recovery thesis depends partly on lower energy costs.
- The share of S&P 500 stocks trading above their 200-day moving averages, a breadth signal Klement watches closely.
- The direction of consensus 2027 earnings revisions, which often moves before strategists change their targets.
- Credit spreads on corporate and hyperscaler debt, which reveal how lenders view AI financing risk.
How to Build a 2027 Investment Plan Around Uncertainty
Weight scenarios instead of picking a number
Rather than choosing one forecast, investors can assign rough probabilities to several scenarios and ask how their portfolio would perform in each. A bull scenario might look like the Goldman and UBS cases, with earnings near $430 and multiples stable or rising. A base scenario might involve slower earnings growth and a flat multiple, leaving the index near current levels. A bear scenario could combine an AI spending pullback with yields above 5%, closer to the skeptics' view.
Diversify against concentration risk
Concentration is one of the clearest risks heading into 2027. When a small group of megacaps drives both earnings growth and index weight, the S&P 500 is less diversified than it looks. Investors can reduce that dependence by pairing a market-cap-weighted core with equal-weight exposure, adding sectors that benefit from lower oil prices or higher rates, and reviewing international allocations. Comparing the equal-weight index with the standard S&P 500 is a simple way to see whether gains are broadening or narrowing.
Write rules before the volatility arrives
Goldman's own outlook expects high volatility, which makes pre-commitment valuable. Decide in advance how much of a drawdown you are willing to tolerate, at what thresholds you will rebalance, and which data points would change your view. If you want to pressure-test those rules against live market data, Alphio's Conversational Trading lets you ask questions about positions, sectors and valuations in plain language before you act.
Conclusion
The 2027 stock market outlook is unusually divided. Bulls at Goldman Sachs and UBS see the S&P 500 climbing to 8,700 or 8,900 as earnings keep growing and valuations look more reasonable after a year of de-rating. Skeptics at Bank of America and Panmure Liberum worry about crowding, AI spending and rates that may stay higher for longer. Between them, the numbers that will decide the outcome are the path of Treasury yields, the return on AI investment and the durability of earnings growth.
History suggests the final 2027 close will probably differ meaningfully from today's targets, so the smartest response is a process rather than a prediction. Investors who prefer to follow proven strategies can explore Copy Trade, and those who want rules executed consistently through volatility can look at Autonomous Trading. Whatever tools you use, write down your scenarios, risk limits and rebalancing rules first, and let the data, not the headline targets, guide each decision.
FAQs
What is Wall Street's S&P 500 forecast for 2027?
Published targets so far range widely. Goldman Sachs sees 8,700 within 12 months and UBS has a year-end 2027 target of 8,900, while Panmure Liberum's Joachim Klement has a bear case of 5,000. Most large banks are expected to publish full 2027 outlooks between mid-November and mid-December 2026.
Will the stock market go up in 2027?
No one can know for certain. Most published strategist targets imply gains of roughly 10% to 18% from the November 13, 2026 close, but consensus targets have historically missed the actual year-end level by a median of about 13%, so investors should plan for a wide range of outcomes.
How accurate are Wall Street year-end stock market forecasts?
Not very accurate on exact levels. A SimianX analysis of consensus targets from 2008 through 2025 found a median absolute miss of 13.2%, with forecasts landing within 5% in only three of 17 years. The consensus also never predicted a down year in that period.
What are the biggest risks to stocks in 2027?
Strategists most often cite higher interest rates and bond yields, uncertain returns on heavy AI spending, rising hyperscaler debt and political pressure on data-center construction. Crowding in the S&P 500 and oil price swings are also on the list of risks named by Bank of America and UBS.
How should investors use 2027 stock market predictions?
Treat forecasts as scenarios rather than destinations. Use the reasoning behind each target to identify the indicators to watch, such as Treasury yields, earnings revisions and market breadth, and size positions so your portfolio can withstand outcomes far from the consensus.
Related articles
- Dollar-Cost Averaging vs Lump Sum: How to Invest Cash in a Volatile, High-Yield 2026 MarketDollar cost averaging vs lump sum in a volatile 2026 market: what Vanguard's research shows, how 4%+ T-bill yields change the math, and how to build a plan.
- REITs and Rising Interest Rates in 2026: Why Real Estate Stocks Are Holding Up and Where the Risks AHow rising interest rates affect REITs in 2026: why REITs are up despite Fed hikes, which sectors hold up, how to value REITs and build a rate-aware allocation.
- International Stocks vs US Stocks in 2026: How the Strong Dollar and Valuations Change the CaseInternational stocks vs US stocks in 2026: how the strong dollar, valuation gaps, Fed hikes and concentration risk shape a smarter global allocation plan now.
- Greg Abel Takes the Helm: How Berkshire Hathaway's New Leader Is Reshaping the Iconic PortfolioDiscover how Greg Abel is reshaping Berkshire Hathaway's portfolio. Learn about the Chevron stake reduction, new top holdings, and what it means for value investors.
- 6 Best AI Crypto Trading Bots in 2026: Are They Right for You?Discover the 6 best AI crypto trading bots in 2026. Compare 3Commas, Alphio AI, Bitsgap, Coinrule, CryptoHopper, Pionex and TradeSanta to find the perfect automated trading solution for your strategy.
- Micron Stock Price Prediction 2026: Recovery Opportunity After 39% DeclineMicron stock is down 39% from highs. Discover expert price predictions for 2026-2028, AI memory demand drivers, and whether MU is a smart semiconductor investment.