
樂
樂觀
樂觀 · 25%TSLA
$370.03
情境價格
$373.710
+5.755 (+1.54%)收盤時
Tesla, Inc. designs, develops, manufactures, sells and leases high-performance fully electric vehicles and energy generation and storage systems, and offers services related to its products. Its segments include automotive, and energy generation and storage. The automotive segment includes the design, development, manufacturing, sales and leasing of high-performance fully electric vehicles, and sales of automotive regulatory credits. It also includes sales of used vehicles, non-warranty maintenance services and collisions, part sales, paid supercharging, insurance services revenue and retail merchandise sales. The energy generation and storage segment include the design, manufacture, installation, sales and leasing of solar energy generation and energy storage products and related services and sales of solar energy systems incentives. Its consumer vehicles include the Model 3, Y, S, X and Cybertruck. Its lithium-ion battery energy storage products include Powerwall and Megapack.
Tesla Inc is currently not a strong buy due to its low RSI of 26.205, indicating oversold conditions, and a high forward P/E ratio of 158.73, suggesting overvaluation. The stock has seen a significant decline of 19.03% year-to-date, which raises concerns about its short-term performance. However, analysts maintain a positive outlook with price targets ranging from $400 to $550, indicating potential upside. The main risk is the recent earnings surprise of -87.5%, which could further impact investor sentiment.
Jefferies
$400
2026-10-12
Jefferies
2026-10-12
目標價
$400
Tigress Financial
$550
2026-10-08
Tigress Financial
2026-10-08
目標價
$550
UBS
$391
2026-10-07
UBS
2026-10-07
目標價
$391
JPMorgan
$415
2026-10-03
JPMorgan
2026-10-03
目標價
$415
JPMorgan
$415
2026-09-28
JPMorgan
2026-09-28
目標價
$415
情境價格取自當年最後一個月度預測區間。機率為固定的模型權重(25 / 50 / 25),不構成保證。
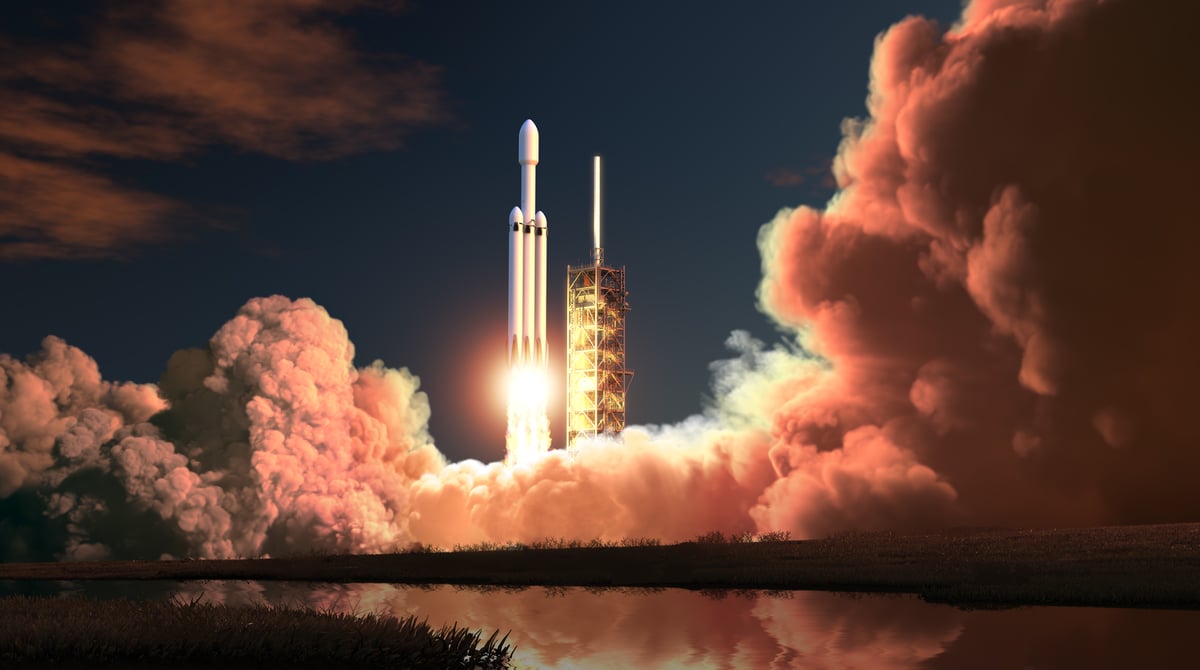
SpaceX Aims for $1 Trillion Revenue by 2030

AGI Era Approaches as Tech Giants Race for the Future
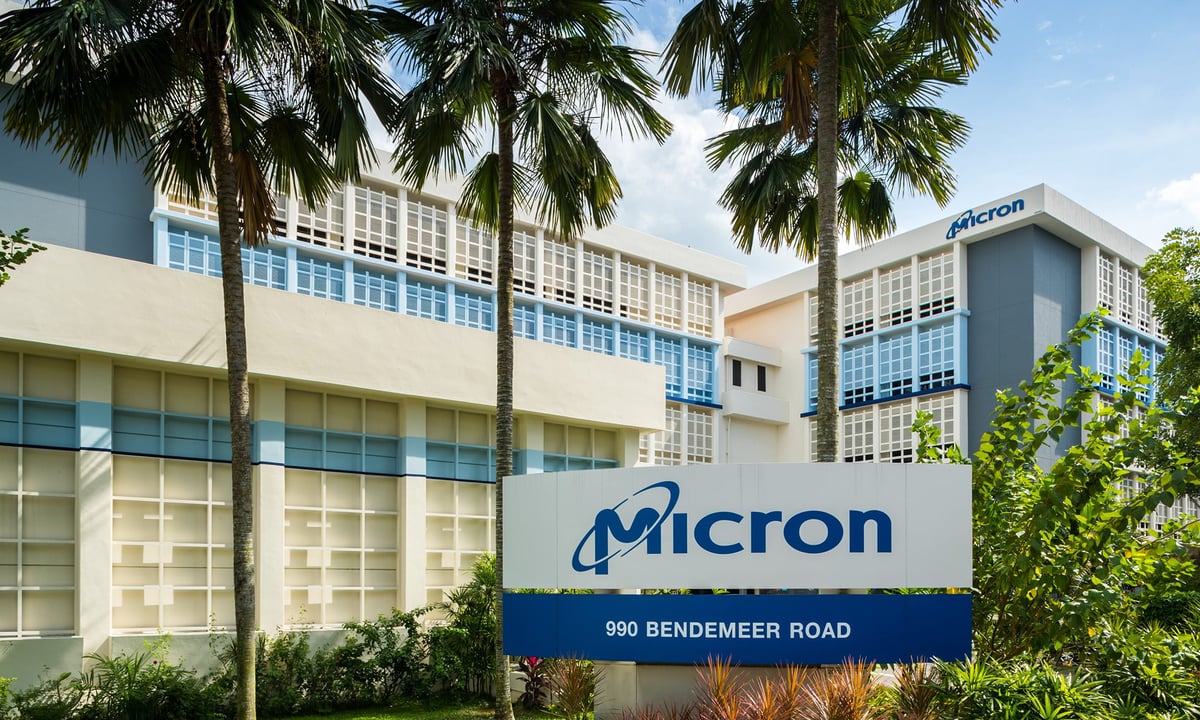
Micron Technology: Surge in AI Infrastructure Demand

Tesla's New Roadster Sparks Market Interest
Comparing Tesla and SpaceX's Performance Over the Next Five Years
Tesla, Inc. designs, develops, manufactures, sells and leases high-performance fully electric vehicles and energy generation and storage systems, and offers services related to its products. Its segments include automotive, and energy generation and storage. The automotive segment includes the design, development, manufacturing, sales and leasing of high-performance fully electric vehicles, and sales of automotive regulatory credits. It also includes sales of used vehicles, non-warranty maintenance services and collisions, part sales, paid supercharging, insurance services revenue and retail merchandise sales. The energy generation and storage segment include the design, manufacture, installation, sales and leasing of solar energy generation and energy storage products and related services and sales of solar energy systems incentives. Its consumer vehicles include the Model 3, Y, S, X and Cybertruck. Its lithium-ion battery energy storage products include Powerwall and Megapack. It operates in the Consumer Cyclicals sector (MOTOR VEHICLES & PASSENGER CAR BODIES industry).
Tesla Inc is currently not a strong buy due to its low RSI of 26.205, indicating oversold conditions, and a high forward P/E ratio of 158.73, suggesting overvaluation. The stock has seen a significant decline of 19.03% year-to-date, which raises concerns about its short-term performance. However, analysts maintain a positive outlook with price targets ranging from $400 to $550, indicating potential upside. The main risk is the recent earnings surprise of -87.5%, which could further impact investor sentiment.
23 analysts cover TSLA: 8 rate it Buy, 8 Hold and 7 Sell. The average price target is 401.93.

Thinking about a potential $SPCX $TSLA merger: The consensus thinking and market reaction around a potential Tesla (TSLA) and SpaceX (SPCX) merger center on massive scale, vertical integration, and complex governance hurdles. With special independent director committees formally exploring a combination, Wall Street analysts and investors are weighing the valuation implications of creating a multi-trillion-dollar entity. 1. Valuation and Market Scale Combined Valuations: Reference valuations place SpaceX around $2.1 trillion to $2.2 trillion and Tesla around $1.5 trillion. Global Standing: A merged entity would instantly carry a market capitalization in the $3.5 trillion to $3.7 trillion range, placing it among the most valuable companies globally (rivaling Microsoft and Amazon). Stock Reactions: Both stocks have seen upward momentum and heightened volatility on merger speculation, with after-hours moves for SpaceX and positive moves for Tesla following earnings commentary (reports tonight). 2. Deal Structure and Exchange Ratios All-Stock Transaction: Major firms like Barclays view an all-stock acquisition as the most logical structural path. Ownership Split: Depending on the exact valuation metrics and whether a buyout premium is applied, baseline projections suggest SpaceX shareholders would own roughly 58% to 59% of the combined company, with Tesla shareholders owning the remaining 41% to 42%. The Premium Debate: Analysts have discussed various targets—such as Gary Black modeling a $420/share takeout or RBC's Tom Narayan pointing toward a potential $480/share combo deal—to attract Tesla minority shareholders. Every 10% premium applied to Tesla effectively shifts tens of billions in equity consideration. 3. The Consensus "Pros and Cons" on Valuation Drivers The Bull Case 🐂 (Synergies & Growth): Proponents argue that vertical integration—combining Tesla's AI/compute architecture, energy storage, and manufacturing prowess with SpaceX's rocketry, Starlink connectivity, and "Super Intelligence" AI revenue—creates an unmatched tech ecosystem. SpaceX's rapid revenue and profit growth (supported by recent earnings beats) is seen as a powerful catalyst to offset the slower bottom-line growth facing legacy automotive operations. The Bear Case 🧸 & Hurdles: Skeptics point out that combining a high-growth aerospace/satellite titan with a mature EV manufacturer could dilute pure-play valuations. Furthermore, Elon Musk has cautioned that securing approval from 50% of all independent Tesla shares is a steep hurdle. Convincing retail and institutional investors that the exchange ratio is fair remains the primary friction point for the special committees. This is for informational purposes only. For financial advice, consult a professional. 🧠👀
展開
$TSLA Musk's big move is here! Is Tesla's after-hours earnings report a surprise or a trap? The most important news for Tesla right now is the Q3 earnings report after tonight's US market close. The market is no longer focused on how many cars were sold, but on whether profit can hold up and when the money burned on AI and robotics will show returns. A few days ago, Tesla unveiled a flying Tesla using SpaceX thruster technology. CFRA raised its price target from $385 to $475, citing the growing perception that Musk's magic is back. But there is also significant controversy. Musk said mass production will wait until 2028, no price has been announced, and it is not even certain whether it will be legal on the road. Analysts think it is just an engineering showcase and will not bring substantial revenue in the short term. Overall, it still comes down to the earnings report after the US market close. What do you all think? Let's talk in the comments! #StockEarningsSeason #OCCIssuesFirstFinalRuleForGENIUSAct #TrumpPlansToAddressOverseasCryptoFraud
展開

Apple, Nvidia, and Tesla options are seeing new changes! With CBOE's extended hours, who deserves the most attention? US stock investors, take note! CBOE's C1 options exchange has added pre-market and post-market trading sessions for options on select popular individual stocks and ETFs. Familiar names like Apple, Nvidia, and Tesla are on the first list. It sounds like a feast for traders, but don't rush to open your account just yet. New opportunities are here, and the key isn't whether you can trade, but how you trade. 1. Popular names get a more flexible trading window According to information published by CBOE, the new sessions take effect from October 19. Eligible single-stock options can participate in pre-market trading from 7:30 to 9:25 ET, and in post-market trading from 16:00 to 16:15. The first list also includes ETF options such as SPY, QQQ, and IWM. For investors focused on index moves, tech stock news, and overnight risk, this adds operational flexibility. 2. Earnings-season moves may be easier to handle, but don't mistake convenience for an advantage Company earnings, guidance, and breaking news often shift market expectations. The added sessions give some investors a chance to adjust positions earlier. However, being able to trade a price doesn't mean the price is necessarily reasonable. Pre-market and post-market volume may be relatively thin, and quote fluctuations may be more pronounced. If you only look at stock price moves while ignoring an option's implied volatility, bid-ask spread, and time value, even if you get the direction right, you may not achieve the desired return. 3. What deserves attention isn't who rises the most, but whose risk is controllable For long-term investors, the added sessions can be used to observe and manage risk; for short-term traders, stricter limit orders, position control, and stop-loss discipline are needed. Don't let "seizing the opportunity" turn into "chasing the market." The market never lacks volatility; what it lacks is calm. CBOE's extended hours deserve attention, but what truly determines the outcome is still strategy and execution. If it were you, would you focus first on options on popular individual stocks like Nvidia, or on ETF options like SPY and QQQ? $TSLA #CBOEExtendsOptionsTradingHours
展開

$TSLA just exploded! Musk laid it all out—are $SPCX and Tesla merging? Keep a close eye tonight! This news has the market on fire! At SpaceX's earnings call, Musk officially confirmed that Tesla and SpaceX are merging, and a special committee has even been formed! Looking at SpaceX's financials, they took off: Q3 net profit of $4.4 billion, not only a huge profit but AI business revenue surged 830%! How strong is this catalyst? As soon as the news came out, funds rushed in, Tesla's stock price firmly held 380 and reached around 384, with all moving averages in a bullish alignment—bulls are fully in control! But don't get too carried away—there are two details to watch: 1. The merger has a threshold. Musk said it requires more than 50% of Tesla shareholders to vote in favor; this isn't finalized yet. 2. Tesla itself is also reporting earnings tonight. The merger catalyst has already maxed out expectations—if earnings profit declines, it could easily turn into "good news priced in" and get sold off. The strategy now is simple: don't act impulsively tonight! Wait for earnings to land. If the data holds up, with the merger tailwind, the main upward wave is confirmed; if earnings disappoint, wait for a pullback to look for opportunities. #StockEarningsSeason
展開本頁僅供研究參考,不構成投資建議。模型可能出錯。過往表現不代表未來結果。