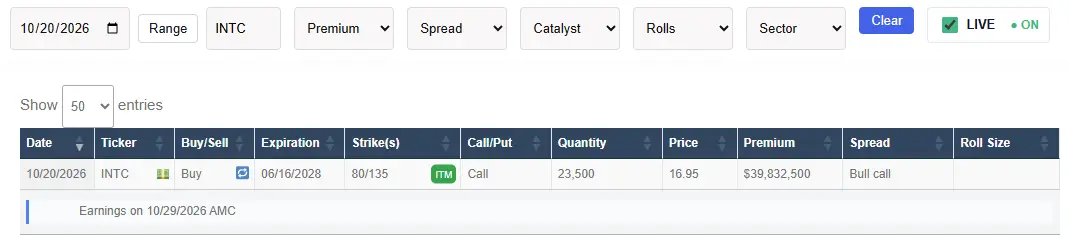
樂
樂觀
樂觀 · 25%INTC
$18.42
情境價格
$92.030
+2.236 (+2.43%)收盤時
Intel Corporation is a global designer and manufacturer of semiconductor products. The Company's segments include Intel Products, Intel Foundry, and All Other. Its Intel Products comprise Client Computing Group (CCG) and Data Center and AI (DCAI). CCG delivers platforms and processors that power PCs and edge devices, enabling enhanced performance, connectivity and user experience for consumer and commercial markets with capabilities that also support retail, industrial robotics and AI ecosystems at the edge. DCAI delivers workload-optimized solutions based upon its x86 architecture for data centers, including CPUs, AI accelerators, NICs, IPUs and custom ASICs, enabling performance and scalability for cloud, enterprise, telecommunication and HPC environments. The Intel Foundry segment comprises technology development, manufacturing and foundry services, developing new semiconductor process technologies and advanced packaging technologies. All Other segments include Mobileye and Other.
Intel Corp is currently not a good buy due to its low RSI of 12.539, indicating oversold conditions, and a significant 14.18% decline over the past five days. While the stock has a strong year-to-date performance of +128.16%, the recent insider selling has increased by 308.41%, which raises concerns about future performance. The forward P/E ratio is high at 63.2911, suggesting that the stock may be overvalued at its current price of $89.85. The main risk is the negative sentiment reflected in the recent market sell-off, particularly impacting semiconductor stocks, as evidenced by the iShares Semiconductor ETF dropping 15% since October 5.
Mizuho
$114
2026-10-06
Mizuho
2026-10-06
目標價
$114
Tigress Financial
$145
2026-09-15
Tigress Financial
2026-09-15
目標價
$145
Piper Sandler
$110
2026-09-09
Piper Sandler
2026-09-09
目標價
$110
Northland
$120
2026-09-08
Northland
2026-09-08
目標價
$120
Mizuho
$92
2026-09-04
Mizuho
2026-09-04
目標價
$92
情境價格取自當年最後一個月度預測區間。機率為固定的模型權重(25 / 50 / 25),不構成保證。

Intel's Data Center Business Drives Strong Growth
Tech Stocks Rebound as Investors Return to Market
CoreWeave Faces Debt Concerns Amid AI Stock Rally
AMD Stock Soars 147% Amid Strong AI Demand
Bank of America Downgrades Ameriprise, Stock Drops Nearly 4%
Intel Corporation is a global designer and manufacturer of semiconductor products. The Company's segments include Intel Products, Intel Foundry, and All Other. Its Intel Products comprise Client Computing Group (CCG) and Data Center and AI (DCAI). CCG delivers platforms and processors that power PCs and edge devices, enabling enhanced performance, connectivity and user experience for consumer and commercial markets with capabilities that also support retail, industrial robotics and AI ecosystems at the edge. DCAI delivers workload-optimized solutions based upon its x86 architecture for data centers, including CPUs, AI accelerators, NICs, IPUs and custom ASICs, enabling performance and scalability for cloud, enterprise, telecommunication and HPC environments. The Intel Foundry segment comprises technology development, manufacturing and foundry services, developing new semiconductor process technologies and advanced packaging technologies. All Other segments include Mobileye and Other. It operates in the Technology sector (SEMICONDUCTORS & RELATED DEVICES industry).
Intel Corp is currently not a good buy due to its low RSI of 12.539, indicating oversold conditions, and a significant 14.18% decline over the past five days. While the stock has a strong year-to-date performance of +128.16%, the recent insider selling has increased by 308.41%, which raises concerns about future performance. The forward P/E ratio is high at 63.2911, suggesting that the stock may be overvalued at its current price of $89.85. The main risk is the negative sentiment reflected in the recent market sell-off, particularly impacting semiconductor stocks, as evidenced by the iShares Semiconductor ETF dropping 15% since October 5.
41 analysts cover INTC: 23 rate it Buy, 13 Hold and 5 Sell. The average price target is 39.30.


Intel is up 174% YTD to a $536B cap at 47.5x forward earnings, nearly 4x its historical median. Data center revenue jumped 59% to $6.3B, but Foundry still lost $2.1B last quarter. The turnaround is real. The valuation already paid for it. $INTC
展開
$INTC Chop Scratch Trade Recap Watch the video to learn how to trade this repeatable pattern 🎯
展開本頁僅供研究參考,不構成投資建議。模型可能出錯。過往表現不代表未來結果。