
乐
乐观
乐观 · 25%AAL
$11.94
情景价格
$12.215
+0.106 (+0.87%)收盘时
American Airlines Group Inc. is a holding company. Its primary business activity is the operation of a major network air carrier, providing scheduled air transportation for passengers and cargo through its hubs in Charlotte, Chicago, Dallas/Fort Worth, Los Angeles, Miami, New York, Philadelphia, Phoenix and Washington, D.C. and partner gateways, including in London, Doha, Madrid, Seattle/Tacoma, Sydney and Tokyo, among others. Together with its regional airline subsidiaries and third-party regional carriers operating as American Eagle. Its cargo division provides a wide range of freight and mail services, with facilities and interline connections available across the globe. It operates approximately 1,013 mainline aircraft supported by its regional airline subsidiaries and third-party regional carriers, which together operate an additional 567 regional aircraft. Its subsidiaries include American Airlines, Inc., Envoy Aviation Group Inc., PSA Airlines, Inc. and Piedmont Airlines, Inc.
American Airlines is not a strong buy at the moment due to its current price of $12.11, which is below the average analyst target of $14. Additionally, the RSI is at 43.67, indicating a lack of momentum for a potential upward move. The company is facing significant challenges with a 19.3% revenue growth overshadowed by a $1.9 billion increase in fuel costs, leading to losses. The main risk is the negative sentiment from hedge funds, which have increased their selling by 195.86% over the last quarter.
Wells Fargo
$14
2026-10-06
Wells Fargo
2026-10-06
目标价
$14
BofA
$15
2026-10-05
BofA
2026-10-05
目标价
$15
TD Cowen
$15
2026-10-02
TD Cowen
2026-10-02
目标价
$15
Goldman Sachs
$11
2026-10-02
Goldman Sachs
2026-10-02
目标价
$11
BMO Capital
$19
2026-09-28
BMO Capital
2026-09-28
目标价
$19
情景价格取自当年最后一个月度预测区间。概率为固定的模型权重(25 / 50 / 25),不构成保证。
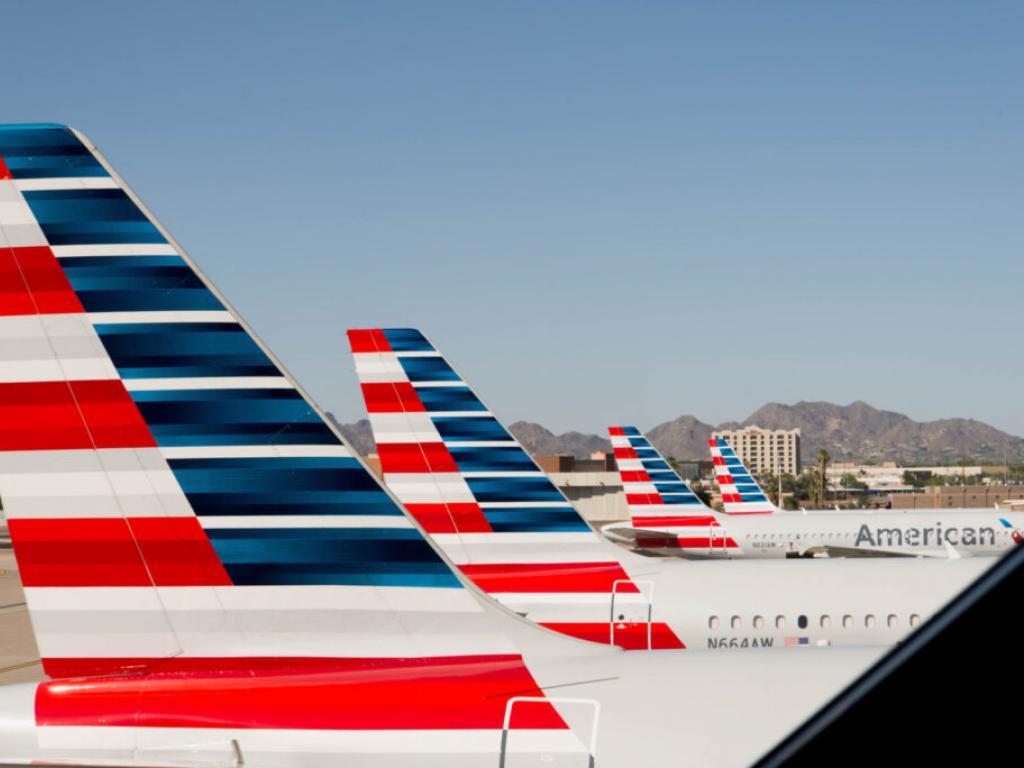
JetBlue Reports Increased Loss Amid Cost-Cutting Plan
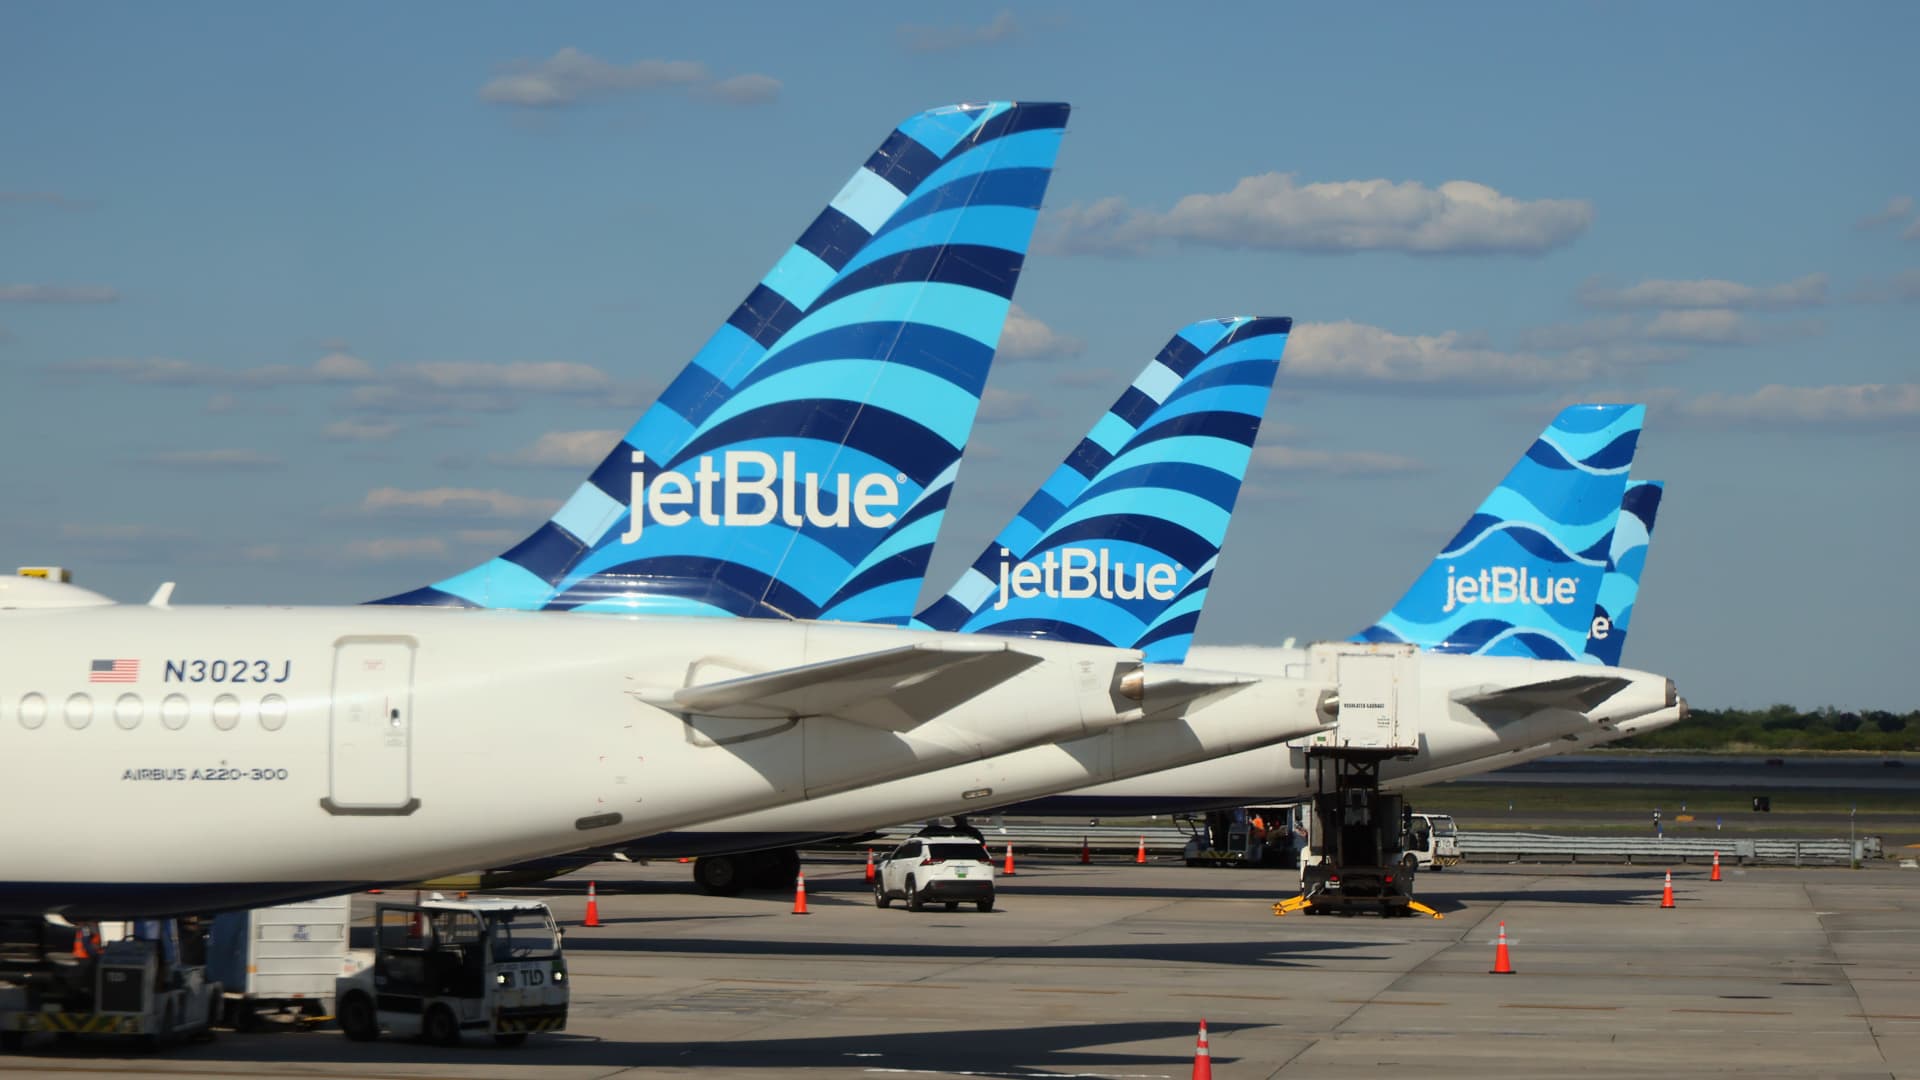
JetBlue Reports Increased Loss Amid Strong Travel Demand
American Airlines Reports 19.3% Revenue Growth in Q3 2026
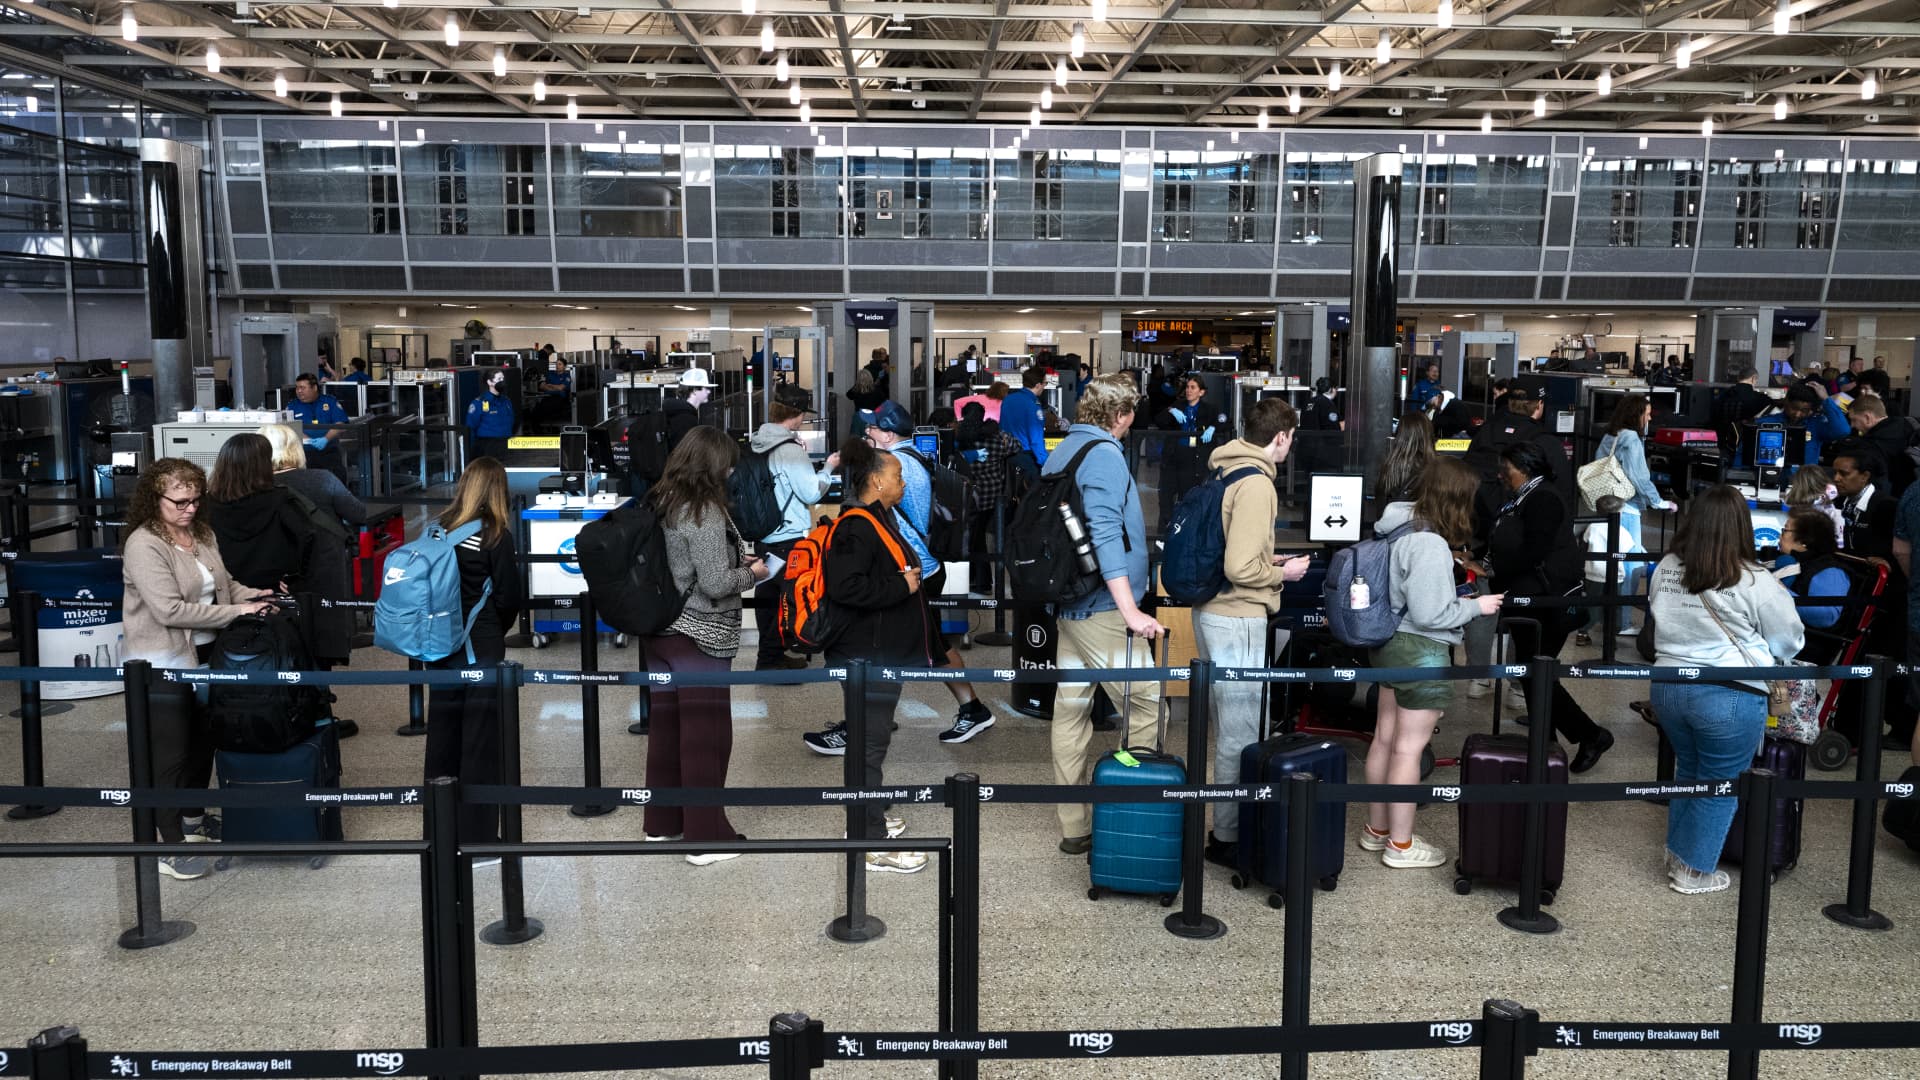
Airlines Prioritize Yield Over Load Factor Amid Rising Fares

Airlines Raise Fares Amid Declining Passenger Numbers
American Airlines Group Inc. is a holding company. Its primary business activity is the operation of a major network air carrier, providing scheduled air transportation for passengers and cargo through its hubs in Charlotte, Chicago, Dallas/Fort Worth, Los Angeles, Miami, New York, Philadelphia, Phoenix and Washington, D.C. and partner gateways, including in London, Doha, Madrid, Seattle/Tacoma, Sydney and Tokyo, among others. Together with its regional airline subsidiaries and third-party regional carriers operating as American Eagle. Its cargo division provides a wide range of freight and mail services, with facilities and interline connections available across the globe. It operates approximately 1,013 mainline aircraft supported by its regional airline subsidiaries and third-party regional carriers, which together operate an additional 567 regional aircraft. Its subsidiaries include American Airlines, Inc., Envoy Aviation Group Inc., PSA Airlines, Inc. and Piedmont Airlines, Inc. It operates in the Industrials sector (AIR TRANSPORTATION, SCHEDULED industry).
American Airlines is not a strong buy at the moment due to its current price of $12.11, which is below the average analyst target of $14. Additionally, the RSI is at 43.67, indicating a lack of momentum for a potential upward move. The company is facing significant challenges with a 19.3% revenue growth overshadowed by a $1.9 billion increase in fuel costs, leading to losses. The main risk is the negative sentiment from hedge funds, which have increased their selling by 195.86% over the last quarter.
18 analysts cover AAL: 9 rate it Buy, 7 Hold and 2 Sell. The average price target is 17.93.

American Airlines, United Airlines, Delta Air Lines, and JetBlue Airways said customers can change their flights for a host of airports in the New York City area, Boston and smaller New England airports, without paying a change fee or difference in fare if they can fly anytime before the middle of next week. The potential weekend disruptions come after an equipment outage on Monday forced carriers to cancel hundreds of flights bound for the New York area and Philadelphia $AAL $UAL $DAL
展开本页仅供研究参考,不构成投资建议。模型可能出错。过往表现不代表未来结果。