
B
Bull
Bull · 25%NDAQ
$93.64
Scenario price
$93.480
-0.804 (-0.86%)At close
Nasdaq, Inc. is a global technology company serving corporate clients, investment managers, banks, brokers, and exchange operators as they navigate and interact with the global capital markets and the broader financial system. The Company manages, operates and provides its products and services in three business segments: Capital Access Platforms, Financial Technology and Market Services. Its Capital Access Platforms segment comprises Data & Listing Services, Index and Workflow & Insights. The Financial Technology segment comprises Financial Crime Management Technology, Regulatory Technology and Capital Markets Technology businesses. Its Market Services segment includes its equity derivative trading and clearing, cash equity trading, fixed income, currency and commodities trading. It operates over 19 exchanges across several asset classes, including derivatives, commodities, cash equity, debt, structured products and exchange-traded products (ETPs).
Nasdaq Inc is a good buy right now due to its current price of $93.65, which is below the average analyst price target of $111.40, indicating potential upside. The stock has a strong recent performance with a 5-day change of +3.68% and a solid RSI of 63.472, suggesting bullish momentum. However, the main risk is the insider selling trend, which has increased by 260.82% over the last month, indicating potential concerns among insiders.
TD Cowen
$107
2026-10-12
TD Cowen
2026-10-12
Price Target
$107
Morgan Stanley
$118
2026-10-09
Morgan Stanley
2026-10-09
Price Target
$118
Raymond James
$109
2026-10-08
Raymond James
2026-10-08
Price Target
$109
Barclays
$109
2026-10-07
Barclays
2026-10-07
Price Target
$109
Piper Sandler
$108
2026-10-02
Piper Sandler
2026-10-02
Price Target
$108
Scenario prices are the last monthly forecast band of the current year. Probabilities are fixed model weights (25 / 50 / 25), not guarantees.

Nasdaq Short Interest Data Update
Tokenization Drives Transformation in Financial Markets

Token2049 Conference Discusses Asset Tokenization
Aapryl Partners with Nasdaq eVestment for Enhanced Analytics

Nasdaq Climbs to #2 in Chartis RiskTech100, Achieving Record Recognition
Nasdaq, Inc. is a global technology company serving corporate clients, investment managers, banks, brokers, and exchange operators as they navigate and interact with the global capital markets and the broader financial system. The Company manages, operates and provides its products and services in three business segments: Capital Access Platforms, Financial Technology and Market Services. Its Capital Access Platforms segment comprises Data & Listing Services, Index and Workflow & Insights. The Financial Technology segment comprises Financial Crime Management Technology, Regulatory Technology and Capital Markets Technology businesses. Its Market Services segment includes its equity derivative trading and clearing, cash equity trading, fixed income, currency and commodities trading. It operates over 19 exchanges across several asset classes, including derivatives, commodities, cash equity, debt, structured products and exchange-traded products (ETPs). It operates in the Financials sector (SECURITY & COMMODITY BROKERS, DEALERS, EXCHANGES & industry).
Nasdaq Inc is a good buy right now due to its current price of $93.65, which is below the average analyst price target of $111.40, indicating potential upside. The stock has a strong recent performance with a 5-day change of +3.68% and a solid RSI of 63.472, suggesting bullish momentum. However, the main risk is the insider selling trend, which has increased by 260.82% over the last month, indicating potential concerns among insiders.
13 analysts cover NDAQ: 6 rate it Buy, 6 Hold and 1 Sell. The average price target is 111.50.

Gold's Big Test | Stock Market Bear Market? Ahead of the U.S. inflation data set to shake the markets, risk-off mode is dominating! Key technical levels for oil, gold, and silver. What do central bank gold purchases and ETF inflows tell us? The fund crisis and bear market risk on the Istanbul Stock Exchange. Support levels to watch for Bitcoin and altcoins. Watch the live stream: #Gold #Silver #StockMarket #Bitcoin #Dollar #Bist100 #Ethereum #Quantfury #FED #nasdaq #spx500 #spx #dxy #US10Y #Rates #TCMB #Oil #Euro #EURUSD
Show more

Retail investor: My colleague says the market is a bubble, and he has been holding cash for 3 years waiting for it to burst. Me: How has that worked out for him? Retail investor: Honestly, every time we talk about it, he seems anxious. Me: Look at that chart. Find every moment someone called it a bubble. 2013, 2015, 2018, 2021, 2023. 2025. All of them. Retail investor: They are all far below where we are now. Me: And every one of those people looked smart for a few months, then stayed wrong for years... Retail investor: So bubbles aren't real? Me: Bubbles are real. In 2000, the Nasdaq $Q fell 75% and took 13 years to recover. That was a real bubble. The P/E ratio was over 100. None of the arrows on this chart come close to that kind of valuation... Retail investor: So what do you do? Me: Never overpay, only buy top companies, keep a position size that can withstand a 50%+ drawdown, get more conservative as the market gets more expensive, and more aggressive as it gets cheaper. Keep it simple, stay patient, & think long term.
Show more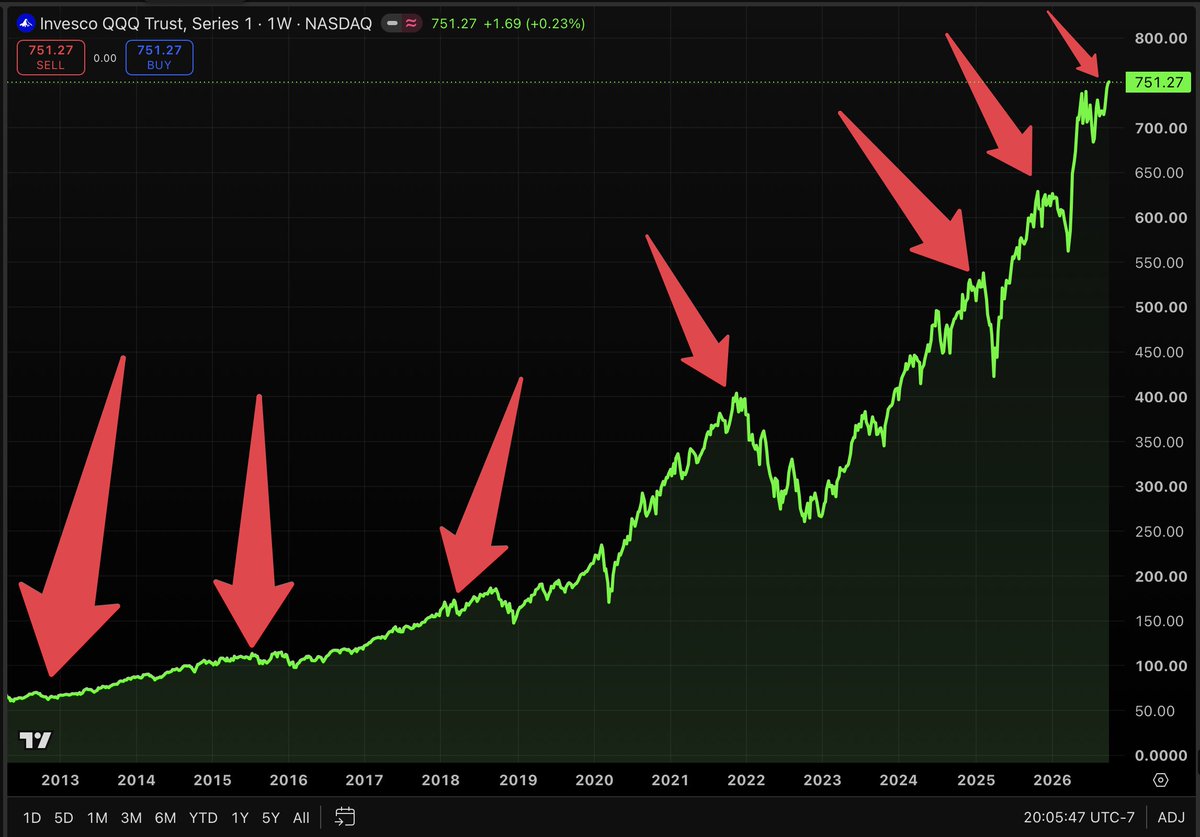

10/10 Left-Left Morning Brief | U.S. stocks rebounded, but inflation pressure has not gone away. U.S. markets closed on 10/9, with the S&P 500 and Nasdaq each up 0.6%; Brent futures first fell and then rose, closing at $104.72. The hurricane caused offshore oil fields to shut down, and supply risks remain. BTC is around 82.6K. Over the weekend, first watch whether it can hold above 83.4K; if it falls back below 81.9K, then withdraw the judgment that the rebound will continue. #Bitcoin #CrudeOil
Show more

#WeeklyCheckIn #WeekendMarketDoYouSeeBullishOrBearish A stock market that never closes sounds more like a crypto narrative until the data starts showing real usage. Tokenized stocks are building a bridge between traditional equities and on-chain markets, but the most important question is no longer whether stocks can be represented on a blockchain. The real test is whether tokenization can create deeper liquidity, genuine ownership, faster settlement, and access outside traditional market hours without sacrificing the rights and protections attached to the underlying securities. The first signal is accessibility. Tokenized stocks can represent fractional exposure to companies like NVIDIA, Apple, and Tesla, letting users trade smaller portions instead of buying a full traditional share. This changes the entry structure of the market, especially for high-priced stocks, while blockchain infrastructure promises to support transfers and settlement with fewer intermediaries. The second signal is time. Traditional U.S. equity markets operate within set trading hours, while on-chain markets can run continuously. Recent market data shows this is becoming more than a theoretical advantage: tokenized stock activity related to Jupiter has expanded rapidly, with tokenized stock holders reportedly reaching about 1.9 million, and roughly 68% of tokenized asset trading volume occurring on weekends or outside traditional market hours. The key takeaway is that off-hours access is becoming a measurable part of demand rather than just a marketing feature. Next comes the most important number: liquidity. Tokenization does not automatically create a liquid market. A token can trade 24/7, but if its pools are shallow, spreads are wide, or liquidity disappears during volatility, then round-the-clock trading offers little practical benefit. So volume, liquidity depth, spreads, holder count, and trade frequency should be tracked together, rather than judging tokenized stocks by price alone. The regulatory structure is also becoming much clearer. On September 17, 2026, the SEC approved a temporary five-year "innovation exemption" allowing qualifying tokenized securities trading venues to trade tokenized NMS stocks within a limited scope. The framework requires qualifying tokenized stocks to preserve the same shareholder rights as the underlying securities, including voting and dividend rights, while synthetic tokens that merely track stock prices fall outside the framework. This matters because not every tokenized stock represents actual equity ownership. SEC guidance from January 2026 clearly distinguishes securities tokenized by or on behalf of the issuer from those tokenized by an unaffiliated third party. So the economic and legal structure behind the token matters more than the ticker shown on a trading interface. There is another important milestone at the infrastructure level. On March 18, 2026, the SEC approved a Nasdaq rule change enabling securities to trade in tokenized form within its exchange framework. The model is designed around existing market infrastructure, preserving the economic attributes and rights of the underlying securities without creating a fully separate synthetic market. This makes the current tokenization narrative more interesting than simply "stocks on a blockchain." Two different paths are now developing at the same time: traditional market infrastructure is integrating tokenized securities, while native crypto markets are building round-the-clock markets for tokenized assets. The long-term direction will depend on how these two systems connect. For Gate Square, the most useful weekend dashboard is therefore simple: tokenized stock trading volume, liquidity depth, holder growth, trade count, price deviation relative to the underlying stock, spreads, and the share of activity occurring outside traditional U.S. market hours. If these numbers continue to grow together, the market is showing real utility. If volume rises while liquidity and holder count remain weak, then the growth may be driven mainly by short-term speculation. The biggest opportunity is not just fractional ownership or 24/7 trading, but the possibility of turning traditionally closed financial infrastructure into programmable, transferable on-chain assets while preserving the legal rights of the underlying securities. But the biggest risk is equally clear: a token that tracks NVIDIA or Apple is not automatically the same as owning shares in NVIDIA or Apple. So tokenized stocks are entering a more important phase. The technology has moved beyond simple experimentation, the regulatory framework is becoming clearer, and market participation is growing quickly. The next measure is no longer how many tokens have been created, but whether liquidity, ownership rights, settlement efficiency, and real trading activity can scale together.
Show more

#USAIConceptStocksRally Yes — but the recent move looks more like a high-beta AI/infrastructure rebound than proof of a durable, broad AI bull market. * The backdrop is supportive: during Thursday's rally, the Nasdaq rose 1.69%, led by semiconductors and AI infrastructure names. AP said the broader advance was helped in part by lower oil prices and a decline in the 10-year U.S. Treasury yield. * AI demand remains a key fundamental support. Analysts cited by MarketWatch argue that even if some frontier model developers slow spending, inference, enterprise AI, and physical AI could still keep infrastructure demand strong. * But the macro backdrop is a major constraint. The 10-year U.S. Treasury yield is around 5%, oil is still above $100, and the Fed has resumed rate hikes. Higher real/nominal yields typically put more pressure on long-duration growth stocks. * Volatility is still high. The AI sector has seen sharp rotation: for example, Arm, AMD, and other chip stocks rebounded earlier this week after a selloff tied to AI spending/safety concerns. * Individual catalysts matter. Arm's rise is tied to market expectations around its new data center CPU and multi-year customer commitments, while Tempus has its own company-specific catalysts involving reimbursement and pricing. What would make this rally more durable? Over the next few weeks, I'll be watching four things: 1. AI capex guidance from Nvidia, hyperscalers, and semiconductor companies. 2. The 10-year U.S. Treasury yield: a sustained move back below 5% would ease some of the pressure on high-growth valuations. 3. Market breadth: whether the advance expands beyond a handful of high-beta AI stocks. 4. Earnings estimate revisions: sustained upward revisions would provide a stronger fundamental base than momentum alone. So the key question is not just "Can AI stocks keep rising?" — they can certainly remain volatile and move higher. The more important test is whether earnings and AI infrastructure demand continue to catch up with stock price expectations. In short, the current evidence supports the possibility that the AI market continues to strengthen, but high yields, expensive growth expectations, oil/inflation risks, and very large single-day swings together mean this rally remains vulnerable to macro and earnings news.
Show more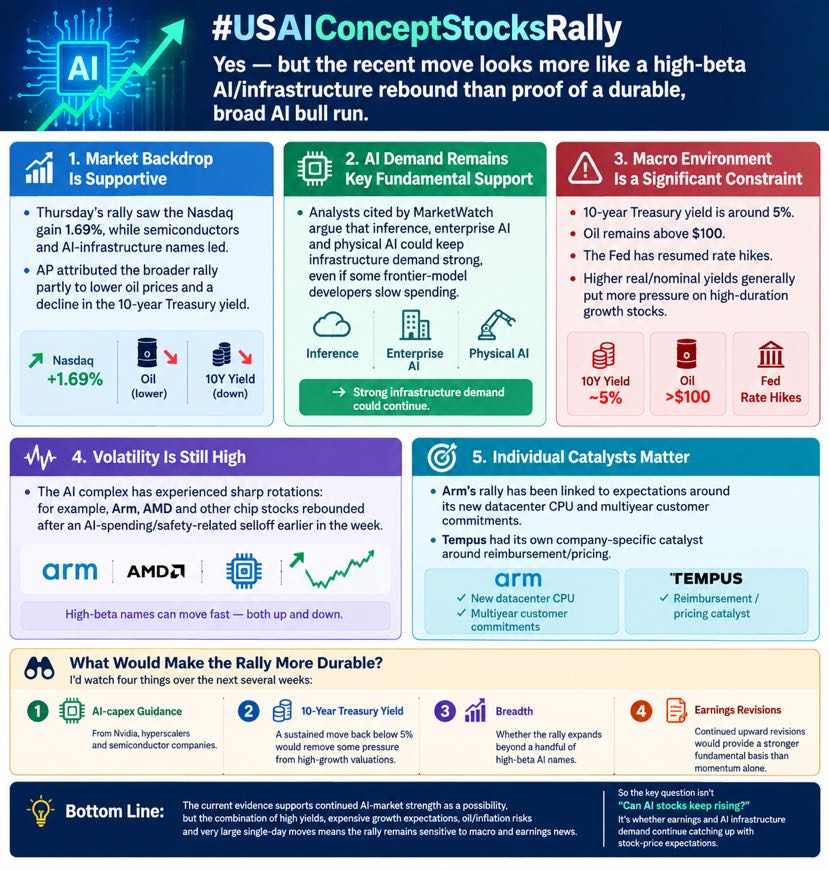
This page is for research only and is not investment advice. Models can be wrong. Past performance does not guarantee future results.