
B
Bull
Bull · 25%SPGI
$559.15
Scenario price
$450.310
-2.792 (-0.62%)At close
S&P Global Inc. provides essential intelligence. The Company's operations consist of four segments: S&P Global Market Intelligence (Market Intelligence), S&P Global Ratings (Ratings), S&P Global Energy (Energy), and S&P Dow Jones Indices (Indices). The Market Intelligence segment is a global provider of multi-asset-class data and analytics integrated with purpose-built workflow solutions. The Ratings segment is an independent provider of credit ratings, research, and analytics. The Energy segment is an independent provider of information and benchmark prices for the energy and commodity markets. Energy segment provides essential price data, analytics, industry insights and software and services, enabling the energy and commodity markets to perform with transparency and efficiency. Indices segment is a global index provider maintaining a wide variety of valuation and index benchmarks for investment advisors, wealth managers and institutional investors.
S&P Global Inc is currently priced at $429.64, which is below the average analyst price target of $525, indicating potential upside. However, the RSI is at 83.65, suggesting it is overbought and could face a pullback. The forward P/E ratio of 19.88 is reasonable, but concerns over the new monetization model may impact future earnings. The main risk is the recent downgrade in price targets, with Morgan Stanley lowering theirs to $477, which could indicate a bearish outlook.
Morgan Stanley
$477
2026-10-07
Morgan Stanley
2026-10-07
Price Target
$477
Wells Fargo
$525
2026-09-02
Wells Fargo
2026-09-02
Price Target
$525
Clear Street
$516
2026-07-29
Clear Street
2026-07-29
Price Target
$516
JPMorgan
$530
2026-07-29
JPMorgan
2026-07-29
Price Target
$530
Barclays
$553
2026-07-29
Barclays
2026-07-29
Price Target
$553
Scenario prices are the last monthly forecast band of the current year. Probabilities are fixed model weights (25 / 50 / 25), not guarantees.

Howard Hughes Holdings to Join S&P SmallCap 600 Index

Howard Hughes Holdings to Replace Arcosa in S&P SmallCap 600
S&P Global Launches Dynamic Data Center Dashboard

S&P Global Launches Interactive North America Data Center Dashboard

S&P SmallCap 600 Index Changes Announced
S&P Global Inc. provides essential intelligence. The Company's operations consist of four segments: S&P Global Market Intelligence (Market Intelligence), S&P Global Ratings (Ratings), S&P Global Energy (Energy), and S&P Dow Jones Indices (Indices). The Market Intelligence segment is a global provider of multi-asset-class data and analytics integrated with purpose-built workflow solutions. The Ratings segment is an independent provider of credit ratings, research, and analytics. The Energy segment is an independent provider of information and benchmark prices for the energy and commodity markets. Energy segment provides essential price data, analytics, industry insights and software and services, enabling the energy and commodity markets to perform with transparency and efficiency. Indices segment is a global index provider maintaining a wide variety of valuation and index benchmarks for investment advisors, wealth managers and institutional investors. It operates in the Industrials sector (SERVICES-CONSUMER CREDIT REPORTING, COLLECTION AGE industry).
S&P Global Inc is currently priced at $429.64, which is below the average analyst price target of $525, indicating potential upside. However, the RSI is at 83.65, suggesting it is overbought and could face a pullback. The forward P/E ratio of 19.88 is reasonable, but concerns over the new monetization model may impact future earnings. The main risk is the recent downgrade in price targets, with Morgan Stanley lowering theirs to $477, which could indicate a bearish outlook.
15 analysts cover SPGI: 11 rate it Buy, 4 Hold and 0 Sell. The average price target is 617.77.

#WeeklyPost #WCTCS9 Key financial events to watch next week 2026-10-19 (Monday) 10:00 China Q3 GDP, September industrial output, fixed asset investment, retail sales 22:00 US October NAHB housing market index 2026-10-20 (Tuesday) 09:15 China October LPR quote 17:00 Eurozone October ZEW economic sentiment index 20:30 US September housing starts, building permits 22:00 US September pending home sales MoM NVIDIA GTC conference (10.20–10.22) 2026-10-21 (Wednesday) 16:00 UK September CPI YoY 22:30 US EIA crude oil inventories for the week to October 16 After US market close: Tesla, Meta earnings 2026-10-22 (Thursday) 09:00 Bank of Korea rate decision 17:00 Eurozone October consumer confidence preliminary 20:00 US 20-year Treasury auction 2026-10-23 (Friday) 07:30 Japan September CPI 16:00 Eurozone October manufacturing and services PMI preliminary 20:00 Russia central bank rate decision 22:00 US October University of Michigan consumer confidence and inflation expectations, US S&P Global PMI Quick take: next week's calendar looks fairly quiet. Apart from the US consumer confidence index, there are no major data releases, and the Fed has entered its blackout period ahead of the policy meeting, so the impact on markets is likely limited. The biggest variable is the US-Iran situation, which could significantly affect oil prices as well as US equities and crypto. Worth keeping an eye on.
Show more

S&P Global has officially announced the acquisition of OpenZeppelin, whose contract library has supported over $37 trillion in cumulative transfers. On Thursday, the ratings giant brought the "standard for on-chain audits" in-house. The amount was not disclosed, OpenZeppelin will continue to operate independently, and CEO Demian Brener will stay on. Simply put: institutions used to look first at reserves when assessing stablecoins, and now they also look at whether the code foundation is reliable. In my view: this is traditional finance buying a "ruler for technical risk," not proof that smart contracts will be漏洞-free from now on. What I do: separate "being endorsed by a ratings agency" from "the protocol itself being secure." The invalidation condition is if the acquisition takes too long to close, or if it is only brand labeling without truly issuing assessment standards. Do you trust more that "institutional entry will raise security standards," or that "auditors being absorbed by big players will instead concentrate risk"? $SPGI $ETH $USDT#加密安全 #机构入场
Show more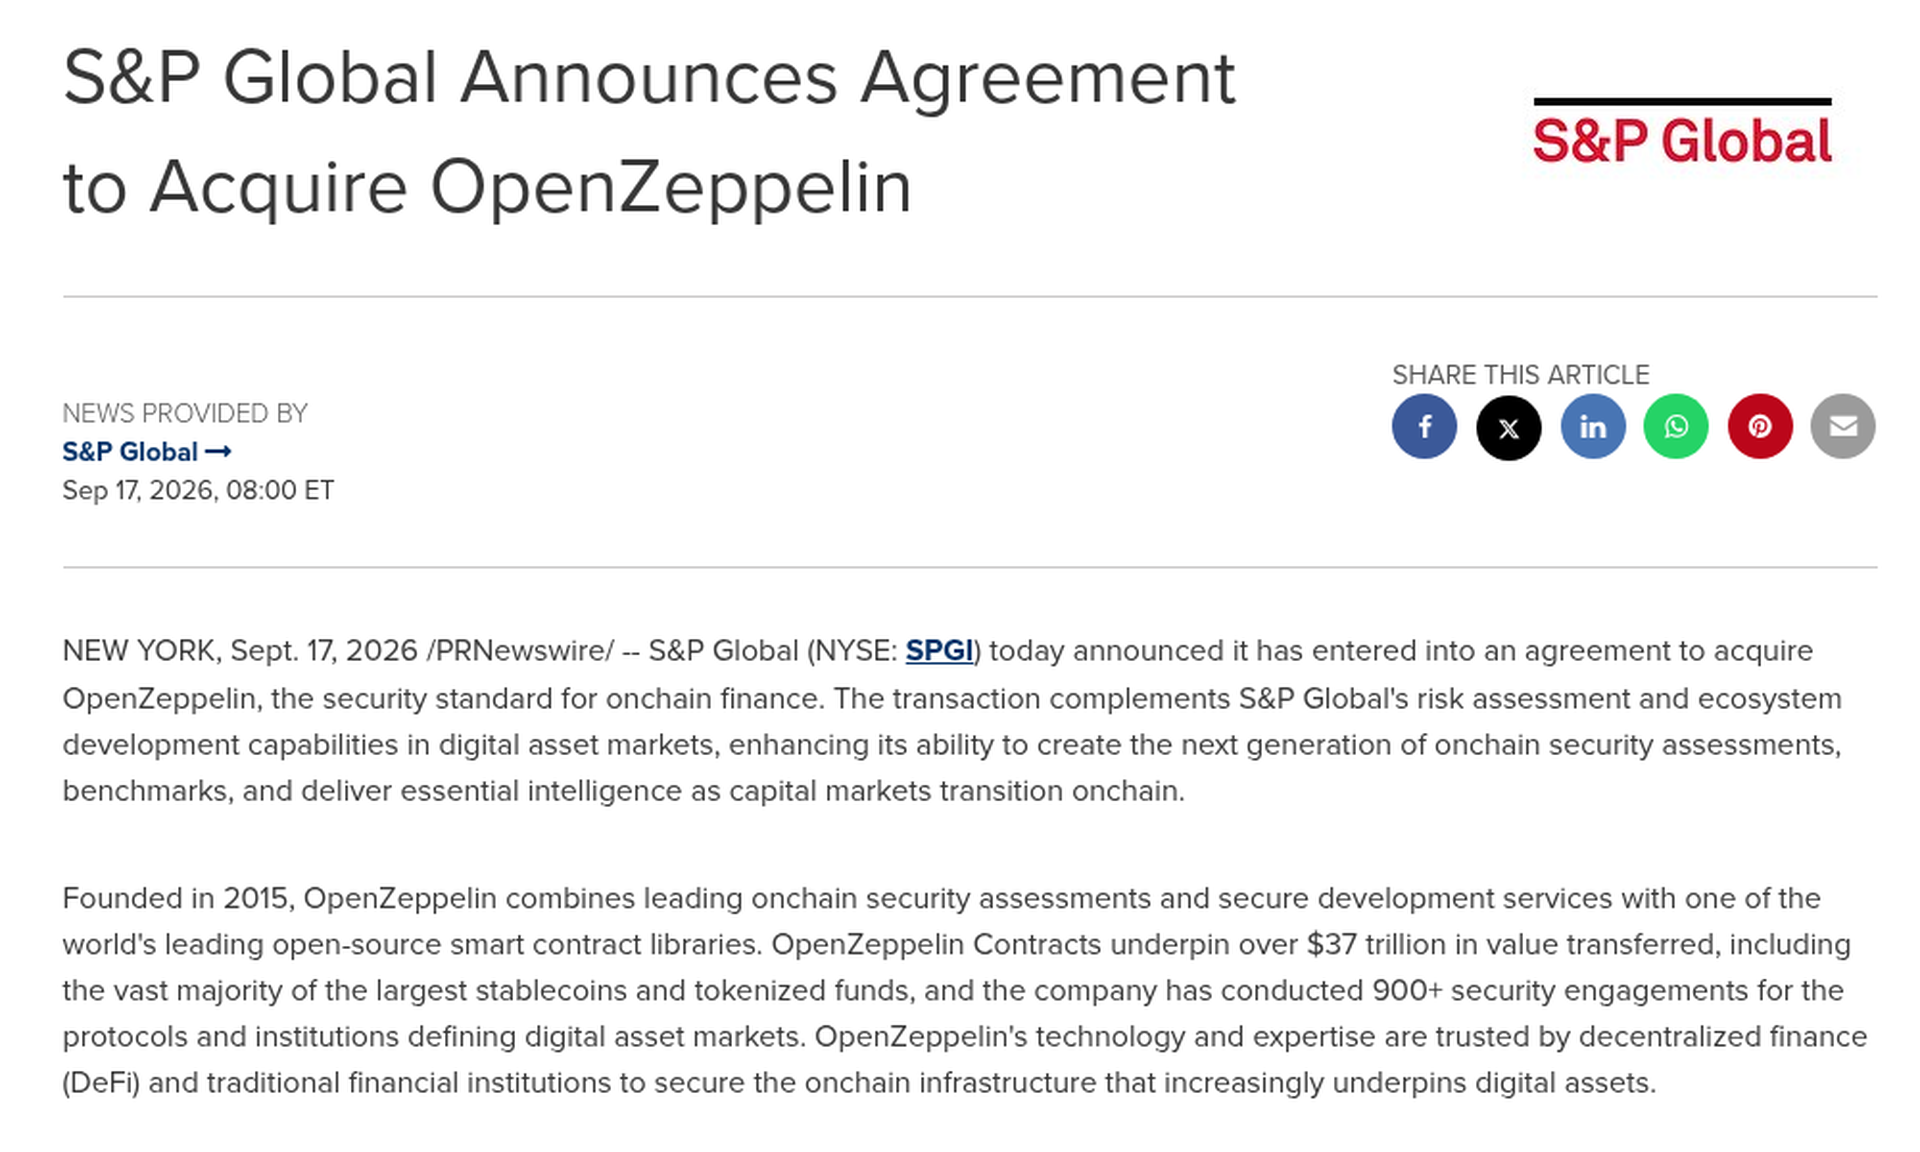
This page is for research only and is not investment advice. Models can be wrong. Past performance does not guarantee future results.