B
Bull
Bull · 25%MSCI
$642.21
Scenario price
$575.090
+14.952 (+2.60%)At close
MSCI Inc. (MSCI) is a provider of critical decision support tools and solutions for the global investment community. The Company operates through four segments: Index, Analytics, ESG and Climate, and All Other-Private Assets. The Index segment offers products, such as MSCI Global Equity Indexes, ESG and Climate Indexes, Factor Indexes, Thematic Indexes, Client-Designed Indexes, Fixed Income Indexes and Real Assets Indexes. The Analytics segment offers risk management, performance attribution and portfolio management content, applications and services. Its ESG and Climate segment offerings include MSCI ESG Ratings, MSCI ESG Business Involvement Screening Research, and MSCI Climate Solutions. The Company's All Other-Private Assets segment comprises the Real Assets segment and Private Capital Solutions segment. The Real Assets segment offers data, benchmarks, return-analytics, climate assessments and market insights for tangible assets such as real estate and infrastructure.
MSCI Inc is currently priced at $565.12, which is below several analyst price targets, including $715 from BofA and $722 from Evercore ISI. However, the RSI is at 71.192, indicating that the stock is overbought, which could lead to a price correction. The recent insider selling has increased by 2249.35%, indicating potential concerns among insiders about the stock's future performance. Given these mixed signals, it is advisable to hold rather than buy at this time.
BofA
$715
2026-07-23
BofA
2026-07-23
Price Target
$715
JPMorgan
$700
2026-07-22
JPMorgan
2026-07-22
Price Target
$700
Clear Street
$615
2026-07-22
Clear Street
2026-07-22
Price Target
$615
Wells Fargo
$690
2026-07-22
Wells Fargo
2026-07-22
Price Target
$690
Morgan Stanley
$700
2026-07-21
Morgan Stanley
2026-07-21
Price Target
$700
Scenario prices are the last monthly forecast band of the current year. Probabilities are fixed model weights (25 / 50 / 25), not guarantees.

MSCI Launches SignalLab Platform to Integrate Investment Signals
MSCI to Release Q3 2026 Financial Results on October 20
Active ETFs Gain Traction as Advisers Seek Value and Fit
71% of Advisers Plan to Increase Active ETF Usage

Turkey Tightens Regulations on Hedge Funds Amid Market Concerns
MSCI Inc. (MSCI) is a provider of critical decision support tools and solutions for the global investment community. The Company operates through four segments: Index, Analytics, ESG and Climate, and All Other-Private Assets. The Index segment offers products, such as MSCI Global Equity Indexes, ESG and Climate Indexes, Factor Indexes, Thematic Indexes, Client-Designed Indexes, Fixed Income Indexes and Real Assets Indexes. The Analytics segment offers risk management, performance attribution and portfolio management content, applications and services. Its ESG and Climate segment offerings include MSCI ESG Ratings, MSCI ESG Business Involvement Screening Research, and MSCI Climate Solutions. The Company's All Other-Private Assets segment comprises the Real Assets segment and Private Capital Solutions segment. The Real Assets segment offers data, benchmarks, return-analytics, climate assessments and market insights for tangible assets such as real estate and infrastructure. It operates in the Industrials sector (SERVICES-BUSINESS SERVICES, NEC industry).
MSCI Inc is currently priced at $565.12, which is below several analyst price targets, including $715 from BofA and $722 from Evercore ISI. However, the RSI is at 71.192, indicating that the stock is overbought, which could lead to a price correction. The recent insider selling has increased by 2249.35%, indicating potential concerns among insiders about the stock's future performance. Given these mixed signals, it is advisable to hold rather than buy at this time.
10 analysts cover MSCI: 4 rate it Buy, 6 Hold and 0 Sell. The average price target is 648.88.

MSCI adopted new rules that could lead to Strategy being removed from its global indexes. On Thursday (Oct 15), MSCI said it will classify "non-operating companies" as ineligible for inclusion in its global investable market indexes. The rule will apply starting from the November 2026 review and take effect at the close on Nov 30. Strategy (MSTR), Metaplanet, and Upexi were previously placed on the proposed removal list, while SharpLink, Ton Strategy, Solana Company, and DeFi Development were placed on the watch list. A company is ineligible if it fails four of five financial ratio tests; however, existing index constituents will only be removed after failing the tests for two consecutive annual review periods. MSCI will announce the final list on Nov 11. Funds tracking these indexes hold about 13M shares of MSTR, roughly 3.1% of Strategy's common stock. JPMorgan previously estimated that a removal could trigger about $2.8B in selling, but that estimate was based on MSCI's earlier proposal.
Show more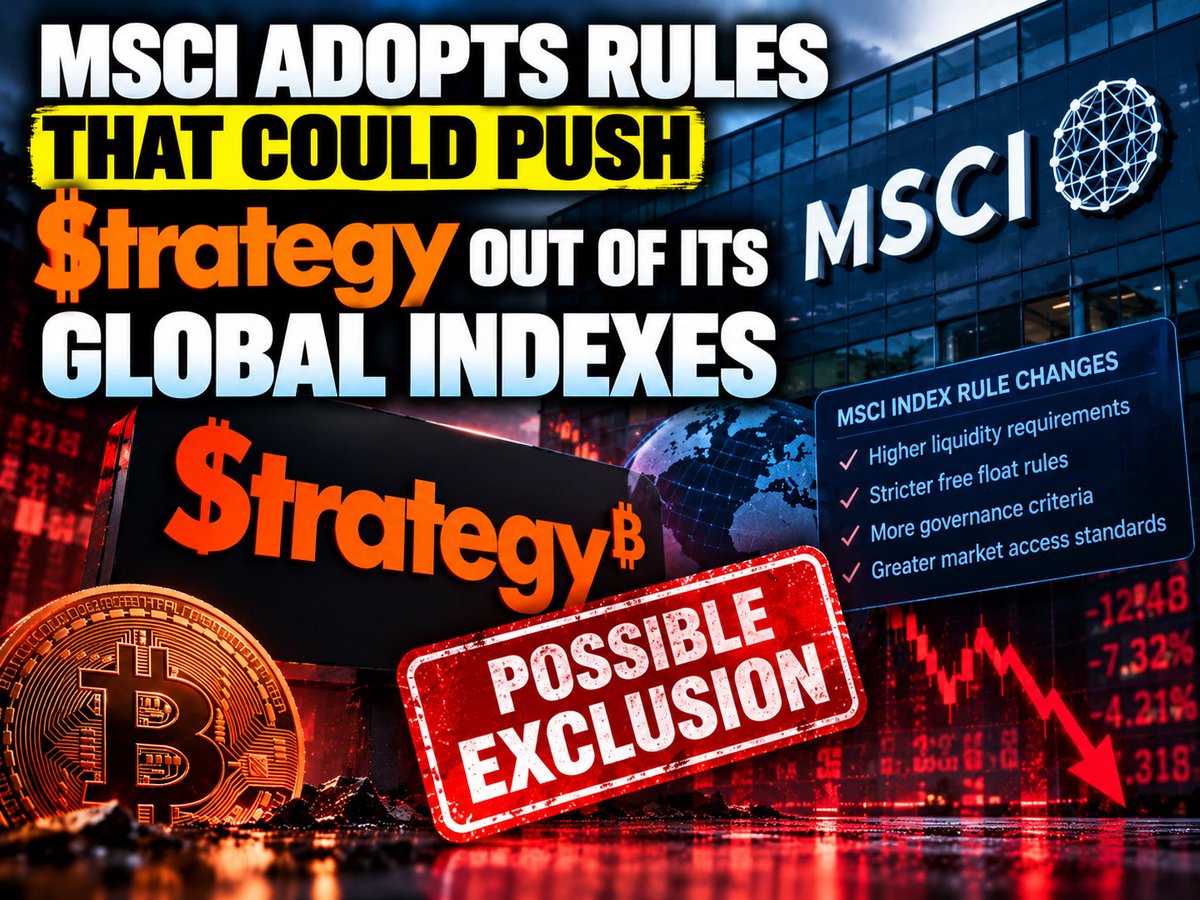


$SKHYNIX #WillYouBuyDipInKoreanStocks 📉 Korean stocks fell as macro pressure outweighed sector optimism. The KOSPI dropped more than 3.6% to close at 6,384.25, its lowest level in two months. Foreign investors net sold KRW 2 trillion ($14.9 billion) worth of KOSPI constituents, marking a fifth straight session of outflows; institutions sold about KRW 1.67 trillion. Samsung Electronics fell more than 4.3%, and SK Hynix dropped 4.52%, leading declines among large-cap semiconductor stocks. ⚖️ Divergence: sector fundamentals versus market sentiment. Samsung's preliminary third-quarter data showed strong memory and HBM demand, with revenue of about $145.7 billion and operating profit of $80.3 billion. Yet the positive data has not translated into share price support. The market instead appears focused on external headwinds: rising oil prices, high US Treasury yields, and broad concerns about AI-related spending and its returns. The direct trigger was a reassessment of AI revenue expectations, which hit semiconductor sentiment hard. 📊 Domestic picture: a chip-driven economy with structural gaps. Semiconductors now account for about 32.8% of Korea's total exports, up from 8.7% in early 2021. August semiconductor exports reached a record $46.65 billion, up 209% year-on-year, driven by HBM and server DRAM demand. The Bank of Korea raised its 2026 GDP growth forecast to 3.3%, citing strong chip exports, and lifted its benchmark rate to 3% after consecutive hikes in July and August. However, the export boom has not translated into broad domestic growth. Retail sales fell 0.4% in the most recent month, after a 0.5% decline the month before. Despite a large trade surplus, the won has weakened and consumer spending remains subdued. Foreign investor selling in September led to $19.2 billion in net outflows from emerging market equity funds, with Korea accounting for a significant share. 🌍 Global angle: Korea as a bellwether. Korean equities carry a high weight in the MSCI Emerging Markets Asia Index, and their decline dragged the broader index down 0.8% to its lowest level since mid-September. The AI-driven memory supercycle has sharply boosted Korean stocks over the past year, but that concentration now amplifies downside moves. Global investors are watching Korea as a test case: if AI demand is truly durable, the memory cycle should hold. If not, this export-driven growth model faces a tougher readjustment. Key variables this week are US CPI and PPI data, with an FOMC meeting later this month. These macro releases will shape risk appetite across emerging markets, including Korea. When strong exports coexist with domestic weakness, how would you weigh the two? 👇 #WillYouBuyDipInKoreanStocks #KoreanStocks #Macro #Semiconductors Not financial advice.
Show more
This page is for research only and is not investment advice. Models can be wrong. Past performance does not guarantee future results.