
B
Bull
Bull · 25%MET
$105.18
Scenario price
$100.760
+0.494 (+0.49%)At close
MetLife, Inc. is a financial services company, providing insurance, annuities, employee benefits and asset management to individual and institutional customers. Its segments include Group Benefits; Retirement and Income Solutions (RIS); Asia; Latin America; Europe, the Middle East and Africa (EMEA); and MetLife Holdings. Group Benefits segment offers life insurance, dental, group short- and long-term disability, paid family and medical leave, individual disability, accidental death and dismemberment insurance, accident and health insurance, and vision, as well as prepaid legal plans and pet insurance. RIS segment provides funding and financing solutions that help institutional customers mitigate and manage liabilities primarily associated with their employee benefit programs using a spectrum of life and annuity-based insurance and investment products. It operates across EMEA in both developed (Western Europe) and emerging (Central and Eastern Europe, Middle East and Africa) markets.
MetLife Inc is a good buy right now due to its current price of $100.76, which is below the average analyst price target of $110, suggesting a potential upside of 9.5%. Additionally, the forward P/E ratio of 10.54 indicates that the stock is undervalued compared to its earnings potential. However, the RSI of 71.31 indicates that the stock is nearing overbought territory, which could pose a risk of a short-term pullback.
Mizuho
$109
2026-10-07
Mizuho
2026-10-07
Price Target
$109
Barclays
$111
2026-10-07
Barclays
2026-10-07
Price Target
$111
UBS
$110
2026-10-06
UBS
2026-10-06
Price Target
$110
TD Cowen
$110
2026-10-05
TD Cowen
2026-10-05
Price Target
$110
Piper Sandler
$110
2026-09-22
Piper Sandler
2026-09-22
Price Target
$110
Scenario prices are the last monthly forecast band of the current year. Probabilities are fixed model weights (25 / 50 / 25), not guarantees.

Michael Burry Warns of Market Risks Ahead

Pension Risk Transfer Solutions Continue to Grow
MetLife Declares Q4 2026 Dividend of $0.5925
Octane Expands Partnership with Institutional Investors in $1.4 Billion Transaction

Burry Adjusts Portfolio to Mitigate Tax Pressures
MetLife, Inc. is a financial services company, providing insurance, annuities, employee benefits and asset management to individual and institutional customers. Its segments include Group Benefits; Retirement and Income Solutions (RIS); Asia; Latin America; Europe, the Middle East and Africa (EMEA); and MetLife Holdings. Group Benefits segment offers life insurance, dental, group short- and long-term disability, paid family and medical leave, individual disability, accidental death and dismemberment insurance, accident and health insurance, and vision, as well as prepaid legal plans and pet insurance. RIS segment provides funding and financing solutions that help institutional customers mitigate and manage liabilities primarily associated with their employee benefit programs using a spectrum of life and annuity-based insurance and investment products. It operates across EMEA in both developed (Western Europe) and emerging (Central and Eastern Europe, Middle East and Africa) markets. It operates in the Financials sector (LIFE INSURANCE industry).
MetLife Inc is a good buy right now due to its current price of $100.76, which is below the average analyst price target of $110, suggesting a potential upside of 9.5%. Additionally, the forward P/E ratio of 10.54 indicates that the stock is undervalued compared to its earnings potential. However, the RSI of 71.31 indicates that the stock is nearing overbought territory, which could pose a risk of a short-term pullback.
16 analysts cover MET: 9 rate it Buy, 6 Hold and 1 Sell. The average price target is 95.25.

September CPI is about to be released, and Hammack says further rate hikes may still be needed. Ugh, funds are starting to pull back, and it feels awful. $BTC has had a short position open for a long time. Why does the price just refuse to fall below 80K? Earlier it dropped to 80400 and rebounded to over 83000. This time it fell to 80800 and quickly rebounded to almost 84000. It just will not go down. Will it keep rising? Planning to add to the short position at 84800. $MET has already locked in 12 points of profit. After previously spiking to 0.54, the price has been falling continuously. Open interest has dropped a lot, and the long-short ratio is currently 1.08. Longs and shorts are still battling, and there may be more downside ahead. $ENA has also locked in 12 points. Planning to take profit at 20 points before exiting. The unlock from the end of last month feels like it has not finished distributing yet. There should be another wave of decline later. Continuing to hold.
Show more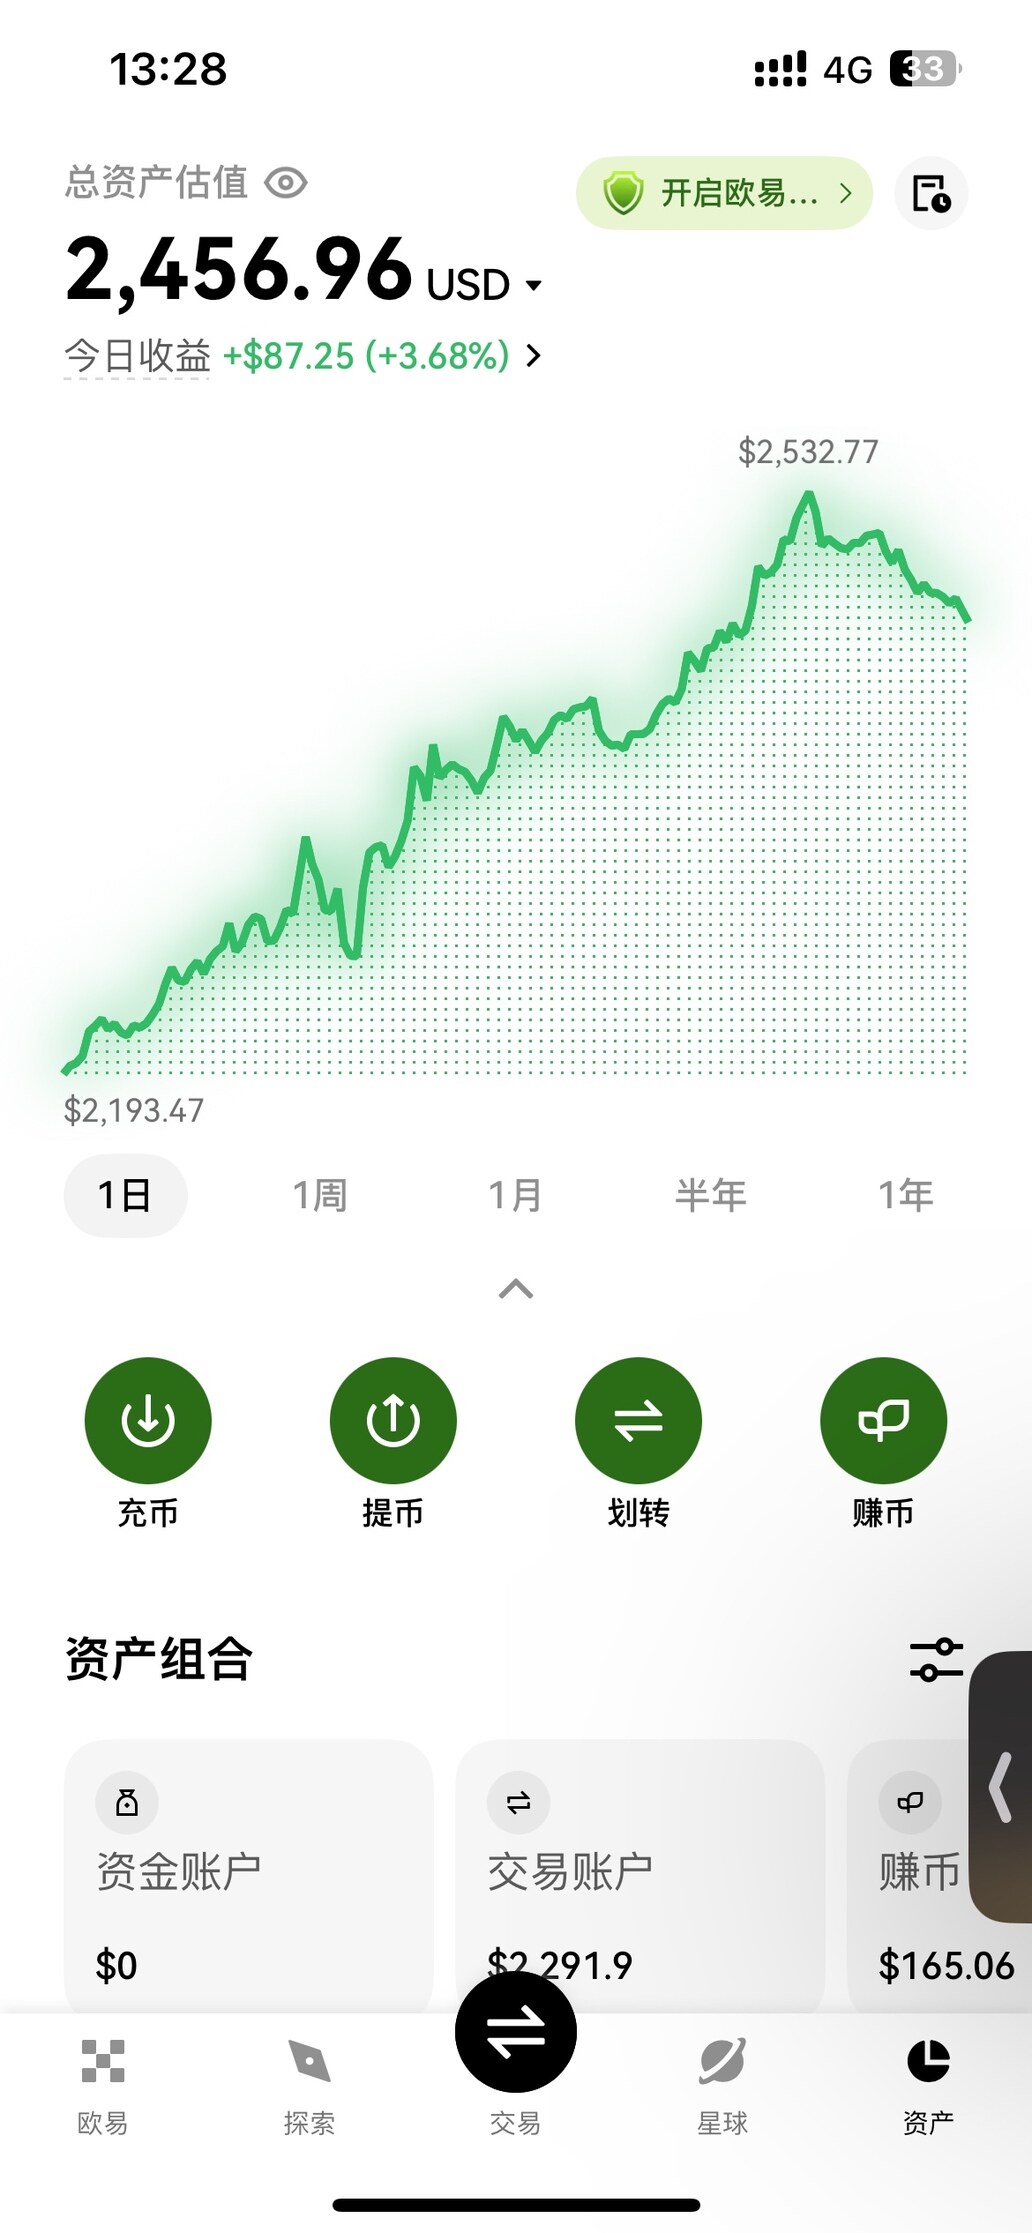

$MET 🔥 The chart has been grinding lower with occasional bounces and some choppy action, but we're focused on the overall trend and not letting short-term swings throw off our rhythm. Thanks to everyone who's been sharing ideas and reviewing the setup together along the way. Stay clear-headed when the market moves, stay humble when profits come, and let's keep improving our trading awareness. 🤝
Show more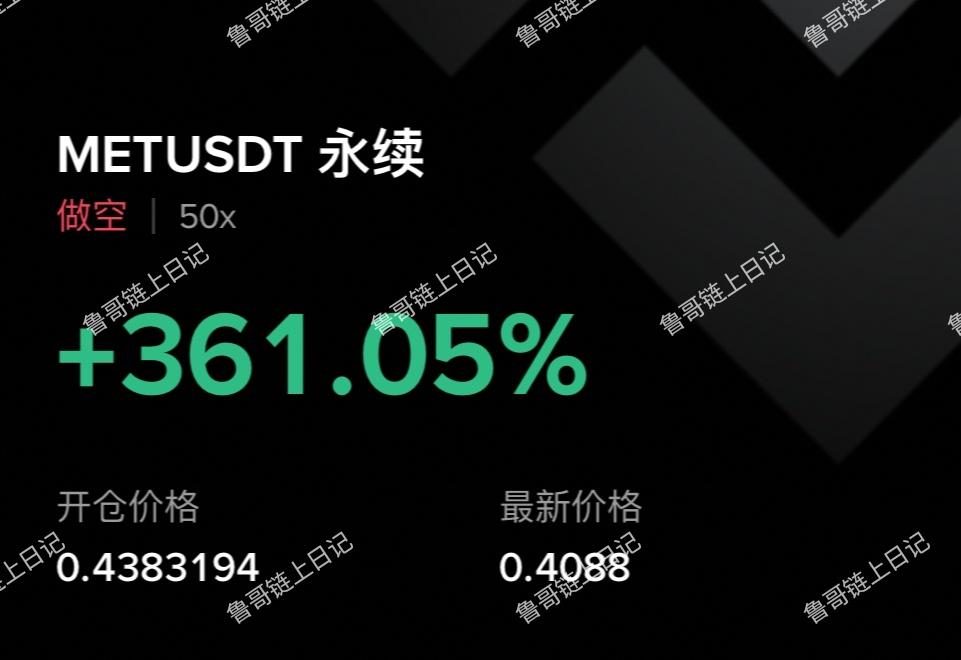

Many people rush to buy the dip when price falls to the lower Bollinger Band, but they overlook one precondition: lower-band support only works when the trend is healthy. The most direct way to judge whether a trend is healthy is to check whether moving averages and momentum are aligned. Take $MET as an example. The current price is 0.4062, MA5=0.40782 has crossed below MA20=0.414155, and the short-term average is under the long-term average, which is a bearish alignment. At the same time, the MACD histogram is -0.00013, momentum is still on the bearish side, and RSI=41.6 is in the neutral-to-weak zone, suggesting this decline is not oversold exhaustion but trend continuation. The lower Bollinger Band at 0.399421 is a short-term reference, but before the moving averages flatten, support can easily be tested repeatedly. Notably, the funding rate is -0.0105%, meaning shorts pay longs, which suggests bearish sentiment is somewhat crowded and a rebound repair is possible. In terms of action, I lean toward following the trend short after a rebound rather than chasing the decline. Entry reference: 0.4090-0.4140, the resistance zone between MA5 and MA20 on a pullback. Take-profit 1: 0.3994 (lower Bollinger Band). Take-profit 2: 0.3900 (previous low extension). Stop-loss: above 0.4210, near the middle Bollinger Band; if price holds above it, the bearish logic is invalidated. The Fear & Greed Index at 64 is still in the greed zone, meaning the overall market is not panicked and rebound strength may be limited. Also watch: $RAD, among which $RAD closed higher against the trend with bullish moving average alignment, showing relative strength clearly stronger than $GTC and $MET. (Personal view only, for reference only, and not investment advice. Futures risk is extremely high, please strictly control position size.) Data: Pair: METUSDT Direction: Short Entry: 0.4090-0.4140 Take-profit 1: 0.3994 Take-profit 2: 0.3900 Stop-loss: 0.4210
Show more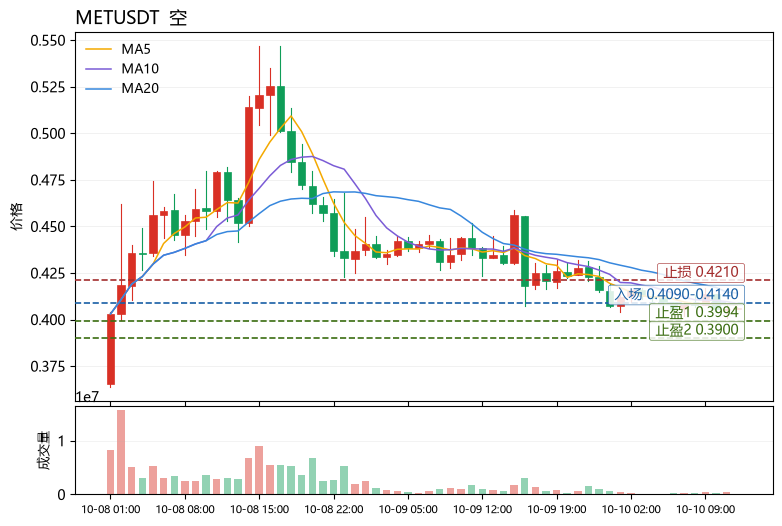

Middle East geopolitical tensions remain high. Will the decline continue? Yesterday's drop in $BTC was mainly driven by the recent 30-year U.S. Treasury yield approaching 5.7% and the 10-year yield around 5.3%, with rising expectations of another rate hike this year, while oil prices and inflation pressures are picking up again, adding multiple macro headwinds Meanwhile, three U.S. aircraft carriers will gradually arrive in the Middle East, the Pentagon has prepared a three-day strike plan, and combined with hurricane impacts, international oil prices $BZ will rise further, expanding the downside risk for the crypto market Currently $BTC $ETH have stopped falling and rebounded slightly Over the past 24 hours BTC liquidations totaled $300 million, mainly long positions at $270 million ETH liquidations totaled $350 million, mainly long positions at $290 million ZEC saw a larger plunge, with liquidations of $45.375 million, mainly long positions at $40.845 million For now, watch whether the 80K level holds. A break below would open the way to 78K-75K MET initial short position, after adding on unrealized gains I was stopped out. It currently cannot break 0.42 and is ranging. There may be another rally before continuing lower, with a high around 0.45-0.46 #BTCSpotETFSeesLargestSingleDayNetOutflowInNearlyThreeAndAHalfMonths
Show more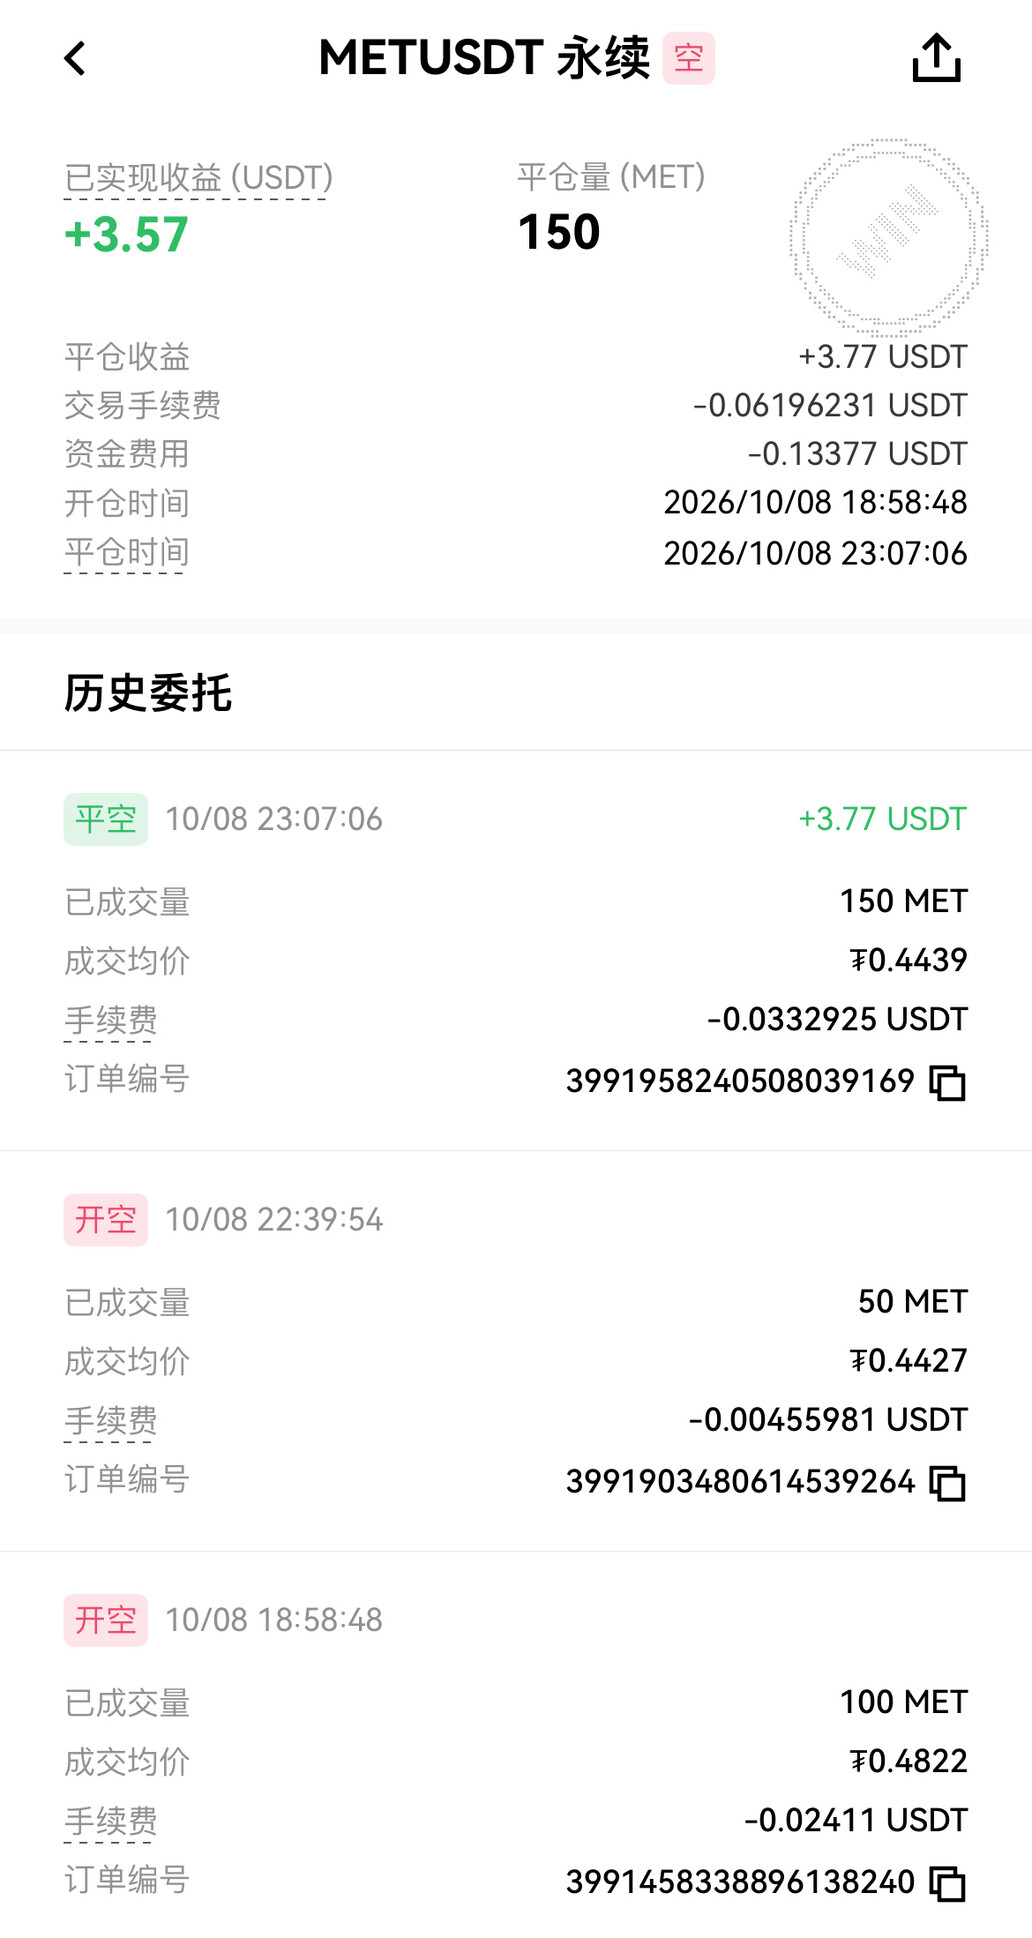

Can't hold it together anymore, guys. Hurry up and drop, you two. Stop pretending here. The final outcome is always a fall. $MET clearly can't go up. Still not dropping fast enough. Let me profit a bit more. $SAND, even though I already exited, I'm still bearish on this coin. Shorting these pumped altcoins into the ground. #OKX2049CheckIn #ETFStillInflowingWhyIsBTCDropping #SeptemberFOMCMinutesReleasedMostOfficialsLeanTowardAnotherRateHike
Show more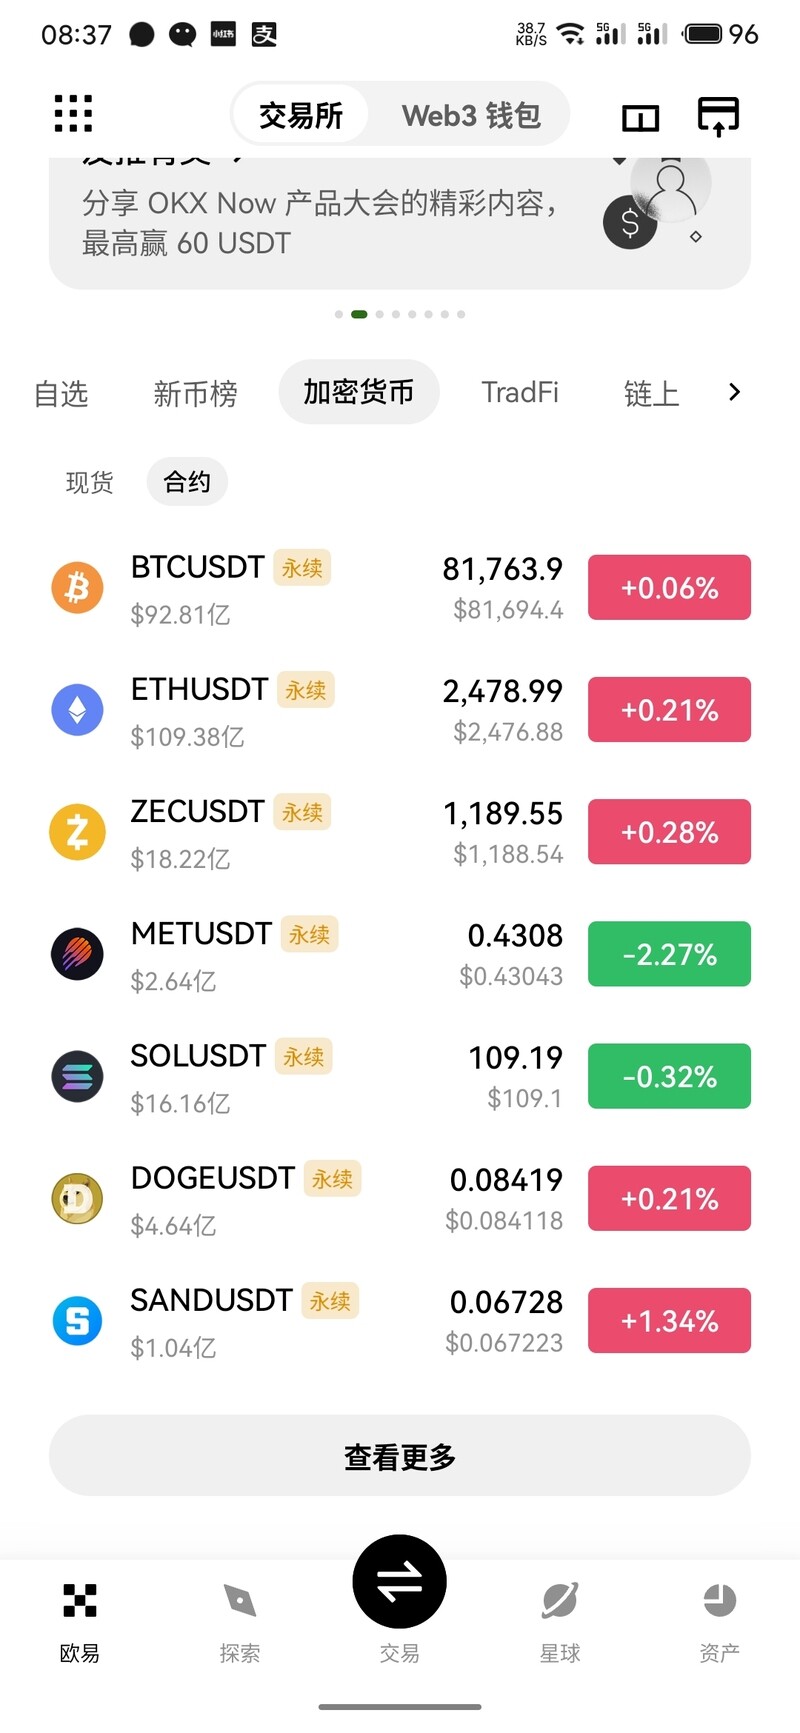
This page is for research only and is not investment advice. Models can be wrong. Past performance does not guarantee future results.