B
Bull
Bull · 25%ALL
$236.22
Scenario price
$247.880
+8.577 (+3.46%)At close
The Allstate Corporation protects people from life's uncertainties with an array of protection for autos, homes, electronic devices and identity theft. The Company's products are available through Allstate agents, independent agents, major retailers, online and at the workplace. Its Allstate Protection segment offers private passenger auto, homeowners and other property insurance in the United States and Canada. Its Run-off Property-Liability segment includes property and casualty insurance coverage. The Company’s Protection Services segment comprises protection plans, roadside, dealer services, identity protection and arity. Protection Services also provides consumer product protection plans, device and mobile data collection services and analytic solutions using automotive telematics information, roadside assistance, protection and insurance products and identity protection and restoration through Allstate Protection Plans, Allstate Dealer Services, Allstate Roadside, and others.
Allstate Corp appears to be a good buy right now due to its current price of $229.43, which is below the analyst price target of $266, indicating potential upside. Additionally, the company has a strong forward P/E ratio of 8.27 and a solid gross margin of 17.59%, reflecting its profitability. However, a risk to consider is the downgrade from Barclays, lowering the price target to $221, which suggests potential downside.
BofA
$340
2026-10-12
BofA
2026-10-12
Price Target
$340
Keefe Bruyette
$232
2026-10-12
Keefe Bruyette
2026-10-12
Price Target
$232
Wells Fargo
$236
2026-10-12
Wells Fargo
2026-10-12
Price Target
$236
Mizuho
$295
2026-10-07
Mizuho
2026-10-07
Price Target
$295
HSBC
$266
2026-10-07
HSBC
2026-10-07
Price Target
$266
Scenario prices are the last monthly forecast band of the current year. Probabilities are fixed model weights (25 / 50 / 25), not guarantees.

Boeing Board Restructuring Boosts Confidence

Allstate Offers Hurricane Recovery Support to Customers
Latest Wall Street Rating Updates

Allstate's Auto Lab Enhances Claims Adjuster Training

Allstate's Auto Lab Enhances Claims Adjuster Training
The Allstate Corporation protects people from life's uncertainties with an array of protection for autos, homes, electronic devices and identity theft. The Company's products are available through Allstate agents, independent agents, major retailers, online and at the workplace. Its Allstate Protection segment offers private passenger auto, homeowners and other property insurance in the United States and Canada. Its Run-off Property-Liability segment includes property and casualty insurance coverage. The Company’s Protection Services segment comprises protection plans, roadside, dealer services, identity protection and arity. Protection Services also provides consumer product protection plans, device and mobile data collection services and analytic solutions using automotive telematics information, roadside assistance, protection and insurance products and identity protection and restoration through Allstate Protection Plans, Allstate Dealer Services, Allstate Roadside, and others. It operates in the Financials sector (FIRE, MARINE & CASUALTY INSURANCE industry).
Allstate Corp appears to be a good buy right now due to its current price of $229.43, which is below the analyst price target of $266, indicating potential upside. Additionally, the company has a strong forward P/E ratio of 8.27 and a solid gross margin of 17.59%, reflecting its profitability. However, a risk to consider is the downgrade from Barclays, lowering the price target to $221, which suggests potential downside.
20 analysts cover ALL: 11 rate it Buy, 7 Hold and 2 Sell. The average price target is 239.64.

$DOGE is at 0.08731, up only +0.08% over 24h, with 70.3M USDT in volume and about 8.03% amplitude across the last 30 candles. On the moving averages, MA5=0.087134 has moved above MA20=0.0858725, so the short-term structure leans bullish; the MACD histogram at +0.0002737 remains positive, so bullish momentum has not faded; but RSI=56.9 is only mildly strong, not overbought. Bollinger Bands are [0.0838531, 0.0878919], and price is running close to the upper band at 0.0878919, which is a strong zone but raises chase risk. Funding rate is +0.0100%, long positioning is slightly crowded; Fear & Greed Index is 71, the market is in a greedy state, and sentiment supports following the trend, not heavy chasing. View: short-term bias is bullish, but I prefer entering on a pullback to the moving averages rather than chasing at the upper band. Entry reference is 0.0862–0.0868, a zone close to MA5 and above the Bollinger midline, making it a pullback confirmation area. Take-profit 1 is 0.0879, the Bollinger upper-band resistance; take-profit 2 is 0.0892, an extension target after a breakout above the upper band. Stop-loss is 0.0855; if price breaks below MA20 and the MACD histogram weakens, the bullish logic is invalidated. If price breaks 0.0879 directly on volume and holds, that can be treated as a second entry signal, but position size should be halved. Also watching: $ALL and $EPIC, with RSI around 58.2 and 70.4 respectively; $EPIC is relatively stronger but has entered a heated zone. (Personal view only, for reference only, not investment advice. Futures risk is extremely high, please strictly control position size.) [Data] Pair: DOGEUSDT Direction: Long Entry: 0.0862–0.0868 Take-profit 1: 0.0879 Take-profit 2: 0.0892 Stop-loss: 0.0855
Show more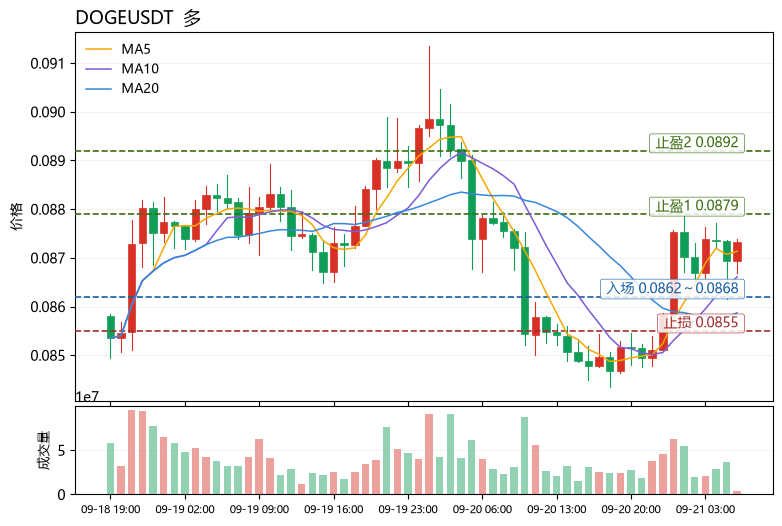

$LSK Key levels first: below, 0.3693 is the lower Bollinger Band; above, 0.3840 is MA5; higher up, 0.4004 is MA20. Current price is 0.3743, down 16.49% in 24h, with turnover of only 14.0M USDT, which is a low-volume sharp drop. On the macro side, the Fear & Greed Index at 71 is still in the greed zone, but the broader market is not offering a broad rally benefit, and capital is leaning more toward rotation than broad long exposure. LSK's decline is not an isolated case. $DAS fell 7.07% over the same period, with RSI at 28.5, also oversold, showing this is not a single-coin issue but overall pressure on the altcoin sector. If BTC cannot hold steady, mid- and low-cap coins like this will find it hard to strengthen independently. Technically, MA5 at 0.384 has crossed below MA20 at 0.4004, a bearish alignment; RSI at 32.4 is near oversold but has not broken below 30; the MACD histogram at -0.001621 remains negative, and momentum has not repaired. The only mildly bullish signal is the funding rate at -0.1093%, with shorts clearly paying, leaving room for a short squeeze. The Bollinger Bands at 0.3693–0.4314 are wide, and the 30-candle amplitude is 25.06%, indicating high volatility risk. Directionally, I lean short. A rebound into the 0.380–0.386 zone facing pressure could be an entry for a short, as that zone overlaps with MA5 and prior dense trading volume. Take-profit 1 is 0.3693 (lower Bollinger Band), take-profit 2 is 0.3600 (oversold extension level). Stop-loss is 0.4010; if price reclaims MA20, the bearish thesis is invalidated. Also watch: $DASH, $ALL. The former is similarly oversold and weak, while the latter has RSI at 73.6 and is strengthening against the trend, showing clear divergence within the sector. (Personal view, for reference only, not any investment advice. Futures risk is extremely high, please strictly control position size.) [Data] Pair: LSKUSDT Direction: Short Entry: 0.380-0.386 Take-profit 1: 0.3693 Take-profit 2: 0.3600 Stop-loss: 0.4010
Show more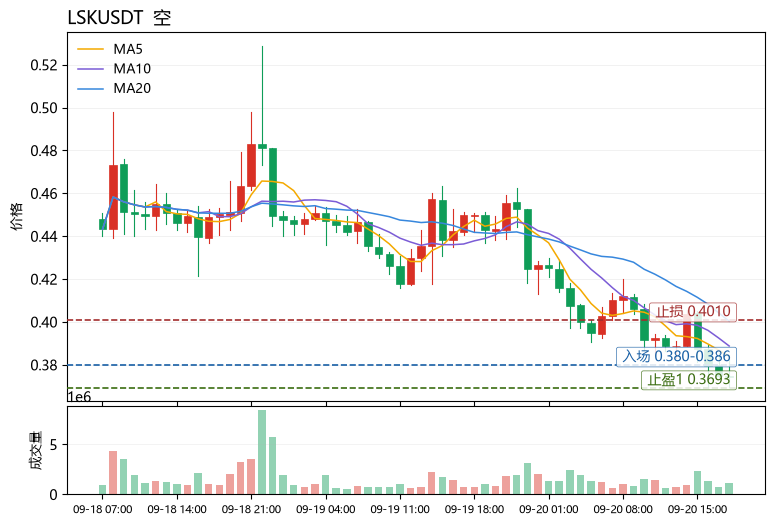

This page is for research only and is not investment advice. Models can be wrong. Past performance does not guarantee future results.