B
Bull
Bull · 25%INTC
$18.42
Scenario price
$98.120
-4.474 (-4.56%)At close
Intel Corporation is a global designer and manufacturer of semiconductor products. The Company's segments include Intel Products, Intel Foundry, and All Other. Its Intel Products comprise Client Computing Group (CCG) and Data Center and AI (DCAI). CCG delivers platforms and processors that power PCs and edge devices, enabling enhanced performance, connectivity and user experience for consumer and commercial markets with capabilities that also support retail, industrial robotics and AI ecosystems at the edge. DCAI delivers workload-optimized solutions based upon its x86 architecture for data centers, including CPUs, AI accelerators, NICs, IPUs and custom ASICs, enabling performance and scalability for cloud, enterprise, telecommunication and HPC environments. The Intel Foundry segment comprises technology development, manufacturing and foundry services, developing new semiconductor process technologies and advanced packaging technologies. All Other segments include Mobileye and Other.
Intel Corp is currently a hold due to its recent price drop to $104.70, which is significantly below the analyst price target of $145 from Tigress Financial. The stock has seen a year-to-date increase of 165.87%, but the RSI is at a low 24.032, indicating potential oversold conditions. However, insider selling has increased by 308.41%, which raises concerns about the stock's short-term outlook. The main risk is the potential decline to the $85 to $89 range if revenue growth does not meet expectations, as indicated by market sentiment.
Mizuho
$114
2026-10-06
Mizuho
2026-10-06
Price Target
$114
Tigress Financial
$145
2026-09-15
Tigress Financial
2026-09-15
Price Target
$145
Piper Sandler
$110
2026-09-09
Piper Sandler
2026-09-09
Price Target
$110
Northland
$120
2026-09-08
Northland
2026-09-08
Price Target
$120
Mizuho
$92
2026-09-04
Mizuho
2026-09-04
Price Target
$92
Scenario prices are the last monthly forecast band of the current year. Probabilities are fixed model weights (25 / 50 / 25), not guarantees.
Intel's Stock Rebounds but Lags Behind Market Performance
Intel Shares Drop After Explosion at Israeli Plant

Inflation Pressures Mount, Market Reacts Sharply
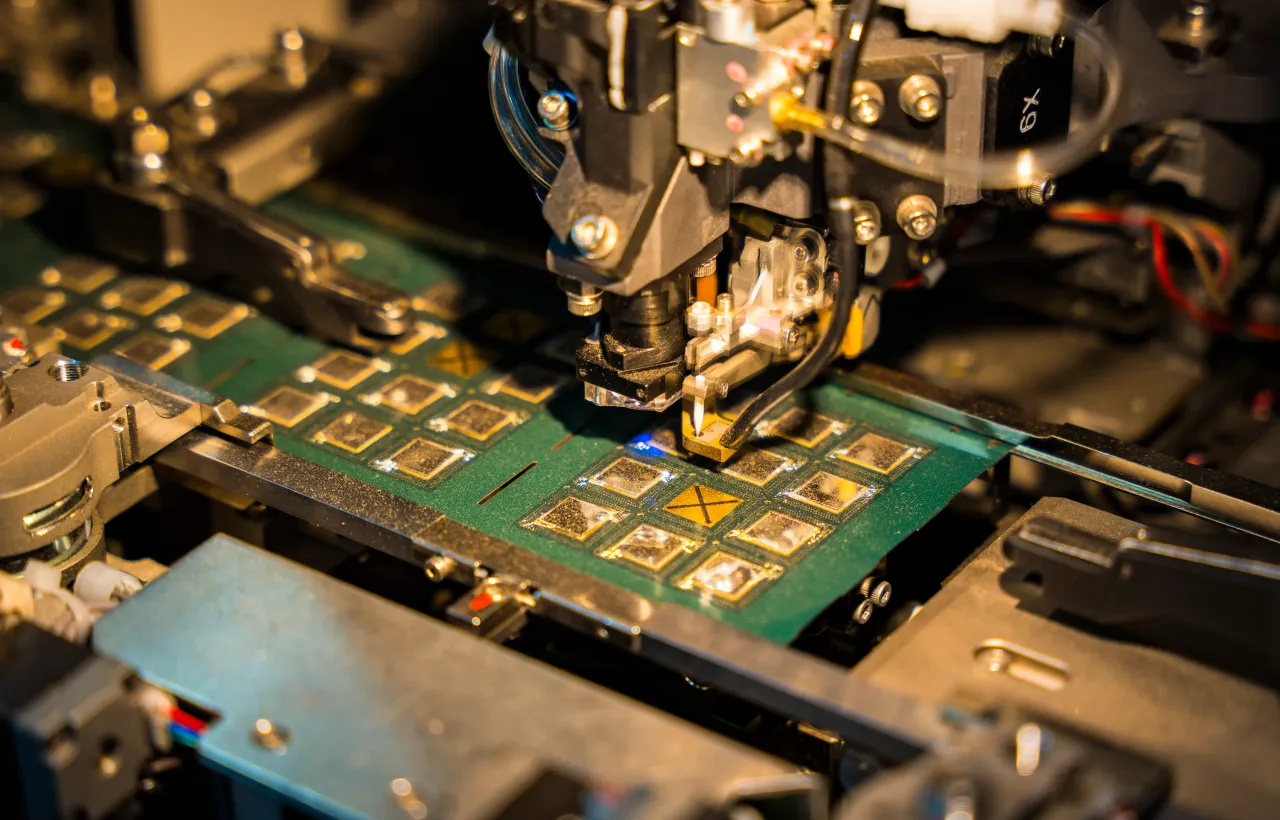
U.S. Inflation Intensifies Pressure on Chip Stocks
Intel Shares Surge 180% Amid AI Demand
Intel Corporation is a global designer and manufacturer of semiconductor products. The Company's segments include Intel Products, Intel Foundry, and All Other. Its Intel Products comprise Client Computing Group (CCG) and Data Center and AI (DCAI). CCG delivers platforms and processors that power PCs and edge devices, enabling enhanced performance, connectivity and user experience for consumer and commercial markets with capabilities that also support retail, industrial robotics and AI ecosystems at the edge. DCAI delivers workload-optimized solutions based upon its x86 architecture for data centers, including CPUs, AI accelerators, NICs, IPUs and custom ASICs, enabling performance and scalability for cloud, enterprise, telecommunication and HPC environments. The Intel Foundry segment comprises technology development, manufacturing and foundry services, developing new semiconductor process technologies and advanced packaging technologies. All Other segments include Mobileye and Other. It operates in the Technology sector (SEMICONDUCTORS & RELATED DEVICES industry).
Intel Corp is currently a hold due to its recent price drop to $104.70, which is significantly below the analyst price target of $145 from Tigress Financial. The stock has seen a year-to-date increase of 165.87%, but the RSI is at a low 24.032, indicating potential oversold conditions. However, insider selling has increased by 308.41%, which raises concerns about the stock's short-term outlook. The main risk is the potential decline to the $85 to $89 range if revenue growth does not meet expectations, as indicated by market sentiment.
41 analysts cover INTC: 23 rate it Buy, 13 Hold and 5 Sell. The average price target is 39.30.


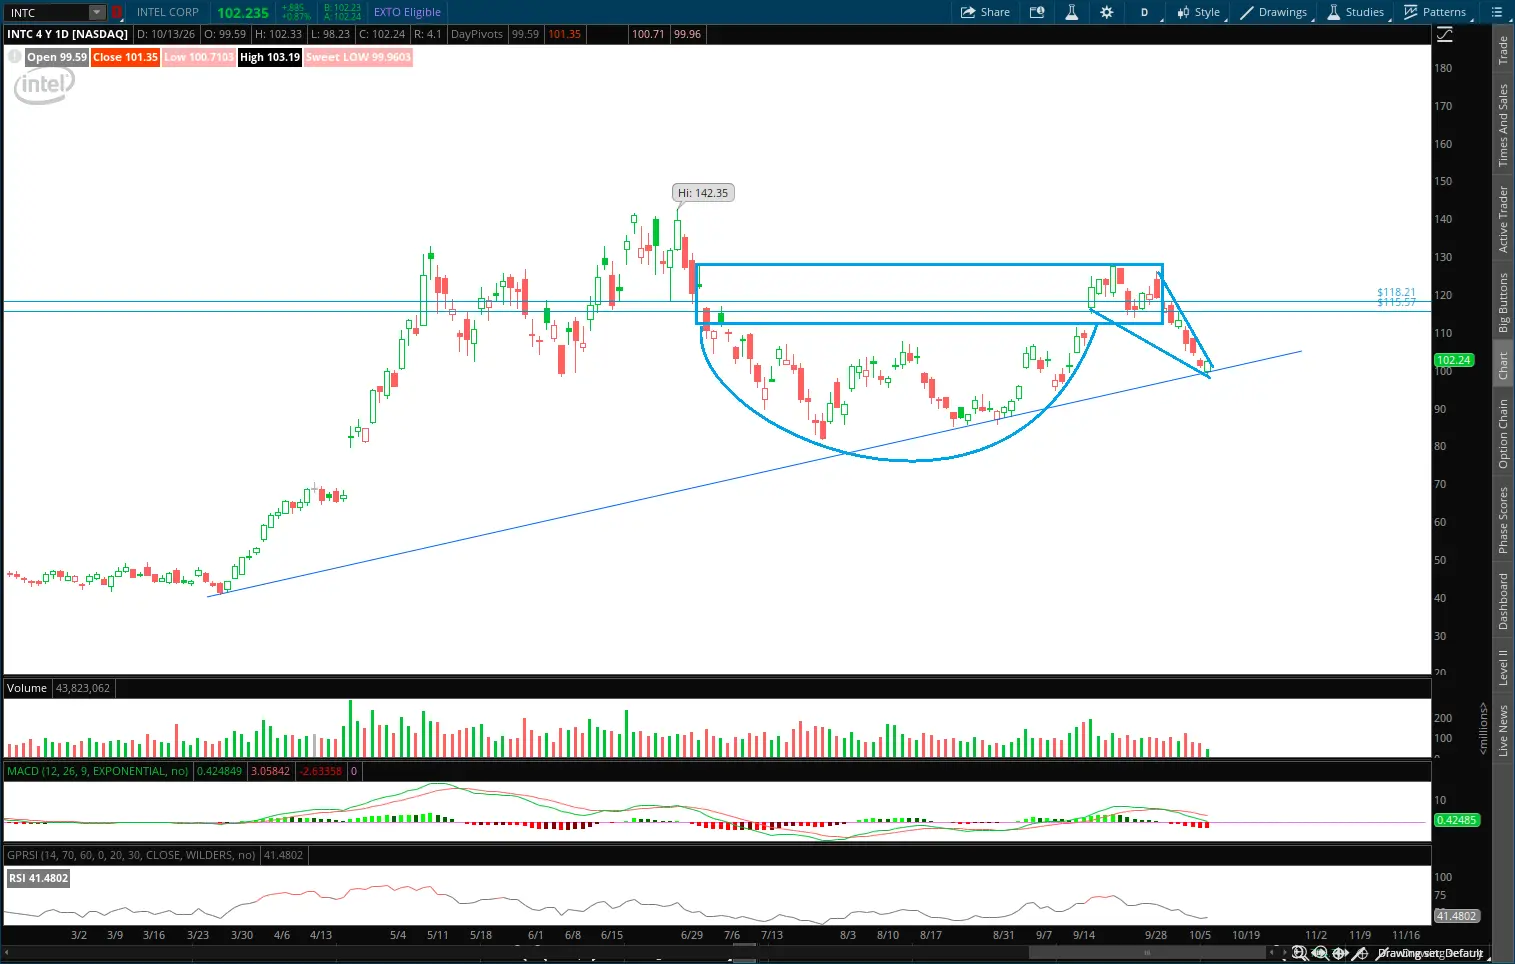
$rINTC Intel (INTC/USDT) on Bitget: Reading the Chop Between $105 and $110 If you've been watching the INTC/USDT chart on Bitget lately, you know it's been a bit of a rollercoaster. Currently sitting around 107.98, we're seeing a classic tug-of-war between the bears and the bulls. Let me break down the structure I'm seeing across the 4H, 1H, and 15m timeframes. To understand the complete market situation right now, we have to look at three distinct zones. First, we have the major support shelf at 105.24 — this is the line in the sand that bulls absolutely must defend; if this breaks, the structural floor falls out. Second, we have the immediate battleground zone between 107 and 108.50, where price is currently consolidating and fighting for directional clarity. Finally, we have the heavy resistance cluster up at 110.60 to 114.26, where the SuperTrend and upper Bollinger Bands are capping any upside momentum. So, how do we approach this? I'm looking at three specific scenarios based on price action and volume: Scenario 1: The Bullish Reclaim (Breakout) If we see a high-volume 1H or 4H candle close above 108.50, I'm looking for a momentum push toward the 110.60 resistance. If the bulls can flip that level into support, the next target is the 114.26 SuperTrend zone. In this case, I'd be looking for long setups on the retest of the breakout. Scenario 2: The Range Chop (Consolidation) Given the mixed signals on the 15m and 1H charts (with the SAR flipping and Bollinger Bands pinching), the most likely scenario is continued chop. If price stays trapped between 106.70 and 108.50, I'm sitting on my hands. This is where retail gets chopped up. I'd wait for a deviation — a fakeout above 108.50 or a sweep of 106.70 — before entering a scalp. Scenario 3: The Bearish Breakdown (Continuation) If the selling pressure resumes and we lose the 105.24 support on a closing basis, the bearish trend is confirmed. In this case, I'm looking for a retest of the breakdown zone to short, targeting lower lows. The lack of strong volume on the recent bounce attempts suggests the bears aren't done yet. My Verdict: Right now, the chart is objectively neutral-to-bearish until we reclaim 108.50. The 4H SuperTrend is still red, and the 1H Bollinger Bands are wide, suggesting volatility is still present. I'm waiting for a decisive close. Stay patient, manage your risk, and let the chart come to you. $INTC
Show more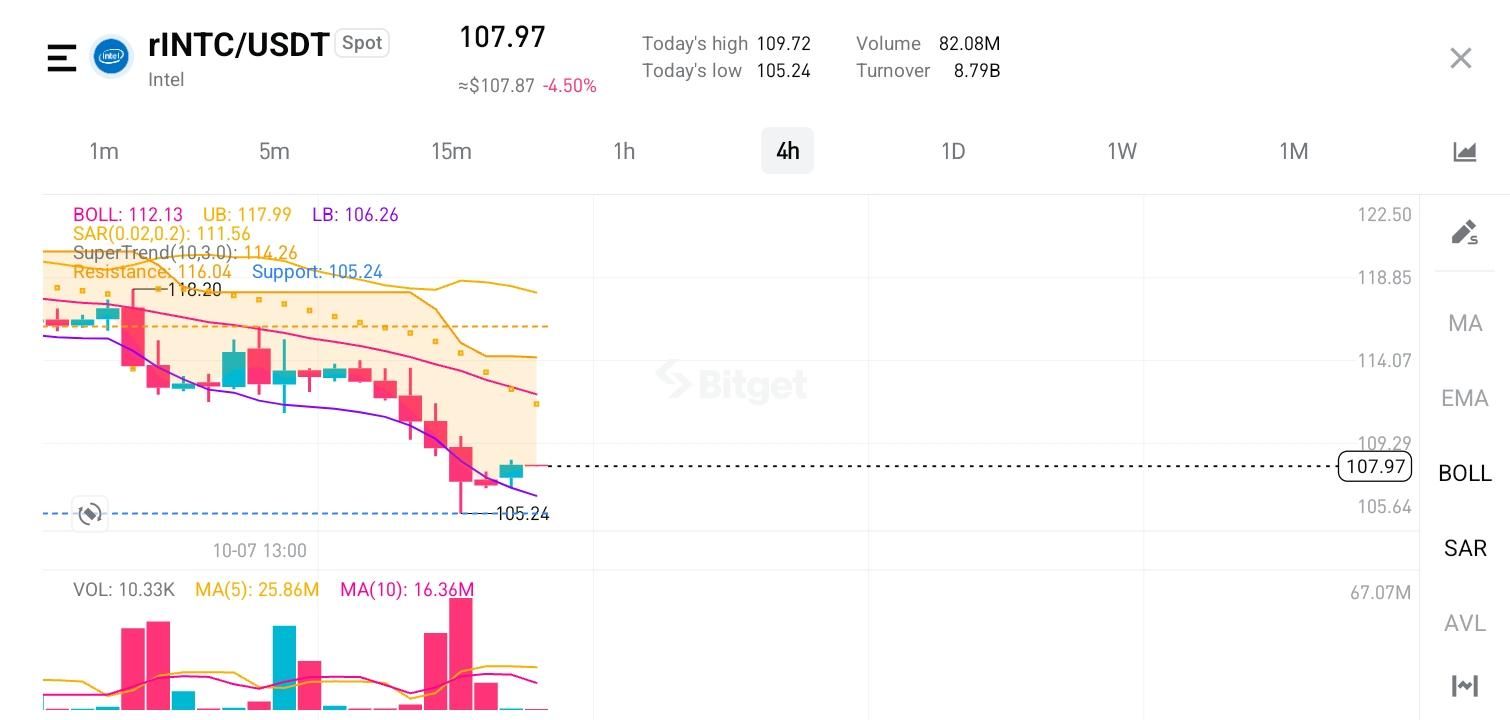

$INTC The sell signal for me was that bearish engulfing candle after a move into negative momentum. Now this sits on the 21-day (orange line), which is also called the pivot line. Stocks sometimes use this line as a pivot, either above it or below it, so we wait to see which way this goes. A new entry alert, for me, would be a reversal around 112 and momentum turning positive. If this starts to trend under the 21, then the probability of it going lower increases.
Show more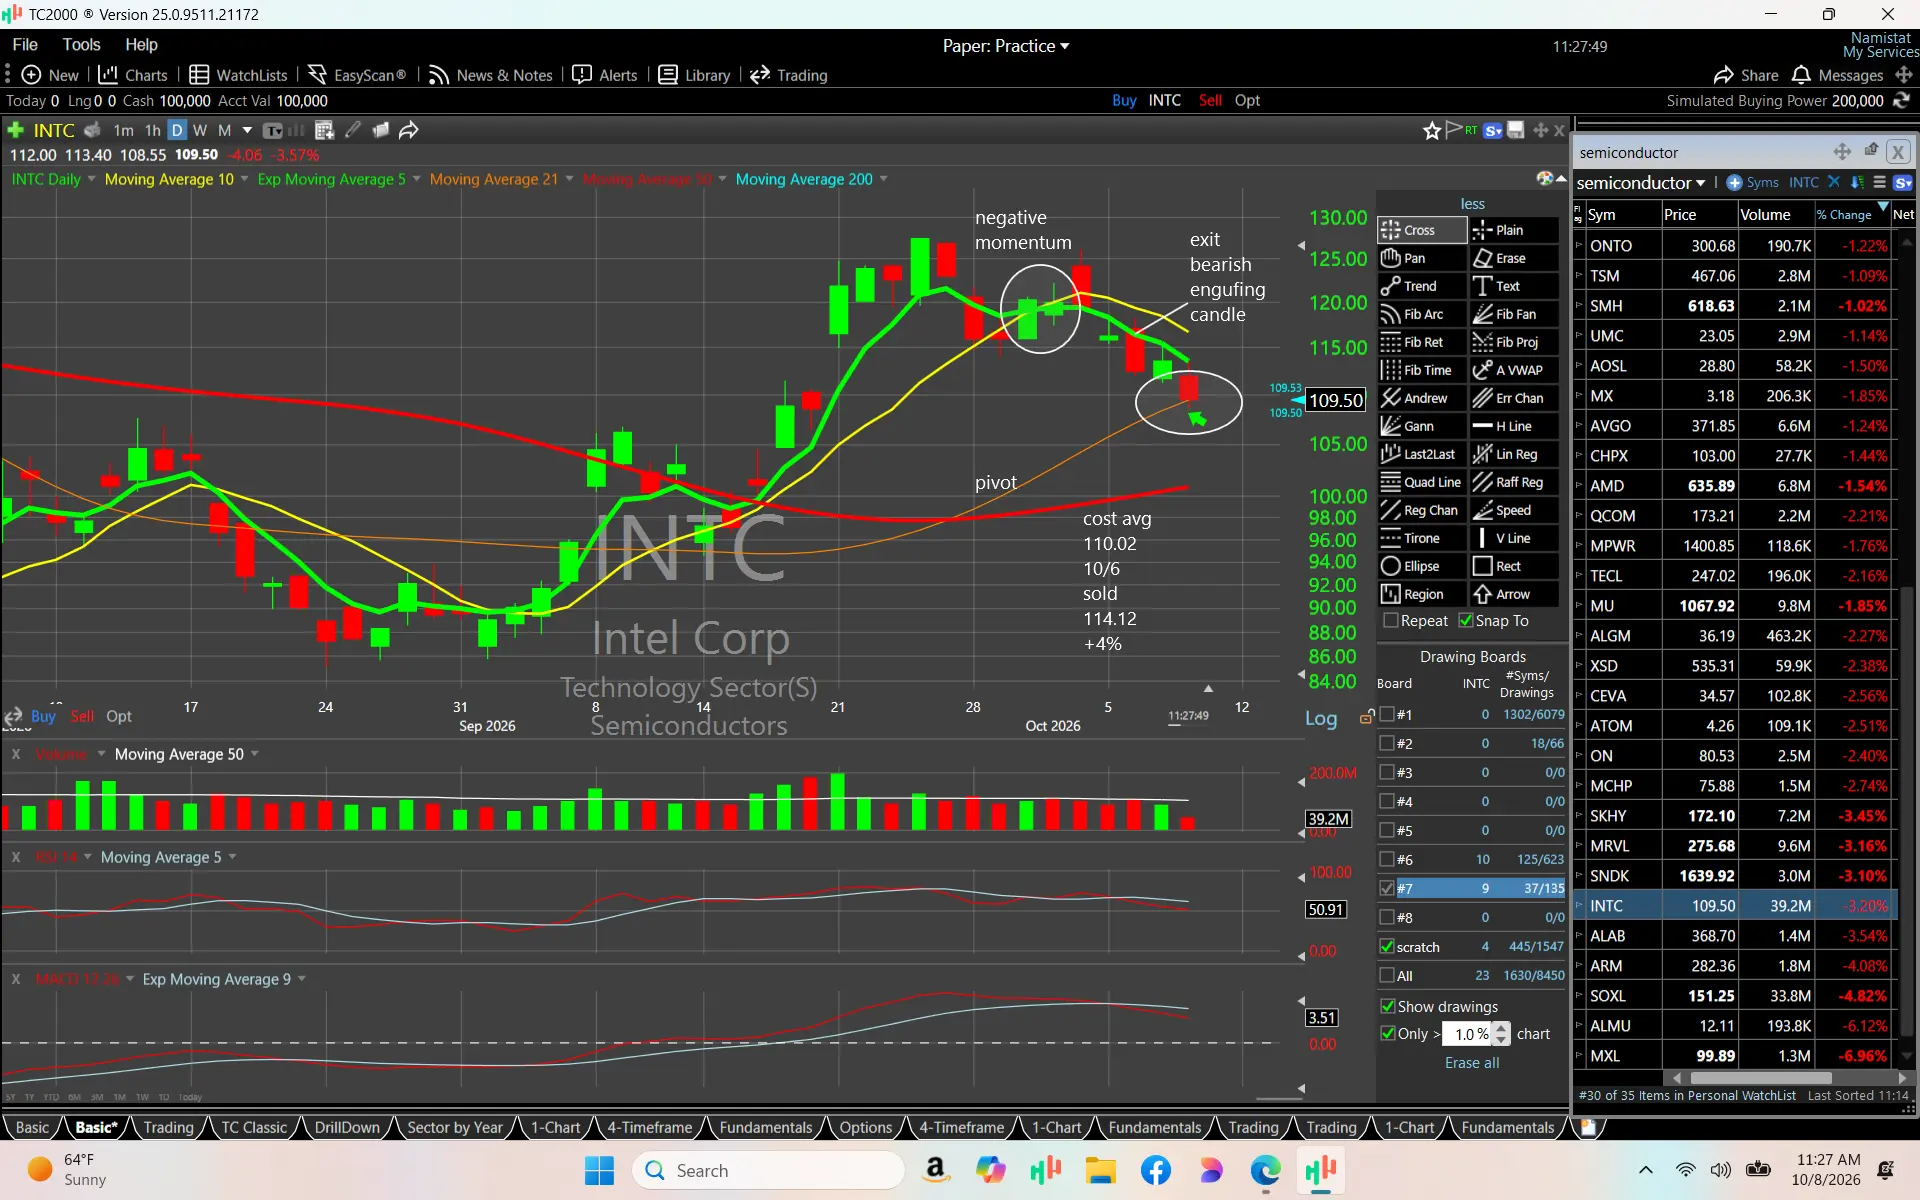

$INTC Chop Scratch Trade Recap Watch the video to learn how to trade this repeatable pattern 🎯
Show moreThis page is for research only and is not investment advice. Models can be wrong. Past performance does not guarantee future results.