
B
Bull
Bull · 25%HLLY
$1.98
Scenario price
$2.900
+0.215 (+7.41%)At close
Holley, Inc. designs, manufactures, and distributes high-performance automotive aftermarket products to car and truck enthusiasts in the United States, Canada and Europe. It owns and manages a portfolio of brands, catering to a diverse community of enthusiasts passionate about the customization and performance of their vehicles. It is a manufacturer of a diversified line of performance automotive products, including carburetors, fuel pumps, fuel injection systems, nitrous oxide injection systems, superchargers, exhaust headers, mufflers, engine tuners and automotive performance plumbing products. It also manufactures exhaust products as well as shifters, converters, transmission kits, transmissions, tuners and automotive software. Its products are designed to enhance street, off-road, recreational and competitive vehicle performance through increased horsepower, torque and drivability. Its brands include Holley, Holley EFI, MSD, Simpson, Flowmaster, EDGE, and Accel, among others.
Holley Inc (HLLY) appears to be a good buy right now at a current price of $2.75, especially considering its forward P/E ratio of 5.72, which suggests it is undervalued compared to its earnings potential. Additionally, the recent 5-day price change of +7.42% indicates positive momentum. However, the main risk is the company's year-to-date change of -33.57%, reflecting past volatility that investors should consider.
Scenario prices are the last monthly forecast band of the current year. Probabilities are fixed model weights (25 / 50 / 25), not guarantees.

Holley Partners with Universal Studios for New Roller Coaster
Holley Acquires SXTH Element to Expand Product Line
Holley and Amotiv Announce Strategic Collaboration to Expand Automotive Brands
Holley Announces Q3 2026 Financial Results Release Date
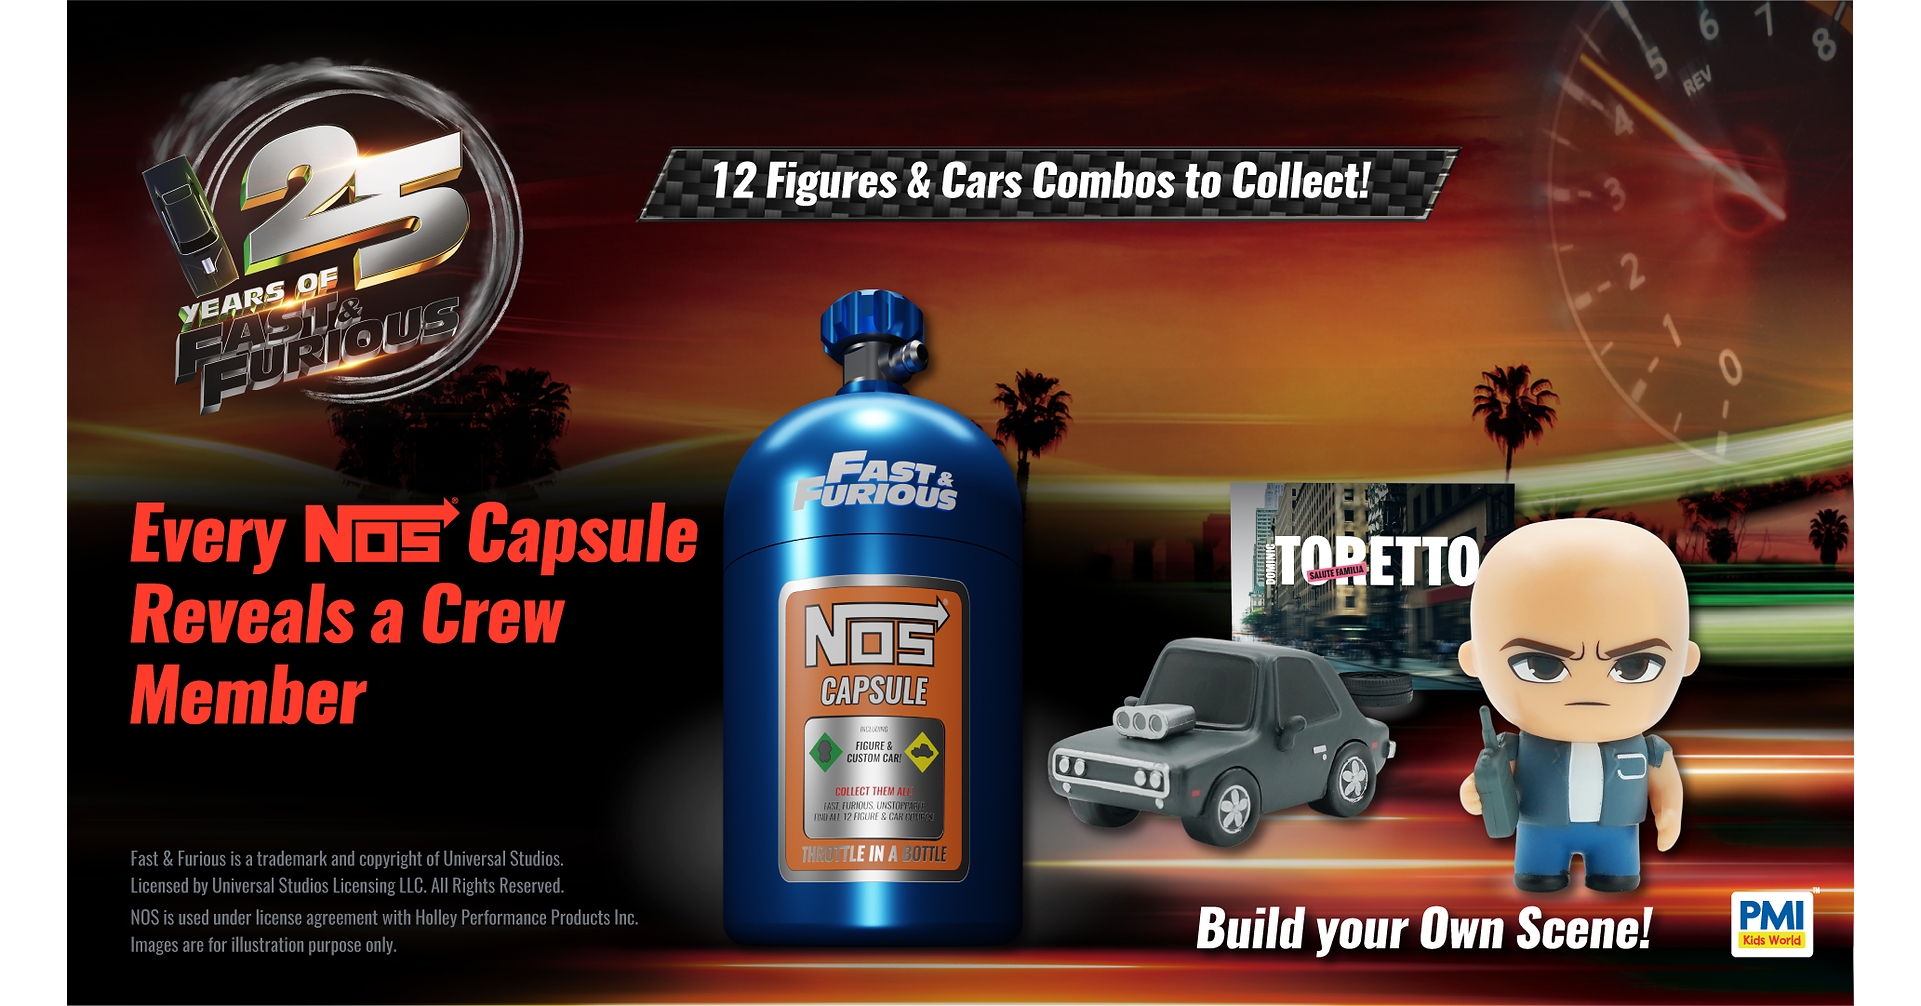
Fast & Furious 25th Anniversary Collectibles Launched
Holley, Inc. designs, manufactures, and distributes high-performance automotive aftermarket products to car and truck enthusiasts in the United States, Canada and Europe. It owns and manages a portfolio of brands, catering to a diverse community of enthusiasts passionate about the customization and performance of their vehicles. It is a manufacturer of a diversified line of performance automotive products, including carburetors, fuel pumps, fuel injection systems, nitrous oxide injection systems, superchargers, exhaust headers, mufflers, engine tuners and automotive performance plumbing products. It also manufactures exhaust products as well as shifters, converters, transmission kits, transmissions, tuners and automotive software. Its products are designed to enhance street, off-road, recreational and competitive vehicle performance through increased horsepower, torque and drivability. Its brands include Holley, Holley EFI, MSD, Simpson, Flowmaster, EDGE, and Accel, among others. It operates in the Consumer Cyclicals sector (MOTOR VEHICLE PARTS & ACCESSORIES industry).
Holley Inc (HLLY) appears to be a good buy right now at a current price of $2.75, especially considering its forward P/E ratio of 5.72, which suggests it is undervalued compared to its earnings potential. Additionally, the recent 5-day price change of +7.42% indicates positive momentum. However, the main risk is the company's year-to-date change of -33.57%, reflecting past volatility that investors should consider.
No posts yet
Sign up or log in to join the discussionThis page is for research only and is not investment advice. Models can be wrong. Past performance does not guarantee future results.