
B
Bull
Bull · 25%FLEX
$52.10
Scenario price
$100.350
-9.533 (-9.50%)At close
Flex Ltd. is an end-to-end manufacturing partner that helps a diverse customer base design, build, deliver and manage products. Its specialized capabilities include design and engineering, supply chain, manufacturing, and integrated services, plus a portfolio of power and cooling products. Its segment includes Integrated Technology Solutions (ITS), Regulated Manufacturing Solutions (RMS), and Cloud and Power Infrastructure (CPI). ITS segment serves customers building technology-driven, intelligent products that require fast innovation cycles. Its end market includes communications and lifestyle. RMS segment focuses on regulated, safety-critical markets requiring a high level of precision, compliance, and reliability. Its end market includes industrial, automotive and healthcare. CPI segment is focused on delivering integrated compute systems, power, and cooling technologies that support large-scale cloud, data center, and artificial intelligence (AI)-enabled infrastructure deployments.
Flex Ltd is a good buy right now at a current price of $119.83, especially considering its strong year-to-date change of +88.18% and a forward P/E ratio of 24.15, indicating growth potential. The main risk is the insider selling activity, which has increased by 2781.90%, suggesting some caution among insiders.
Baird
$142
2026-07-30
Baird
2026-07-30
Price Target
$142
Goldman Sachs
$154
2026-07-30
Goldman Sachs
2026-07-30
Price Target
$154
Barclays
$144
2026-07-30
Barclays
2026-07-30
Price Target
$144
Raymond James
$170
2026-07-29
Raymond James
2026-07-29
Price Target
$170
Freedom Capital
$150
2026-07-16
Freedom Capital
2026-07-16
Price Target
$150
Scenario prices are the last monthly forecast band of the current year. Probabilities are fixed model weights (25 / 50 / 25), not guarantees.
Flex Acquires EPC Power to Enhance Power Infrastructure Portfolio
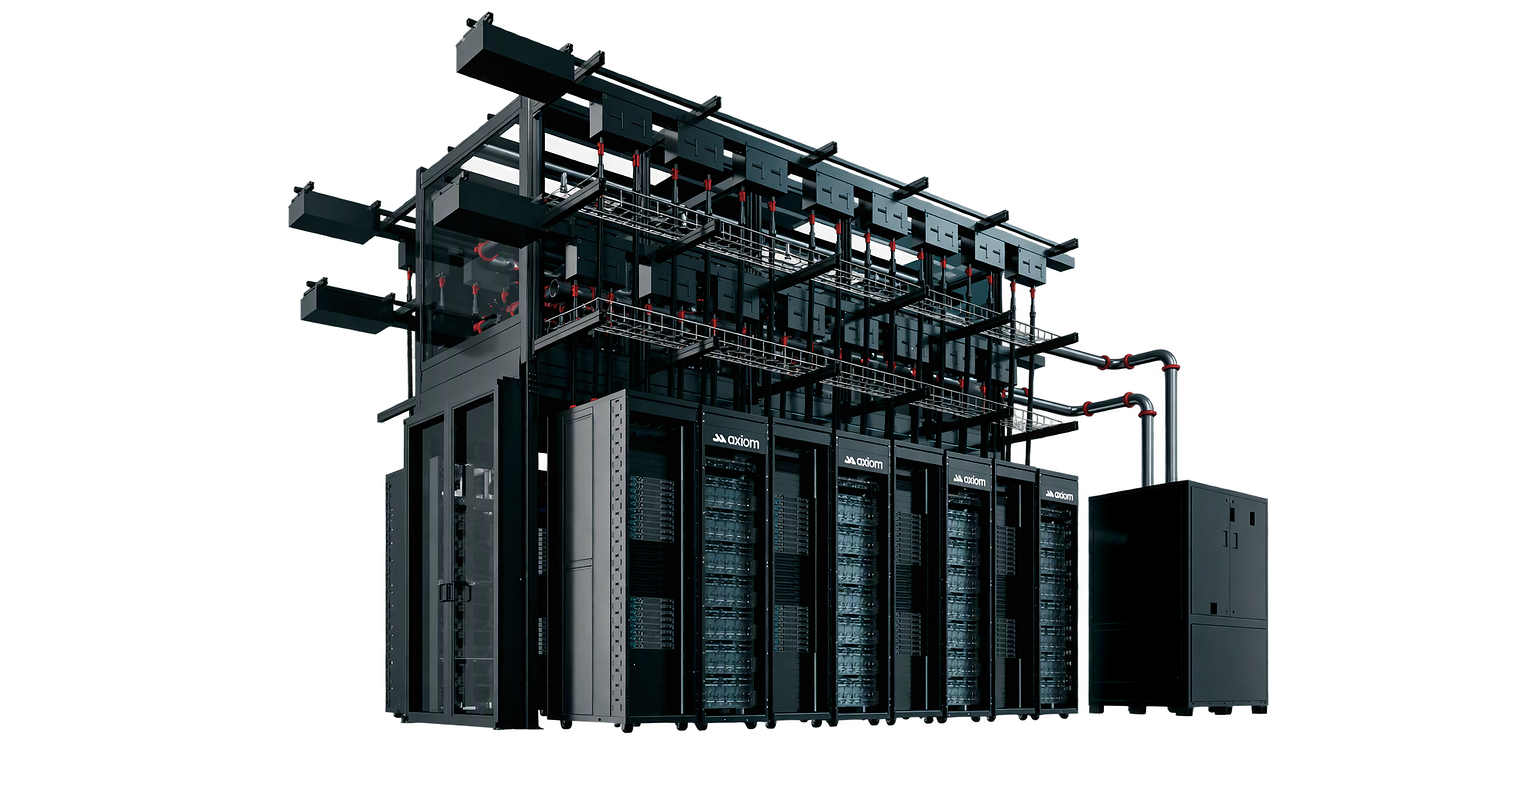
Flex to Spin Off Axiom Cloud Business by 2027
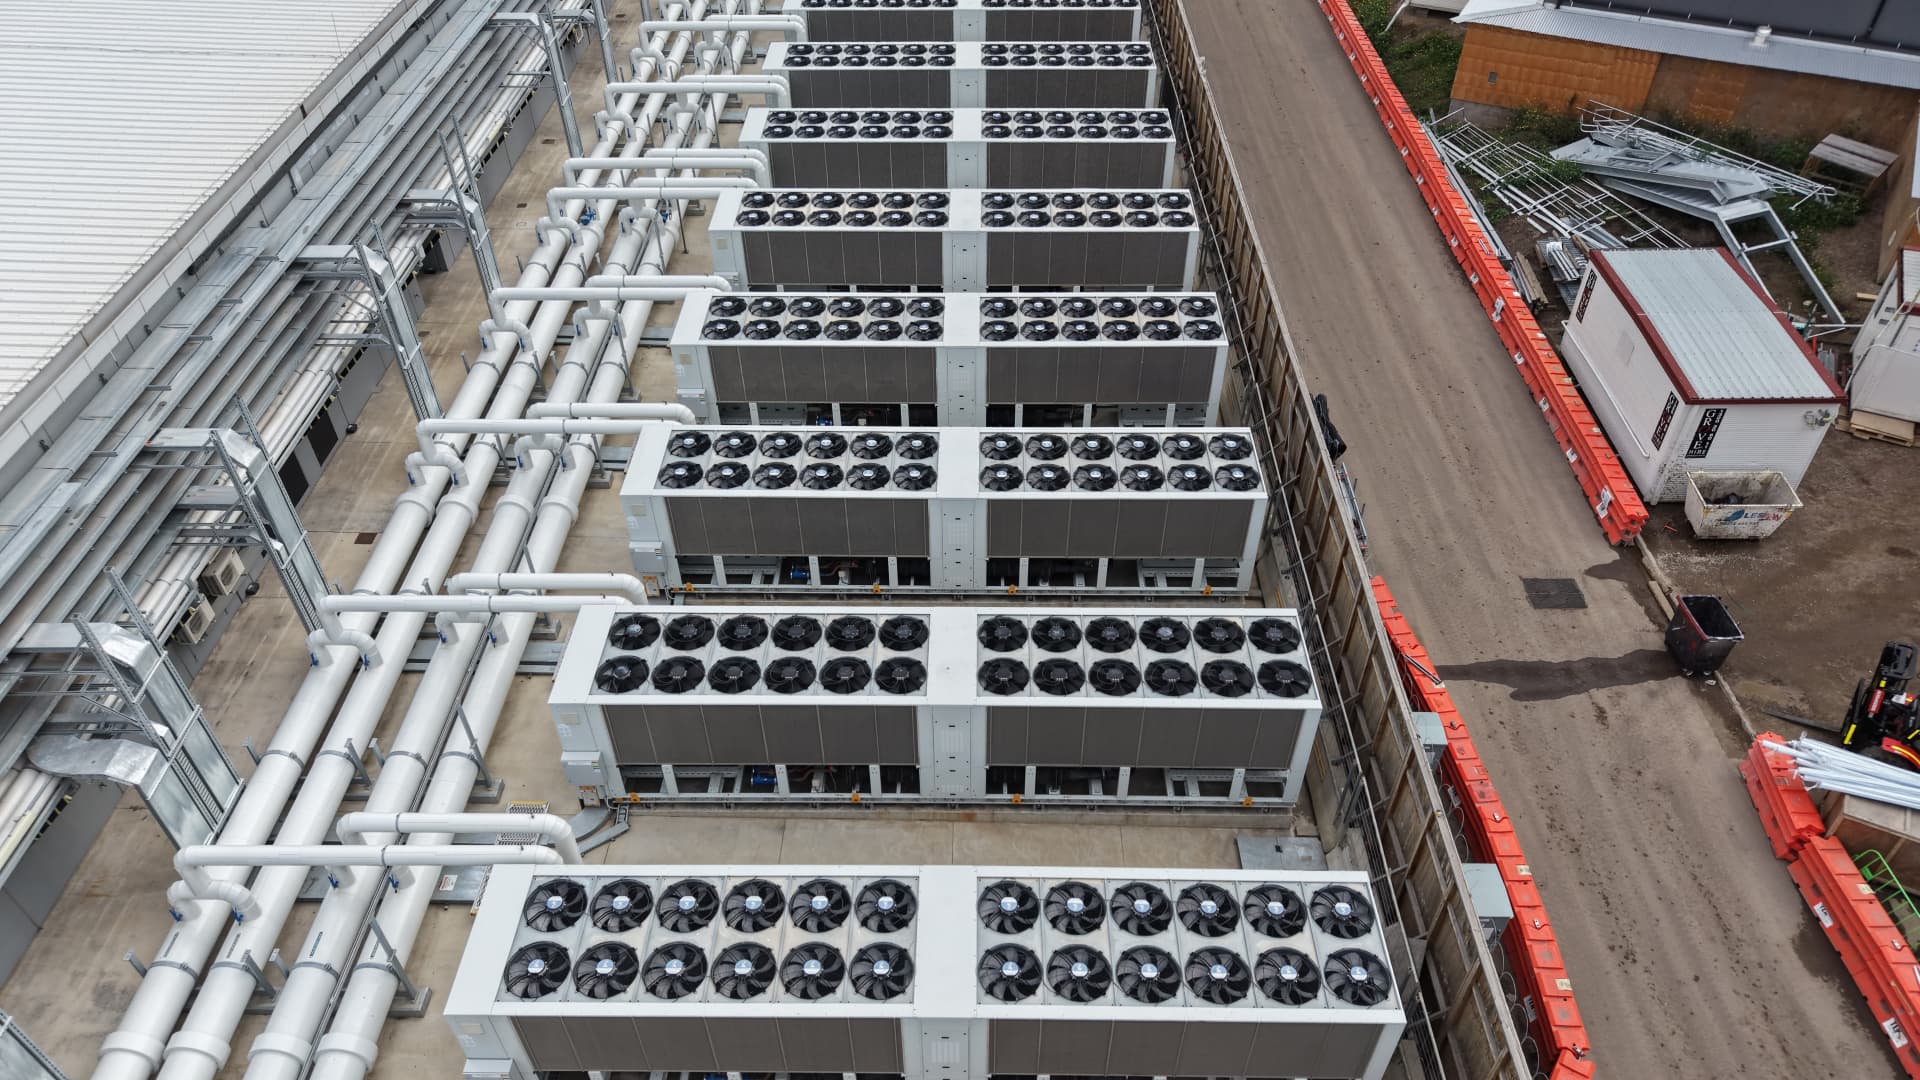
Flex Unveils New AI Modules to Accelerate Data Center Deployment
Flex to Announce Q2 FY2027 Financial Results on October 28

Flex to Announce Q2 FY2027 Financial Results on October 28
Flex Ltd. is an end-to-end manufacturing partner that helps a diverse customer base design, build, deliver and manage products. Its specialized capabilities include design and engineering, supply chain, manufacturing, and integrated services, plus a portfolio of power and cooling products. Its segment includes Integrated Technology Solutions (ITS), Regulated Manufacturing Solutions (RMS), and Cloud and Power Infrastructure (CPI). ITS segment serves customers building technology-driven, intelligent products that require fast innovation cycles. Its end market includes communications and lifestyle. RMS segment focuses on regulated, safety-critical markets requiring a high level of precision, compliance, and reliability. Its end market includes industrial, automotive and healthcare. CPI segment is focused on delivering integrated compute systems, power, and cooling technologies that support large-scale cloud, data center, and artificial intelligence (AI)-enabled infrastructure deployments. It operates in the Technology sector (PRINTED CIRCUIT BOARDS industry).
Flex Ltd is a good buy right now at a current price of $119.83, especially considering its strong year-to-date change of +88.18% and a forward P/E ratio of 24.15, indicating growth potential. The main risk is the insider selling activity, which has increased by 2781.90%, suggesting some caution among insiders.
14 analysts cover FLEX: 12 rate it Buy, 2 Hold and 0 Sell. The average price target is 76.71.

THE OCTOBER OUTLOOK & LOTS OF TRADE IDEAS. With the Nasdaq 100 ripping and testing all time highs, which stocks are setting up and what can we expect from the market in October? $GOOGL $DELL $FLEX $HPE and can $NOK break out? All fully assessed plus lots of stock picks for your Oct watchlists.
Show moreTHE OCTOBER OUTLOOK & LOTS OF TRADE IDEAS With the Nasdaq 100 ripping and testing all-time highs, which stocks are setting up and what can we expect from the market in October? $GOOGL $DELL $FLEX $HPE and can $NOK break out? All fully assessed plus lots of stock picks for your October watchlists.
Show moreThis page is for research only and is not investment advice. Models can be wrong. Past performance does not guarantee future results.