B
Bull
Bull · 25%CLS
$147.87
Scenario price
$323.320
-30.877 (-9.55%)At close
Celestica Inc. is a Canada-based company. It is engaged in designing, manufacturing and providing hardware platform and supply chain solutions. It delivers supply chain solutions globally to customers in two operating segments: Advanced Technology Solutions (ATS) and Connectivity & Cloud Solutions (CCS). The ATS segment consists of its ATS end market and comprises its Aerospace & Defense (A&D), Industrial, HealthTech, and Capital Equipment businesses. Its Capital Equipment business comprises semiconductor and display businesses. The CCS segment consists of its communications and enterprise end markets. The enterprise end market consists of Celestica’s servers and storage businesses. It offers a range of product manufacturing and related supply chain services to customers in both of its segments, including design and development, new product introduction, engineering services, component sourcing, electronics manufacturing and assembly, testing, systems integration, among others.
Celestica Inc is a good buy right now due to its strong revenue growth of 62% year-over-year in Q2 2026, and a forward P/E ratio of 18.48, which suggests it is undervalued relative to its growth prospects. The stock's current price of $362.16 is well below analyst targets, with Bernstein setting a target of $520, indicating significant upside potential. However, the stock has experienced a 6.50% decline over the past five days, which may indicate short-term volatility.
Bernstein
$520
2026-09-30
Bernstein
2026-09-30
Price Target
$520
UBS
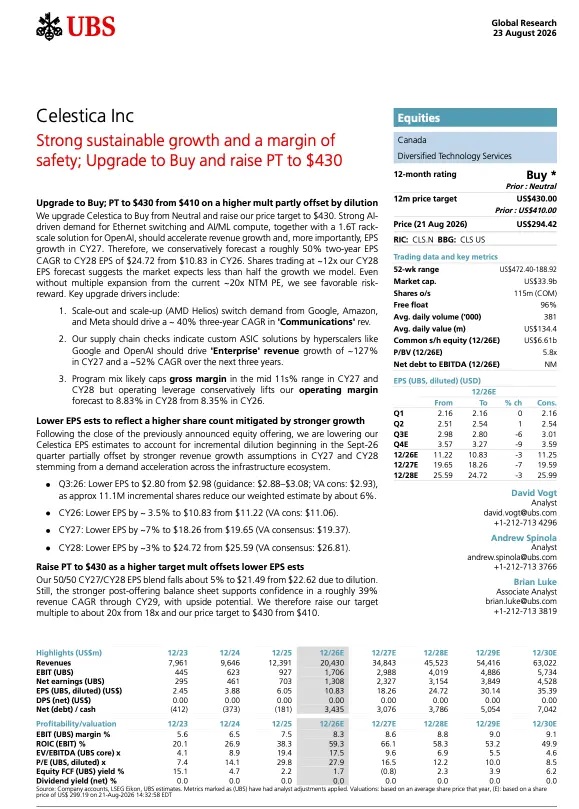
$430
2026-08-24
UBS
2026-08-24
Price Target
$430
UBS
$430
2026-08-23
UBS
2026-08-23
Price Target
$430
Scotiabank
$500
2026-08-11
Scotiabank
2026-08-11
Price Target
$500
CIBC
$500
2026-08-10
CIBC
2026-08-10
Price Target
$500
Scenario prices are the last monthly forecast band of the current year. Probabilities are fixed model weights (25 / 50 / 25), not guarantees.

Celestica Unveils New Data Center Switching System

Celestica and Marvell's Rise in AI Infrastructure

Analyst Ratings Update: Apple, Tesla, and More

Celestica CFO to Become Group President of Global Markets

Celestica Shares Cross Above 200-Day Moving Average
Celestica Inc. is a Canada-based company. It is engaged in designing, manufacturing and providing hardware platform and supply chain solutions. It delivers supply chain solutions globally to customers in two operating segments: Advanced Technology Solutions (ATS) and Connectivity & Cloud Solutions (CCS). The ATS segment consists of its ATS end market and comprises its Aerospace & Defense (A&D), Industrial, HealthTech, and Capital Equipment businesses. Its Capital Equipment business comprises semiconductor and display businesses. The CCS segment consists of its communications and enterprise end markets. The enterprise end market consists of Celestica’s servers and storage businesses. It offers a range of product manufacturing and related supply chain services to customers in both of its segments, including design and development, new product introduction, engineering services, component sourcing, electronics manufacturing and assembly, testing, systems integration, among others. It operates in the Technology sector (PRINTED CIRCUIT BOARDS industry).
Celestica Inc is a good buy right now due to its strong revenue growth of 62% year-over-year in Q2 2026, and a forward P/E ratio of 18.48, which suggests it is undervalued relative to its growth prospects. The stock's current price of $362.16 is well below analyst targets, with Bernstein setting a target of $520, indicating significant upside potential. However, the stock has experienced a 6.50% decline over the past five days, which may indicate short-term volatility.
12 analysts cover CLS: 3 rate it Buy, 9 Hold and 0 Sell. The average price target is 387.38.

$CLS Celestica initiated with an Outperform at Bernstein Bernstein analyst Daniel Zhu initiated coverage of Celestica with an Outperform rating and $520 price target. The firm rolled out coverage of the U.S. networking group with a positive view. Networking and optical companies will be "structural winners" within AI infrastructure, the analyst tells investors in a research note. Bernstein believes there is more upside than downside to AI spend expectations, and sees the risk/rewards on exposed stocks as positive. While an overbuild is still possible, demand continues to exceed supply and the assumptions needed to underwrite continued investments do not appear aggressive compared to the pace of adoption, the firm contends.
Show more
This page is for research only and is not investment advice. Models can be wrong. Past performance does not guarantee future results.