
B
Bull
Bull · 25%BARK
$1.27
Scenario price
$7.730
-0.108 (-1.40%)At close
BARK, Inc. is a dog-centric company. The Company is an omnichannel brand serving dogs across two key categories: toys & accessories and consumables. All of its products are designed, developed, and branded by BARK. The Company's segments include direct to consumer and commerce. Its products are sold Direct-to-Consumer (DTC) and through its network of retail partners. It offers BarkBox and Super Chewer, which are subscription products that feature monthly themed boxes of BARK toys and treats that are delivered directly to a dog’s home. Customers have the option to subscribe to these products on a one-month, three-month, six-month, or twelve-month basis. The Company offers its customers incremental products via ATB, which allows it to cross-sell customers its full portfolio of products, including kibble, treats, toppers, dental, and more. Its toys and accessories category also includes other products such as beds, leashes, apparel, and other accessories.
BARK Inc is not a good buy right now due to its declining financial performance and negative market sentiment. The stock has seen a year-to-date change of -33.00% and a one-year change of -56.08%, indicating significant downward pressure. Additionally, the RSI is at 35.611, suggesting the stock is nearing oversold territory, but further declines are possible. The main risk is the company's ongoing losses, with a net income of -12.66 million reported for Q4 2026, which raises concerns about its profitability moving forward.
Scenario prices are the last monthly forecast band of the current year. Probabilities are fixed model weights (25 / 50 / 25), not guarantees.
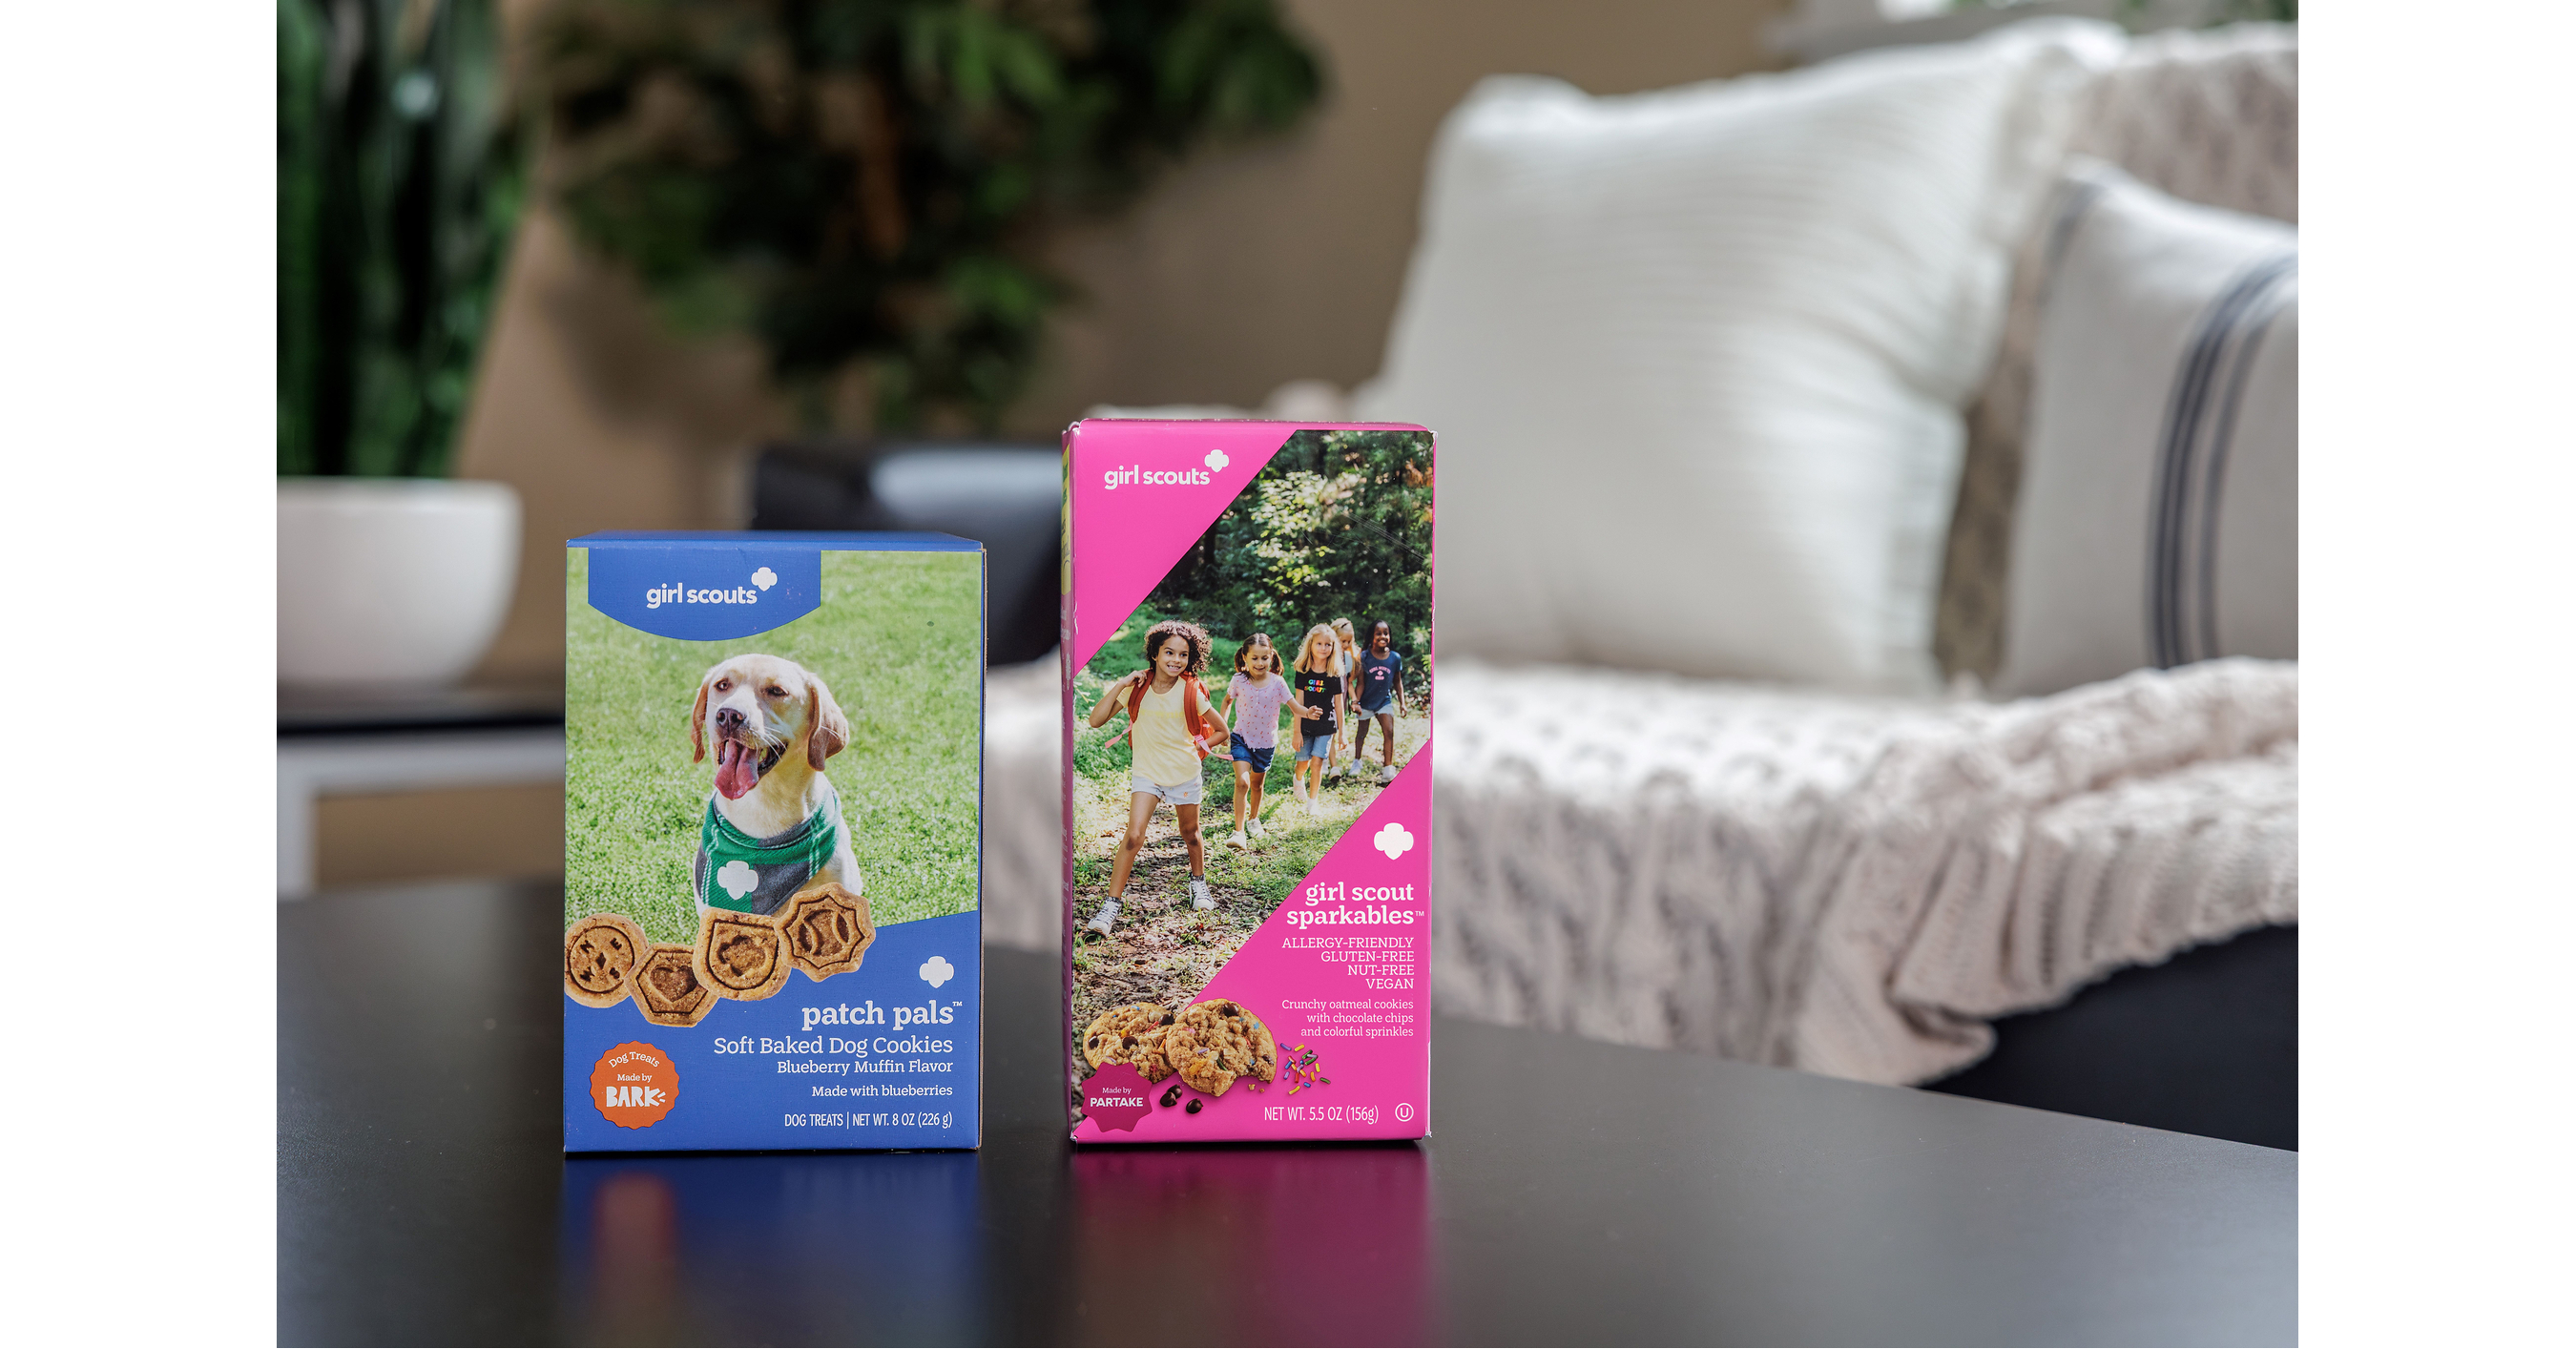
Girl Scouts Launch Unique 2027 Cookie Lineup for Dogs and Allergy-Friendly Options

BARK and Dunkin' Launch New Collection and Dog Drive-Thru Experience

BARK (BARK) Q1 2027 Earnings Call Transcript

BARK Inc Achieves Consecutive Profitability, Outlook for Future Growth

Bark (BARK) Q4 2026 Earnings Call Transcript
BARK, Inc. is a dog-centric company. The Company is an omnichannel brand serving dogs across two key categories: toys & accessories and consumables. All of its products are designed, developed, and branded by BARK. The Company's segments include direct to consumer and commerce. Its products are sold Direct-to-Consumer (DTC) and through its network of retail partners. It offers BarkBox and Super Chewer, which are subscription products that feature monthly themed boxes of BARK toys and treats that are delivered directly to a dog’s home. Customers have the option to subscribe to these products on a one-month, three-month, six-month, or twelve-month basis. The Company offers its customers incremental products via ATB, which allows it to cross-sell customers its full portfolio of products, including kibble, treats, toppers, dental, and more. Its toys and accessories category also includes other products such as beds, leashes, apparel, and other accessories. It operates in the Consumer Cyclicals sector (RETAIL-RETAIL STORES, NEC industry).
BARK Inc is not a good buy right now due to its declining financial performance and negative market sentiment. The stock has seen a year-to-date change of -33.00% and a one-year change of -56.08%, indicating significant downward pressure. Additionally, the RSI is at 35.611, suggesting the stock is nearing oversold territory, but further declines are possible. The main risk is the company's ongoing losses, with a net income of -12.66 million reported for Q4 2026, which raises concerns about its profitability moving forward.
No posts yet
Sign up or log in to join the discussionThis page is for research only and is not investment advice. Models can be wrong. Past performance does not guarantee future results.