B
Bull
Bull · 25%AMAT
$154.07
Scenario price
$408.940
+4.008 (+0.98%)At close
Applied Materials, Inc. is a materials engineering solution company. The Company provides equipment, services and software to the semiconductor, display, and related industries. It operates through two segments: Semiconductor Systems and Applied Global Services (AGS). The Semiconductor Systems segment includes semiconductor capital equipment to enable materials engineering steps including etch, rapid thermal processing, deposition, chemical mechanical planarization, metrology and inspection, wafer packaging, and ion implantation. The AGS segment provides integrated solutions to optimize equipment and fab performance and productivity, including services, spares and factory automation software for semiconductor and other products. Its products include personal computing devices, mobile phones, artificial intelligence (AI) and data center servers, automobiles, connected devices, industrial applications and consumer electronics.
Currently, Applied Materials Inc (AMAT) is not a good buy. The stock is trading at $409.29, down 19.28% over the last five days, and the RSI is extremely low at 10.695, indicating oversold conditions. Despite a strong year-to-date change of +52.23% and a forward P/E of 23.42, the recent negative sentiment in the semiconductor sector, driven by inflation concerns and insider selling increasing by 2781.51%, suggests significant risks. The main risk is the recent drop in the Philadelphia Semiconductor Index by 12%, reflecting a broader market downturn that could impact AMAT's performance.
Morgan Stanley
$563
2026-09-28
Morgan Stanley
2026-09-28
Price Target
$563
UBS
$695
2026-09-01
UBS
2026-09-01
Price Target
$695
William Blair
—
2026-08-11
William Blair
2026-08-11
Price Target
—
Erste Group
—
2026-08-05
Erste Group
2026-08-05
Price Target
—
Morgan Stanley
$646
2026-08-05
Morgan Stanley
2026-08-05
Price Target
$646
Scenario prices are the last monthly forecast band of the current year. Probabilities are fixed model weights (25 / 50 / 25), not guarantees.

Musk Drives Tesla-SpaceX Merger Talks

Tech Stocks Rebound as CoreWeave and Nebius See Bullish Sentiment

Semiconductor Index Plummets 12%, $2 Trillion in Market Value Wiped Out
Financial Comparison of Applied Materials and Broadcom

Semiconductor Manufacturers Expand to Meet AI Demand
Applied Materials, Inc. is a materials engineering solution company. The Company provides equipment, services and software to the semiconductor, display, and related industries. It operates through two segments: Semiconductor Systems and Applied Global Services (AGS). The Semiconductor Systems segment includes semiconductor capital equipment to enable materials engineering steps including etch, rapid thermal processing, deposition, chemical mechanical planarization, metrology and inspection, wafer packaging, and ion implantation. The AGS segment provides integrated solutions to optimize equipment and fab performance and productivity, including services, spares and factory automation software for semiconductor and other products. Its products include personal computing devices, mobile phones, artificial intelligence (AI) and data center servers, automobiles, connected devices, industrial applications and consumer electronics. It operates in the Technology sector (SEMICONDUCTORS & RELATED DEVICES industry).
Currently, Applied Materials Inc (AMAT) is not a good buy. The stock is trading at $409.29, down 19.28% over the last five days, and the RSI is extremely low at 10.695, indicating oversold conditions. Despite a strong year-to-date change of +52.23% and a forward P/E of 23.42, the recent negative sentiment in the semiconductor sector, driven by inflation concerns and insider selling increasing by 2781.51%, suggests significant risks. The main risk is the recent drop in the Philadelphia Semiconductor Index by 12%, reflecting a broader market downturn that could impact AMAT's performance.
21 analysts cover AMAT: 20 rate it Buy, 1 Hold and 0 Sell. The average price target is 288.05.

🌈 Gate Live Stream Ideas – October 14 Trending topic suggestions: 🔹 Korean chip stocks stage a comeback! SK Hynix and Samsung Electronics both rose over 3%. After yesterday's panic selling, has capital rushed back in today? 🔹 All three major U.S. stock indexes closed lower! The market suddenly stalled before the CPI release. Is the next shift for U.S. stocks coming tonight? 🔹 "Big Short" Michael Burry is back again! Betting on a decline in the Nasdaq and semiconductors, warning of a peak within 9 months. Is the AI bull market really over? 🔹 Applied Materials spends $5 billion! AI chip R&D timelines could be cut in half. Who will benefit in the next round of the semiconductor battle? 🔹 Bears are starting to gain the upper hand! Funding rates on CEX and DEX weakened in sync. Will BTC continue to decline? 🔹 OP surged 24% in one day! The Ethereum L2 sector broke out across the board, and funds are starting to buy oversold altcoins. Where is the next coin to double? 🔹 CPI is coming tonight! If inflation exceeds expectations, the Fed may resume rate hikes. How big an impact will BTC and U.S. stocks face? 🔹 The probability of a rate hike in October has reached 23.8%! The market has shifted from hoping for cuts to worrying about hikes. Will tonight's CPI completely rewrite the trading direction? 🔹 Fed's Williams sends another hawkish signal! There may be one more rate hike this year. How long will the high-rate era last? 🔹 Another major development in the Middle East! The U.S. and Israel are reportedly discussing another strike on Iran. How will oil, gold, and BTC react? Choose any topic to start streaming, and you may have a chance to be featured on the homepage! 🔥 More topic ideas and tips:
Show more


$AMAT The weekly 50MA has been a key indicator for shifts between bullish and bearish trends. As long as it remains above this important moving average, a major sell-off is unlikely. That said, it is sitting uncomfortably close to the major red resistance trendline.
Show more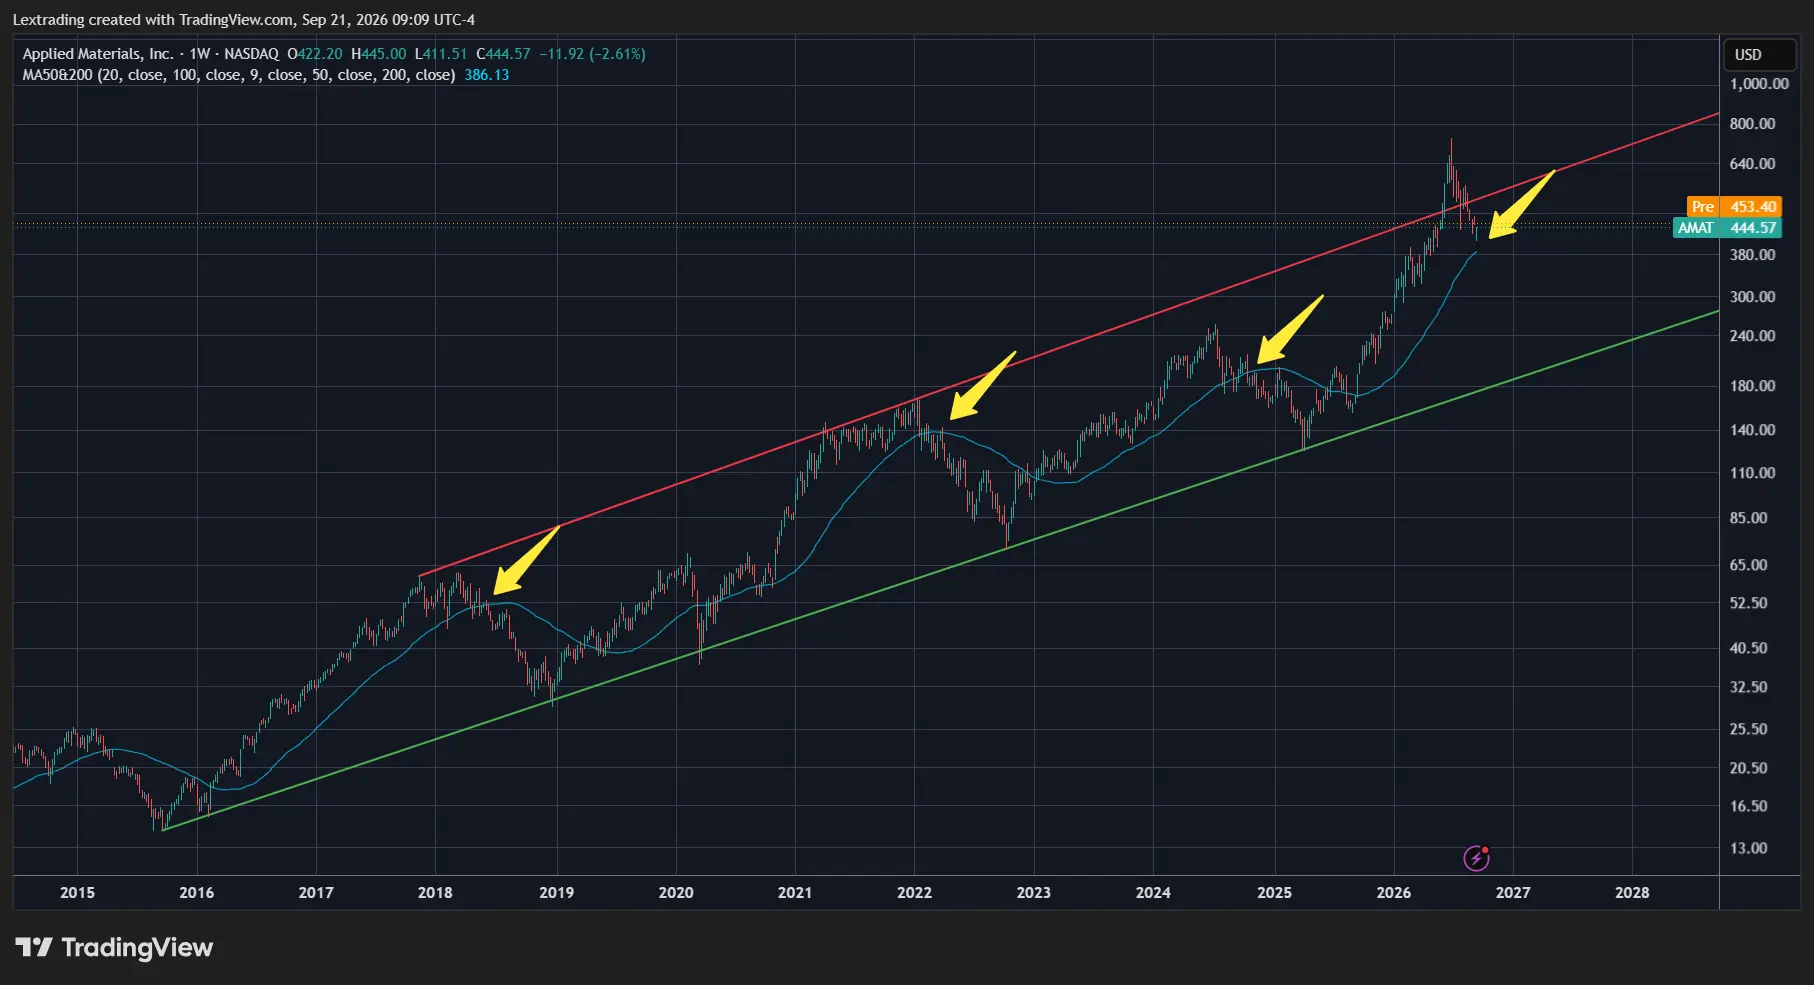

$AMAT is holding the 200 MA. Should be good for a bounce here. Chart via @Marketsurge #ibdpartner.
Show more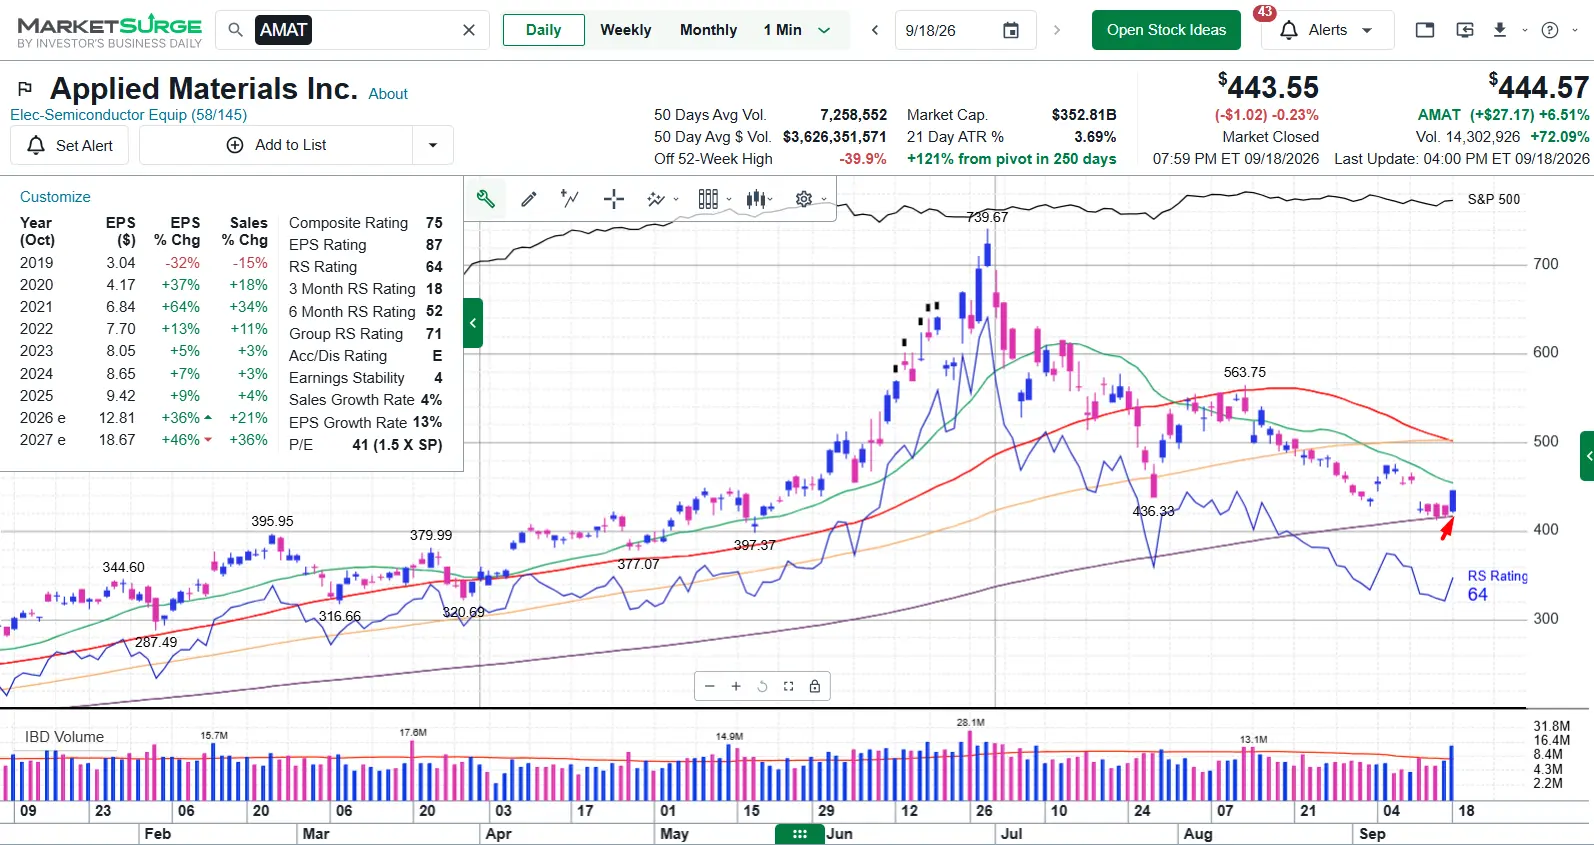
This page is for research only and is not investment advice. Models can be wrong. Past performance does not guarantee future results.