
強
強気
強気 · 25%VET
$8.15
シナリオ価格
$13.920
+0.486 (+3.49%)終値時点
Vermilion Energy Inc. is a Canada-based global gas producer. The Company seeks to create value through the acquisition, exploration, development, and optimization of producing assets in North America, Europe, and Australia. Its geographical segments include Canada, USA, France, Netherlands, Germany, Ireland, Australia, and Central & Eastern Europe (CEE). Its operations are focused on the exploitation of light oil and liquids-rich natural gas conventional and unconventional resource plays in North America and the exploration and development of conventional natural gas and oil opportunities in Europe and Australia. Its Canadian production and assets are focused on West Pembina near Drayton Valley, Alberta, in the Peace River Arch in northeast British Columbia and northwest Alberta and in southeast Saskatchewan and southwest Manitoba. Its assets in France are located in Aquitaine and Paris Basins. In Netherlands, its producing assets are located in the northwest part of the country.
Vermilion Energy is a good buy right now due to its strong recent performance and positive outlook. The current price is $13.20, and the stock has shown a remarkable year-to-date change of +54.57%. Additionally, the company reported a strong Q2 with an EPS of $0.88 and a significant net debt reduction of approximately $840 million, which enhances financial stability. The RSI is at 89.611, indicating strong momentum, although it is approaching overbought territory. The main risk is the recent downgrade by analysts, suggesting caution despite the stock's impressive rally, which could lead to volatility.
CIBC
$23
2026-10-09
CIBC
2026-10-09
目標株価
$23
TD Securities
$19
2026-07-31
TD Securities
2026-07-31
目標株価
$19
Scotiabank
$17
2026-07-17
Scotiabank
2026-07-17
目標株価
$17
RBC Capital
$24
2026-05-19
RBC Capital
2026-05-19
目標株価
$24
Scotiabank
$19
2026-04-21
Scotiabank
2026-04-21
目標株価
$19
シナリオ価格は本年の最終月次予想レンジです。確率はモデルの固定ウェイト(25 / 50 / 25)であり、保証ではありません。

Vermilion Energy to Release Q3 Financial Results on November 4, 2026

Vermilion Energy Reports Strong Q2 2026 Earnings Highlights

Vermilion Energy Reports Strong Q2 2026 Financial Results

Vermilion Energy Announces Cash Dividend

Vermilion Energy Reports Q2 2026 Financial Results and Production Guidance Increase
Vermilion Energy Inc. is a Canada-based global gas producer. The Company seeks to create value through the acquisition, exploration, development, and optimization of producing assets in North America, Europe, and Australia. Its geographical segments include Canada, USA, France, Netherlands, Germany, Ireland, Australia, and Central & Eastern Europe (CEE). Its operations are focused on the exploitation of light oil and liquids-rich natural gas conventional and unconventional resource plays in North America and the exploration and development of conventional natural gas and oil opportunities in Europe and Australia. Its Canadian production and assets are focused on West Pembina near Drayton Valley, Alberta, in the Peace River Arch in northeast British Columbia and northwest Alberta and in southeast Saskatchewan and southwest Manitoba. Its assets in France are located in Aquitaine and Paris Basins. In Netherlands, its producing assets are located in the northwest part of the country. It operates in the Energy sector (CRUDE PETROLEUM AND NATURAL GAS industry).
Vermilion Energy is a good buy right now due to its strong recent performance and positive outlook. The current price is $13.20, and the stock has shown a remarkable year-to-date change of +54.57%. Additionally, the company reported a strong Q2 with an EPS of $0.88 and a significant net debt reduction of approximately $840 million, which enhances financial stability. The RSI is at 89.611, indicating strong momentum, although it is approaching overbought territory. The main risk is the recent downgrade by analysts, suggesting caution despite the stock's impressive rally, which could lead to volatility.
1 analysts cover VET: 1 rate it Buy, 0 Hold and 0 Sell. The average price target is 9.87.

VeChain ($VET) is showing signs of a potential recovery after recording a 6.71% daily price increase, despite remaining down 2.82% over the past week. The token trades near $0.00714, with a market capitalization of approximately $613.7 million and daily trading volume exceeding $8.6 million. Buyers Target a Break Above $26.46 $VVV currently faces its first major challenge around $26.46. Buyers need to clear that level before the token can build stronger upward momentum. A decisive move above $26.46 could bring $28 into focus. Moreover, sustained buying could push the token toward the $30 psychological level. The $32 area remains the bigger test for the recovery. Sellers previously limited advances around that region. Therefore, traders may watch the level closely if $VVV extends its rally. Additionally, the token continues to trade above several important exponential moving averages. That positioning suggests buyers still hold an advantage over the longer term. However, $VVV must maintain that structure to preserve its bullish outlook. $VVV has immediate support around $25.55, which currently provides an important defense. A sustained move below that level could weaken the recovery attempt. Consequently, traders may shift attention toward $24.40 and $23.46 if selling pressure increases. The $22.79 region represents a deeper support area. Holding above these levels could help buyers rebuild momentum. The Stochastic RSI also points toward improving short-term momentum. The faster indicator line has moved above the slower line. Significantly, that shift suggests buyers have started returning after the recent consolidation. $VET Sees Fresh Trading Activity VeChain has also attracted renewed attention after several periods of weaker market participation. $VET currently carries a market capitalization near $614 million. Its circulating supply stands at approximately 86 billion tokens. Trading activity remains relatively modest compared with earlier periods of stronger speculation. Nevertheless, recent price gains suggest that buyers have started returning to the market. $VET's derivatives market provides another important signal. Open interest previously exceeded $150 million during periods of intense speculation. However, traders later closed many positions, causing open interest to fall sharply. Recent data places open interest near $34.54 million. Consequently, current participation appears more cautious than during previous speculative surges. Capital Flows Could Shape the Next Move Spot market flows also provide some encouragement for $VET bulls. Earlier periods featured frequent outflows as sellers dominated trading activity. However, September and October produced several notable inflow spikes. Some of those inflows exceeded $600,000, suggesting stronger accumulation from market participants. The latest reading showed a smaller inflow of about $15,720. Significantly, continued positive inflows could provide $VET with additional support. Conversely, renewed outflows could increase selling pressure and weaken its recovery attempt. Technical Outlook for VeChain Price Key levels remain important for VeChain as $VET attempts to build a recovery: Upside levels: $0.00730, $0.00750, and $0.00780 represent immediate hurdles. A decisive breakout could open the path toward $0.00820 and $0.00900. Downside levels: $0.00700 provides the first support, followed by $0.00680 and $0.00650. A deeper decline could bring the $0.00620 region into focus. Momentum trigger: $VET needs sustained buying above $0.00750 to strengthen its short-term bullish outlook. Rising open interest could also confirm stronger participation from derivatives traders. Will VeChain Go Up? VeChain's near-term outlook depends on whether buyers can defend the $0.00700 area. Stronger spot inflows could help $VET challenge the $0.00750–$0.00780 resistance cluster. If buying pressure strengthens, $VET could retest $0.00820 before targeting $0.00900. However, renewed outflows could weaken the recovery and push $VET toward $0.00680 or lower. For now, $VET remains at an important technical crossroads. Improving inflows and rising open interest could support a stronger recovery. However, traders may need confirmation above resistance before expecting a sustained upward move.
もっと見る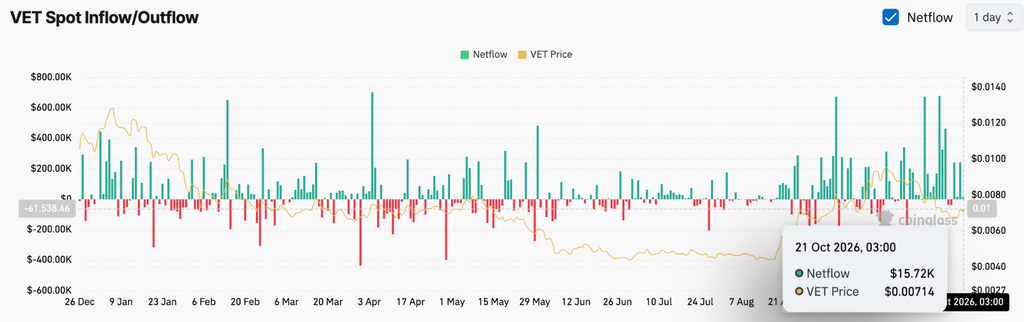

$VET VETUSDT traders are watching a potential 10% upside for VeChain. Price has been moving in a descending channel on the 1-hour timeframe and has now reached the lower boundary, appearing ready to bounce, suggesting a possible upward move after retesting this level. RSI shows a bearish trend, but with the 1-hour chart in oversold territory, an upward breakout is possible. An orange trendline supports a potential upward rebound. There is initial support at 0.007350, acting as the main support zone. There is a key support zone at 0.007123, marked in green; price has bounced from this area multiple times, making it a strong support level. Price is moving toward the 200-period moving average, which is now very close; this supports the upside trend. Entry price: 0.007961 Target 1: 0.008090 Target 2: 0.008241 Target 3: 0.008400 Stop loss: located in the green resistance zone. Remember this simple rule: money management. Thank you.
もっと見る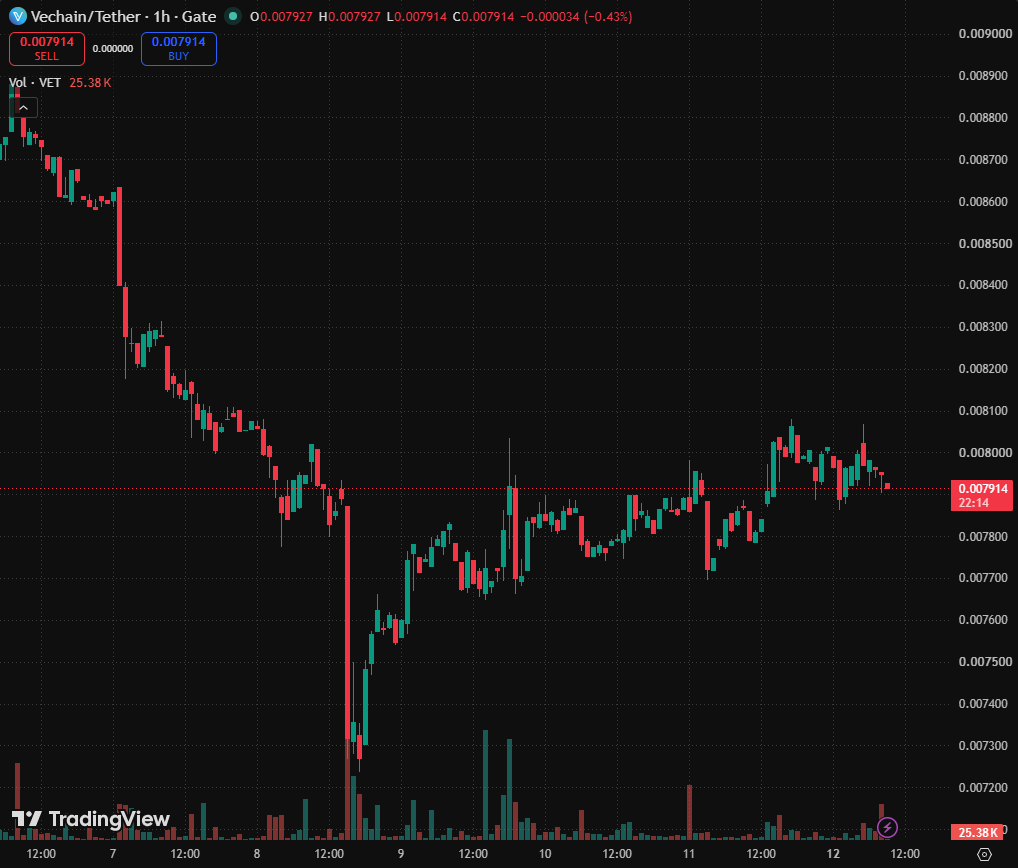

The altcoin market cap’s monthly MACD has reportedly turned bullish after 19 months of negative momentum. RAY, ENA, CRV, VET, and HBAR represent different sectors across DeFi, infrastructure, and enterprise blockchain. Rising capitalization, trading volume, liquidity, and network activity could provide additional confirmation of the broader trend. The altcoin market has recorded a notable technical shift after its monthly MACD reportedly flipped bullish for the first time in 19 months. The signal has drawn attention because similar momentum changes previously appeared before extended altcoin advances. The previous two comparable signals were followed by periods of sustained gains across altcoins, according to the market setup being monitored. However, historical patterns do not guarantee that the current signal will produce the same result. Confirmation could instead depend on whether total altcoin capitalization continues rising, trading activity expands, and market liquidity moves beyond Bitcoin and Ethereum. A sustained improvement across those areas would provide additional evidence that the technical change is being supported by broader market participation. Several altcoins could receive increased attention if capital begins moving into different sectors of the market. Raydium, Ethena, Curve DAO, VeChain, and Hedera each represent distinct blockchain use cases and could respond differently to changing market conditions. Raydium Gains Exposure to Solana’s DeFi Activity Raydium is a decentralized exchange and automated market maker (AMM) built on the Solana blockchain. It’s closely linked with decentralized finance and trading on Solana, as its ecosystem has been enriched with features such as token swaps and token launches. Therefore, RAY may be sensitive to the trading volume and liquidity of SOL. Increased activity on decentralized applications may lead to higher swap and liquidity demands on decentralized exchanges. The overall market conditions, liquidity levels, and activity in the Solana blockchain will continue to influence the token’s performance. Ethena Builds Around the Synthetic Dollar Market Ethena is a Decentralized Finance protocol based on a synthetic dollar, USDe, whose value is tied to the dollar by means of the crypto mechanism. Applications are also involved in derivatives, lending and more DeFi. ENA serves as the governance token of the protocol, and is linked to the development of the broader Ethena ecosystem. Activity on the market can thus be affected by the demand for synthetic-dollar and more general DeFi involvement. Curve Remains Focused on DeFi Liquidity Curve is a decentralized exchange designed primarily around efficient trading between stablecoins and similarly valued digital assets. Its infrastructure has also expanded into lending and other decentralized finance services. CRV is the governance token associated with the Curve ecosystem. Greater DeFi liquidity and trading activity could affect attention toward Curve, although the token remains exposed to volatility across the wider cryptocurrency market. VeChain Targets Enterprise Blockchain Use Cases VeChain is a blockchain network focused on enterprise applications, data management, and supply-chain-related use cases. Its ecosystem is designed to support businesses using blockchain technology for tracking, verification, and digital records. VET is part of VeChain’s native token structure and remains influenced by both cryptocurrency market conditions and developments surrounding blockchain adoption. A broader rotation into established blockchain projects could place additional attention on the token. Hedera Expands Its Tokenization and Infrastructure Role Hedera is a hashgraph consensus technology based public distributed ledger network. It has a network that allows smart contracts, tokenization of assets, decentralized applications, and consensus services. HBAR is utilized for network functions and transaction fees in the Hedera ecosystem. The network’s enterprise focus and its tokenization also puts it in many emerging segments of blockchain infrastructure. What the Bullish MACD Signal Means for Altcoins 19-month MACD is an important technical development that is crucial for the whole altcoin sector. Historical context is provided by previous bull crossovers, but traders can wait for a more solid confirmation before considering the bull cross to be the start of a bull market rally. Liquidity, trading volume, network activity, and market conditions could impact the performance of RAY, ENA, CRV, VET, and HBAR in the future. The MACD is one factor, while the price structure and market participation may determine if that momentum change continues to take place.
もっと見る

$SUI $KAITO $VET If you're serious about improving your trading knowledge, Craig is definitely someone worth learning from. His approach is detailed without making things unnecessarily complicated, and he consistently emphasizes the things that actually matter. Understanding the market, managing risk, and staying disciplined. I've taken a lot from his teachings and continue to learn from his content. One of the best decisions I made in my trading journey was learning from Craig. Thanks, Craig, for showing that successful trading is built on patience, education, and consistency, not hype.
もっと見る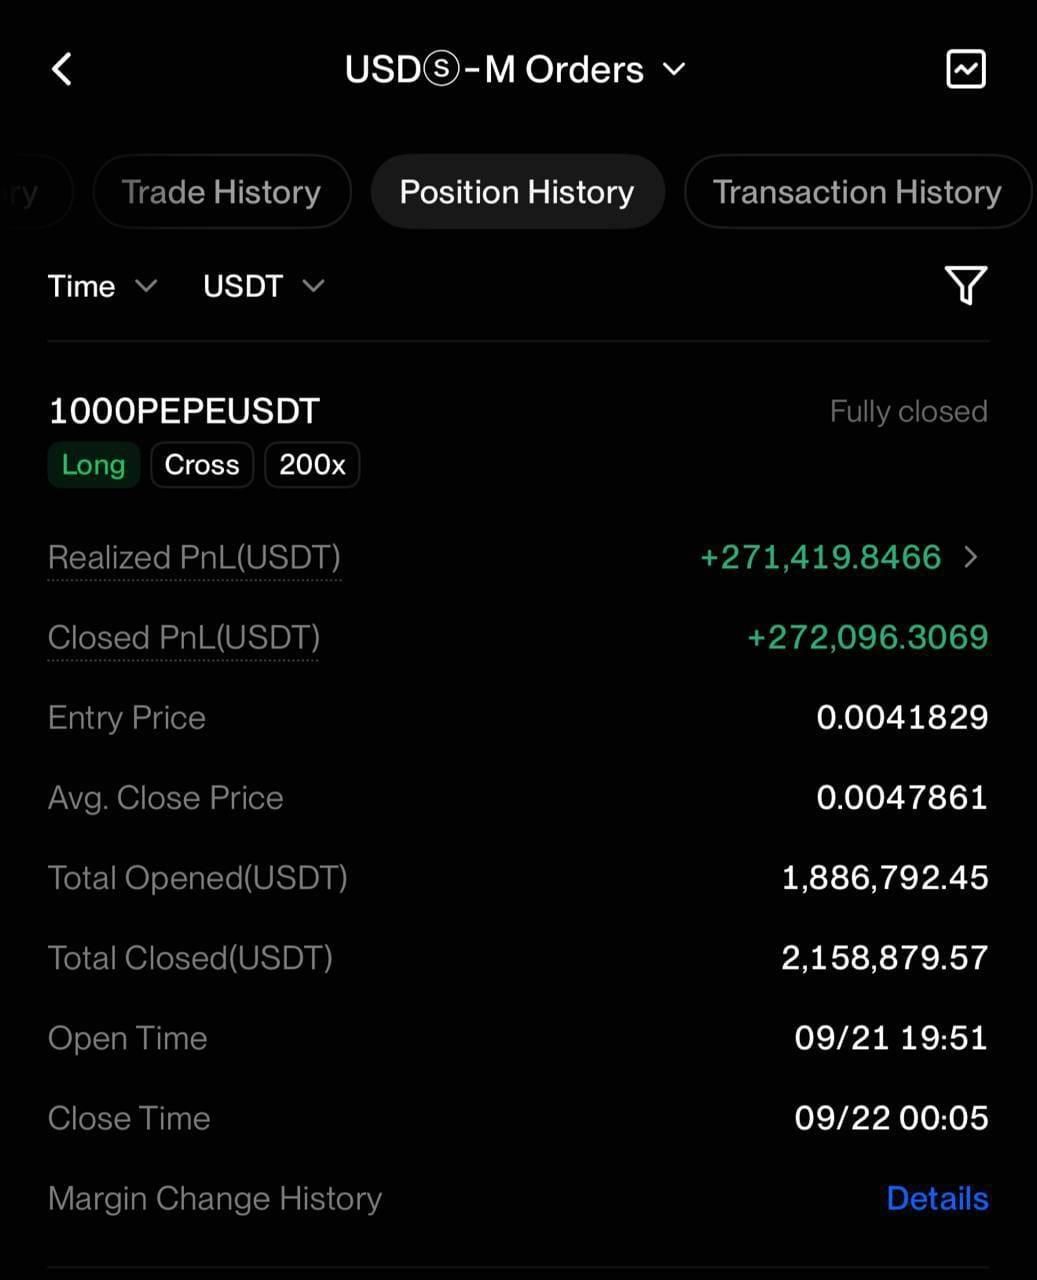

$VTHO pumped 20% in a day, with over 100 million in volume. It's now at 0.0008, right at the 24h high. Should I chase this level? I'm so torn I'm losing my hair. 3 bullish points: 1. Volume exploded — 103M in volume is huge for a small-cap like VTHO, meaning real money is entering; 2. It closed at the high, bulls are in full control, no selling pressure; 3. VeChain's fundamentals speak for themselves — it's one of the healthiest enterprise-level chains out there. 3 bearish points: 1. Chasing after a 20% single-day move is a classic exit liquidity spot; 2. The 0.0008 round number has a lot of trapped positions above it; 3. No narrative driving it, purely capital-driven, and fast money will dump quickly. Plan: For spot, scale in near 0.00072, stop loss at 0.00065, exit if it breaks down, don't hold and hope. If chasing, only use 20% of position, take profit at 0.0009. Comment 1 if you think it goes up, 2 if you think it crashes. #WeeklyCheckIn
もっと見る
本ページは調査目的であり、投資助言ではありません。モデルは誤ることがあります。過去の実績は将来の成果を保証しません。